The Economics and Statistics Division maintains archives of previous publications for accountability purposes, but makes no updates to keep these documents current with the latest data revisions from Statistics Canada. As a result, information in older documents may not be accurate. Please exercise caution when referring to older documents. For the latest information and historical data, please contact the individual listed to the right.
<--- Return to Archive
For additional information relating to this article, please contact:
October 09, 2025HOUSEHOLD INCOME AND CONSUMPTION, Q2 2025 Household Income and Outlay
In addition to compensation of employees, household income also includes net mixed income (generated from unincorporated businesses), property income received (generated as the result of ownership of assets) and current transfers received (generally from government).
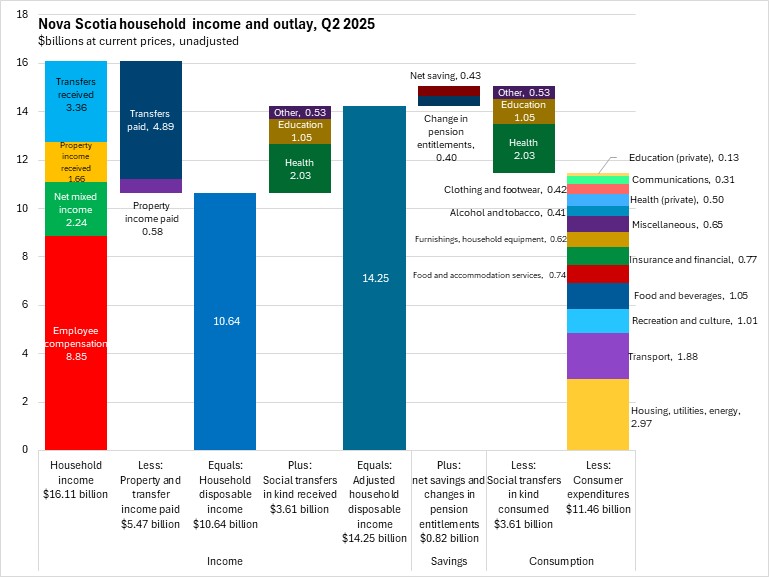
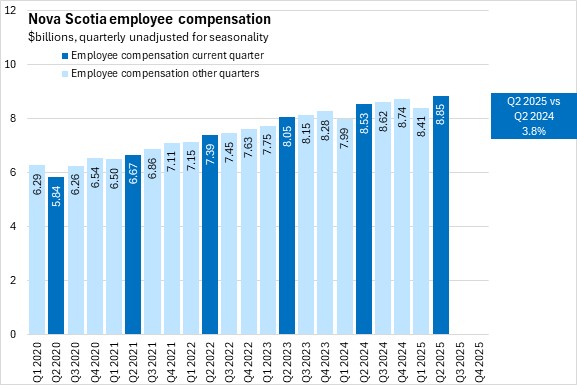
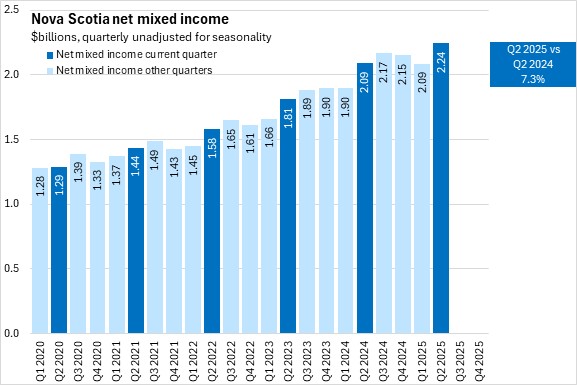
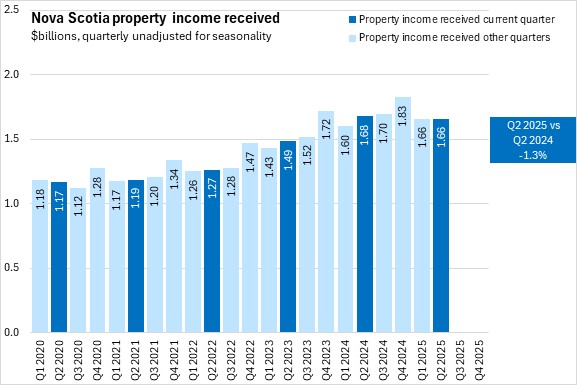
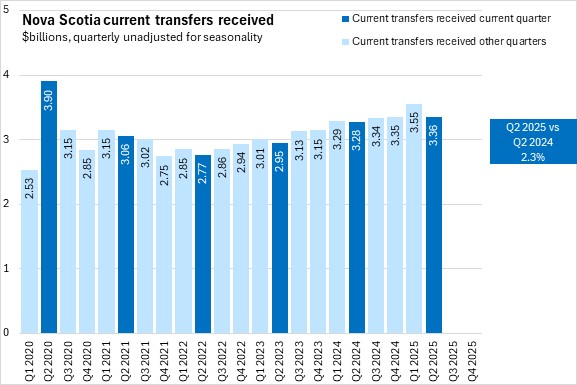
Nova Scotians received $16.11 billion in household income in Q2 2025, including $8.85 billion in employee compensation, $2.24 billion in net mixed income from unincorporated business ownership, $1.66 billion in property income receipts and $3.36 billion in current transfers received.
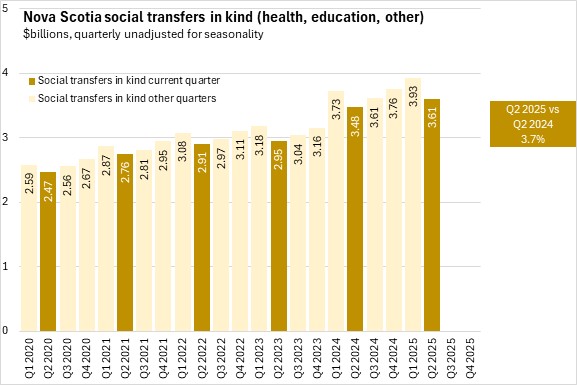
After paying current transfers (including income taxes) of $4.89 billion and property income of $0.58 billion, Nova Scotia disposable income was $10.64 billion in Q2 2025. Including the $3.61 billion value of social transfers in kind received from governments or non-profits in the form of services provided for households, Nova Scotia had adjusted disposable income of $14.25 billion.
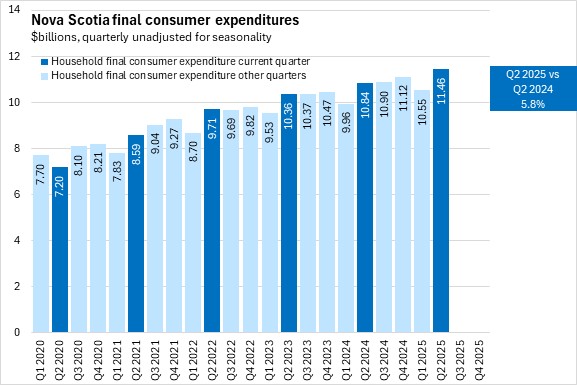
The consumption of social transfers in kind matches the value of social transfers received ($3.61 billion), while households spent $11.46 billion on consumer expenditures. The value of household final consumption expenditures and social transfers in kind was greater than the adjusted household disposable income, with the excess coming from negative net savings of $0.43 billion in household savings and a $0.40 billion change in pension entitlements.
Household income
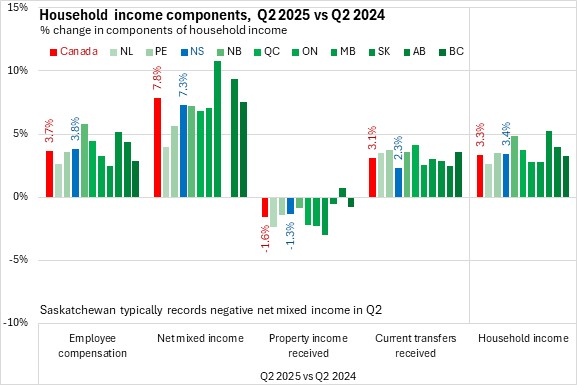
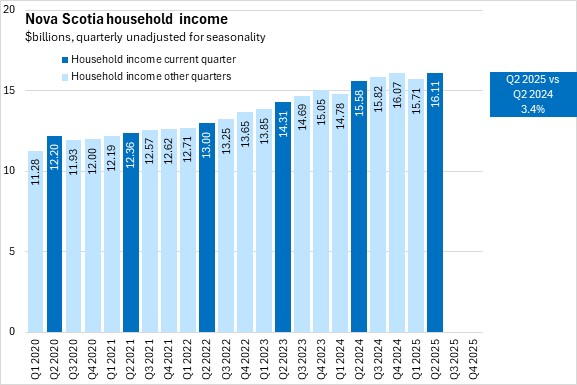
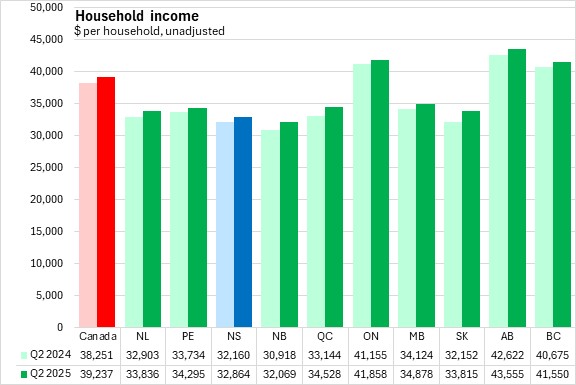
Nova Scotia's overall household income growth from Q2 2024 to Q2 2025 was 3.4%, which was just above the national growth of 3.3%. All provinces reported rising household income year-over-year, with the fastest increase in Saskatchewan and the slowest gain in Newfoundland and Labrador.
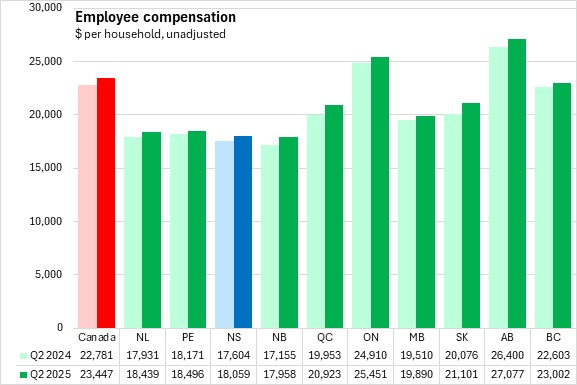
Nova Scotia's rising household income reflected employee compensation growth of 3.8%. Nationally, employee compensation was up 3.7% year-over-year with gains in all provinces. New Brunswick had the fastest year-over-year rise in employee compensation (slowest: Manitoba).
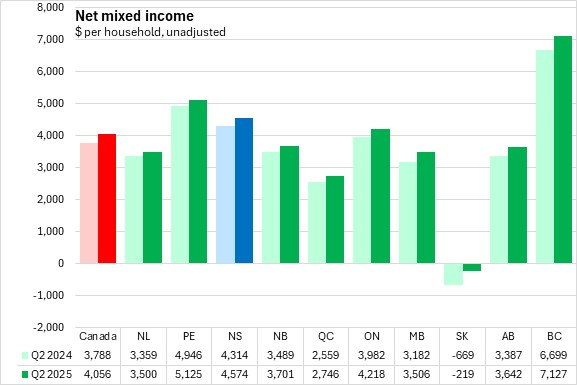
Nova Scotia's net mixed income from unincorporated businesses grew 7.3% from Q2 2024 to Q2 2025, slower than the national average pace of 7.8%. Manitoba reported the fastest growth in net mixed income (slowest: Newfoundland and Labrador). Saskatchewan reported negative net mixed income in Q2, as it has in this quarter for the last four years.
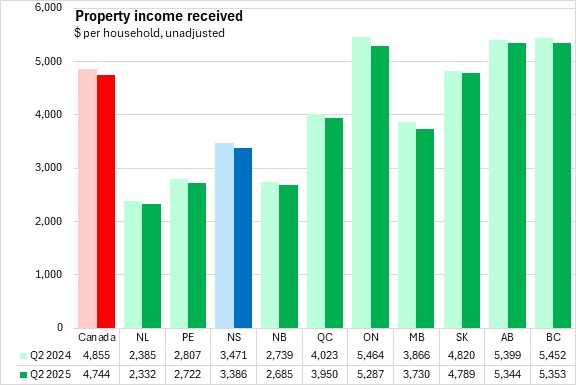
Nova Scotia's property income receipts declined 1.3% while national property income receipts were down 1.6%. All provinces reported except Alberta reported decreases from Q2 2024 to Q2 2025. Manitoba reported the steepest decline in property income receipts.
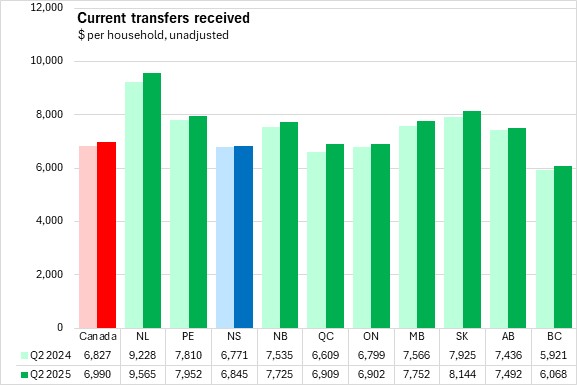
Current transfers received were up 2.3% in Nova Scotia from Q2 2024 to Q2 2025, the slowest rise among provinces. Transfer growth was 3.1% nationally with increases in all provinces (fastest: Québec).
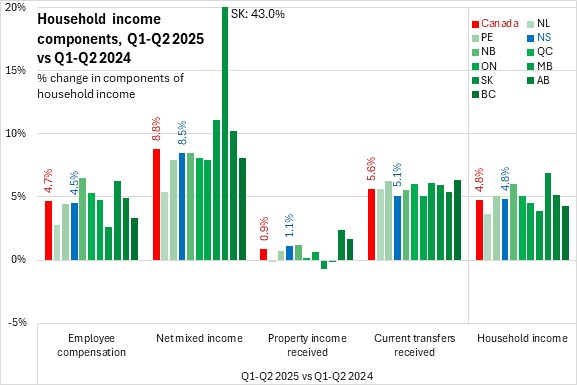
Through the first half of 2025, Nova Scotia's household income was up 4.8% compared with the first half of 2024. This was the same as the national pace of growth. Saskatchewan had the fastest year-to-date growth in household income (slowest: Newfoundland and Labrador).
Nova Scotia's employee compensation grew 4.5% year-to-date, just behind the national pace of 4.7%. Employee compensation was up in all provinces, led by New Brunswick (slowest: Manitoba).
Net mixed income was up 8.5% in Nova Scotia comparing Q1-Q2 2025 with the same period in 2024. National net mixed income was up 8.8% with gains in all provinces. Saskatchewan reported the fastest growth in net mixed income, but this is somewhat distorted by that province's persistent negative net mixed income reported in Q2 for each of the last four years. Newfoundland and Labrador reported the slowest growth in net mixed income.
Property income receipts were up 1.1% year-to-date in Nova Scotia, just outpacing the national gain of 0.9%. Property income receipts were up in all provinces except Newfoundland and Labrador, Manitoba and Saskatchewan (fastest gain: Alberta).
Current transfer receipts were up 5.1%, the second slowest growth among provinces (after Ontario). Nationally, current transfer income was up 5.6% year-to-date with the fastest gain in British Columbia.
In Q2 2025, Nova Scotia's household income was $32,864 per household or 83.8% of the national average ($39,237). The highest income per household was in Alberta and lowest in New Brunswick (followed by Nova Scotia).
Nova Scotia's employee compensation $18,059 per household, amounting to 77.0% of the national average per household ($23,447) in Q2 2025. Alberta reported the highest employee compensation per household and New Brunswick the lowest (followed by the other Atlantic Provinces).
Nova Scotia's net mixed income generated by unincorporated businesses amounted to $4,574 per household, which was 112.8% of the national average per household of $4,056. Across Canada, the highest values of net mixed income per household were in British Columbia. Saskatchewan reported negative net mixed income in Q2 2025. Negative net mixed income for Q2 has been reported in each of the last 4 years in Saskatchewan.
Nova Scotia property income received in Q2 2025 was $3,386 per household, which was 71.4% of the national average ($4,744 per household). The highest property income values were in British Columbia, Alberta, and Ontario. The lowest property income per household was in Newfoundland and Labrador.
Current transfers received in Nova Scotia were $6,845 per household in Q2 2025. Current transfers received in Nova Scotia were 97.9% of the national average per household ($6,990). Transfers per household were highest in Newfoundland and Labrador and lowest in British Columbia.
Household Consumer Expenditures
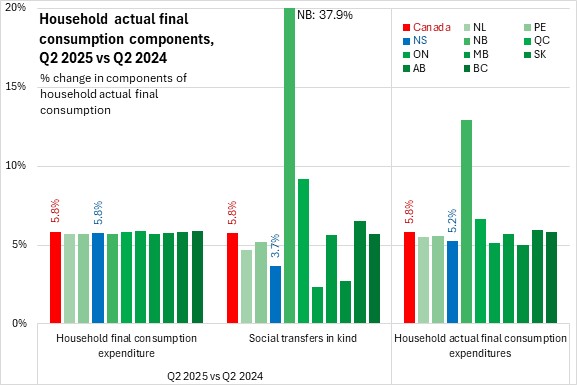
Comparing Q2 2025 with Q2 2024, Nova Scotia's household consumer expenditures increased by 5.8%, the same growth rate as the national pace. Year-over-year growth in consumer expenditures was very similar across all provinces with the fastest gain (British Columbia: 5.9%) barely outpacing the slowest increases (Newfoundland and Labrador, Prince Edward Island, New Brunswick and Manitoba at 5.7% each).
Social transfers in kind refer to services that are provided for the benefit of households but are paid for by governments and non-profits. These are primarily health and education expenditures, which add to private expenditures made on these services. Social transfers in kind increased by 3.7% in Nova Scotia from Q2 2024 to Q2 2025, ahead of growth in only Ontario and Saskatchewan. Social transfers in kind were up in every province with New Brunswick reporting markedly faster growth of social transfers in kind (primarily in the 'other' category outside of health and education). Nationally, social transfers in kind rose 5.8%.
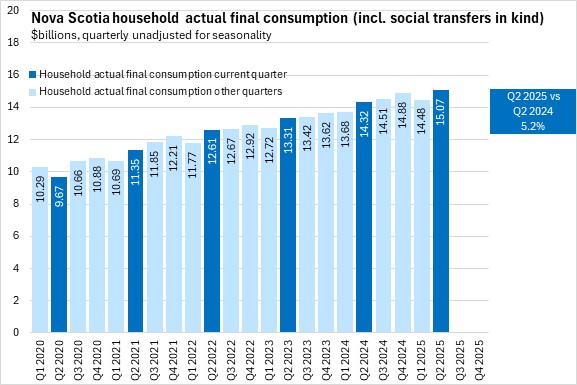
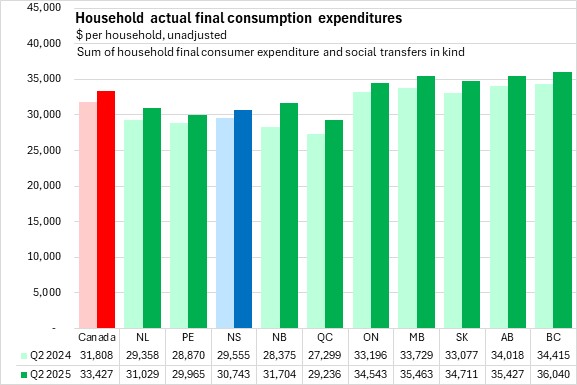
The sum of household final consumer expenditures and social transfers in kind is termed 'household actual final consumption expenditures', which reflects the benefits to households from both private expenditures as well as services provided by governments and non-profits. Combining these two components led to year-over-year household actual final consumption growth of 5.2% for Nova Scotia, which was ahead of only Ontario and Manitoba. All provinces reported increasing household actual final consumption expenditures from Q2 2024 to Q2 2025, with New Brunswick reporting markedly faster growth due to 'other' social transfers in kind.
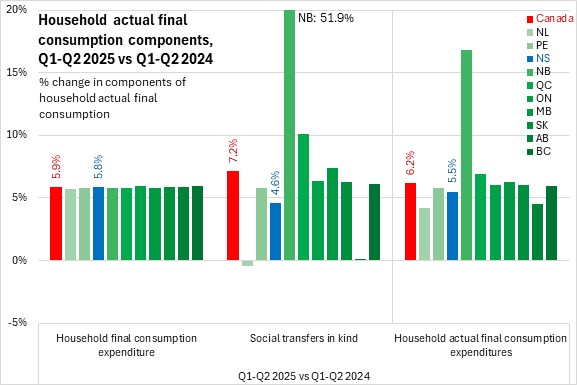
Through the first half of the year, Nova Scotia's household final consumption expenditures were up 5.8% - the same pace as the national average. All provinces reported similar growth in household final consumption expenditures.
Nova Scotia's social transfers in kind were up 4.6% year-to-date. National social transfers in kind rose 7.2% year-to-date with much faster growth in New Brunswick (owing to 'other' social transfers). Newfoundland and Labrador reported the only year-to-date decline in social transfers in kind.
Overall, household actual final consumption expenditures (combining households' market final consumption expenditures with social transfers in kind) were up 5.5% year-to-date. National household actual final consumption expenditures rose 6.2% with gains in all provinces. New Brunswick reported substantially faster growth in household actual final consumption expenditures because of other social transfers. Alberta and Newfoundland and Labrador reported the slowest growth in household actual final consumption expenditures.
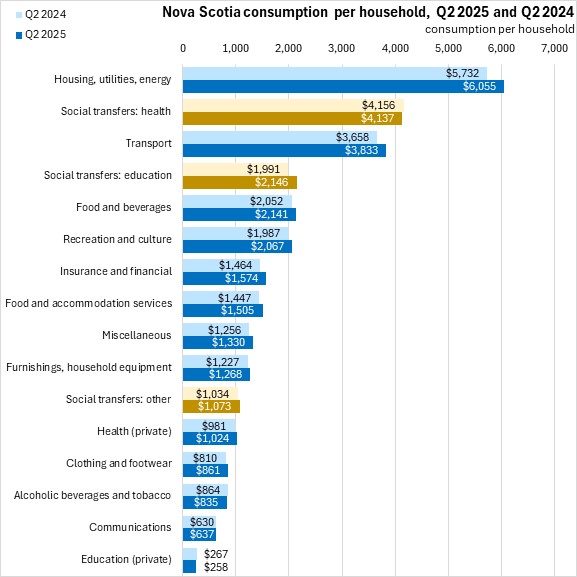
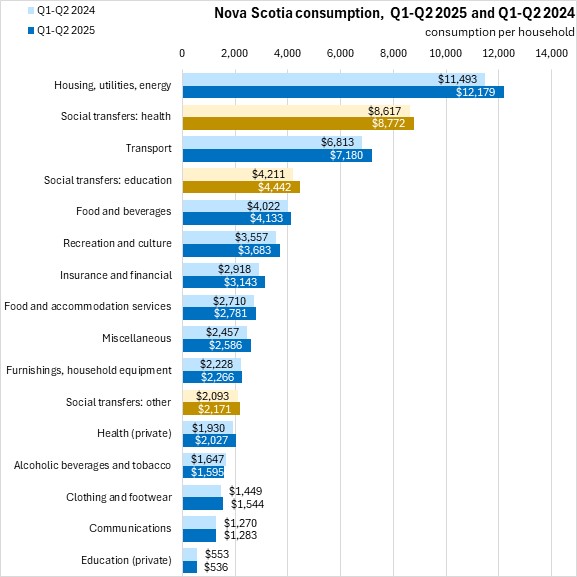
Among the categories of actual final consumption expenditures, housing/utilities/energy made up the largest category of household consumer expenditures, followed by social transfers in kind for health care, transportation, social transfers in kind for education, food/beverages and recreation/culture.
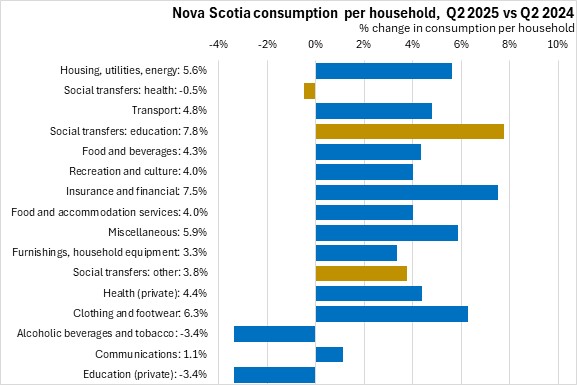
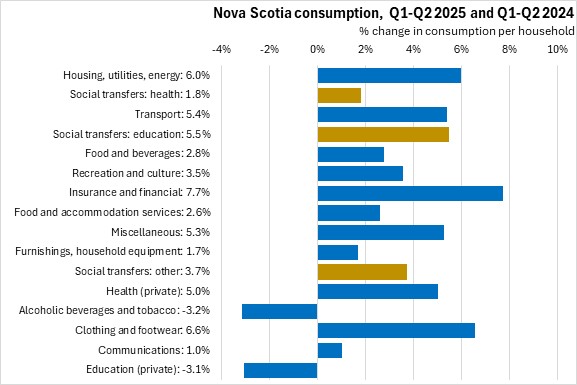
From Q2 2024 to Q2 2025, growth in per household spending was fastest in social transfers for education as well as insurance/financial services. Expenditures were down for alcoholic beverages/tobacco, private (market-provided) education services and social transfers in kind for health.
Through the first half of 2025, housing/energy/utilities, social transfers for health and transportation were the largest categories of household expenditure.
Year-to-date household expenditures for insurance and financial services grew faster than for other categories. Expenditures were down for private (market-provided) education services as well as alcoholic beverages/tobacco.
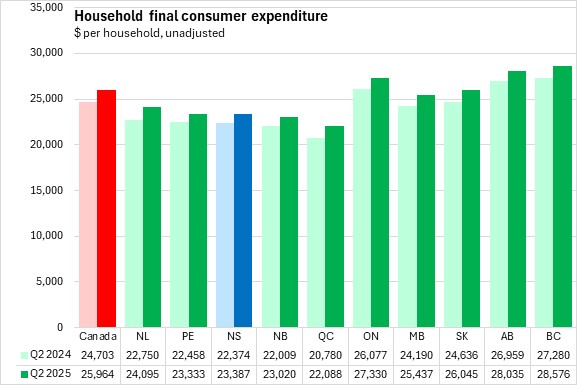
Nova Scotia's final consumer expenditures (paid for private by households) amounted $23,387 per household in Q2 2025; 90.1% of the national average per household. Across Canada, final consumer expenditures per household were $25,964 with the highest values in British Columbia and Alberta and the lowest value in Québec.
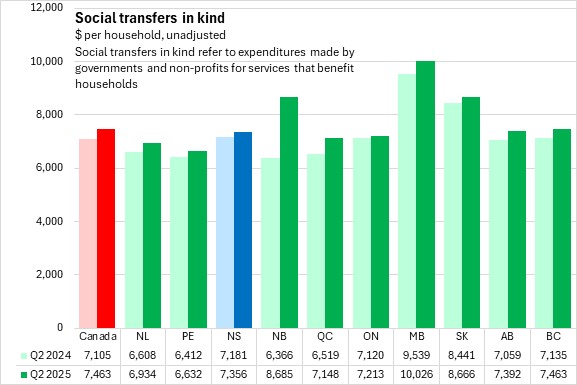
In Q2 2025, Nova Scotian households received $7,356 per household worth of social transfers in kind (98.6% of the national average per household). Across Canada, social transfers in kind were $7,463 per household with the highest value in Manitoba and the lowest value in Prince Edward Island.
Nova Scotia's household actual final consumption expenditures in Q2 2025 were $30,743 per household (92.0% of the national average per household). National household actual final consumption expenditures were $33,427 per household with the highest value in British Columbia. The lowest household actual final consumption expenditures were in Québec.
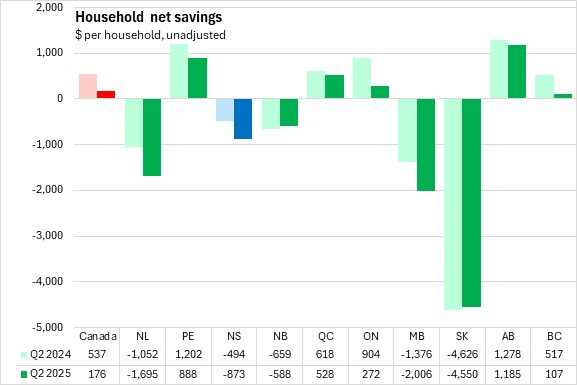
In Q2 2025, Nova Scotia's net savings per household were -$873, deteriorating from the net savings of -$494 per household in Q2 2024. National net savings fell to 176 per household with negative net savings in Newfoundland and Labrador, Nova Scotia, New Brunswick, Manitoba and Saskatchewan. Alberta and Prince Edward Island reported the largest positive net savings. Saskatchewan had the largest negative net savings.
Source: Statistics Canada. Table 36-10-0663-01 Distributions of household economic accounts, income, consumption and saving, Canada, provinces and territories, quarterly (x 1,000,000)
<--- Return to Archive