The Economics and Statistics Division maintains archives of previous publications for accountability purposes, but makes no updates to keep these documents current with the latest data revisions from Statistics Canada. As a result, information in older documents may not be accurate. Please exercise caution when referring to older documents. For the latest information and historical data, please contact the individual listed to the right.
<--- Return to Archive
For additional information relating to this article, please contact:
October 28, 2025BUSINESS OPENING AND CLOSING, JULY 2025 Monthly (July 2025 vs June 2025, seasonally adjusted)
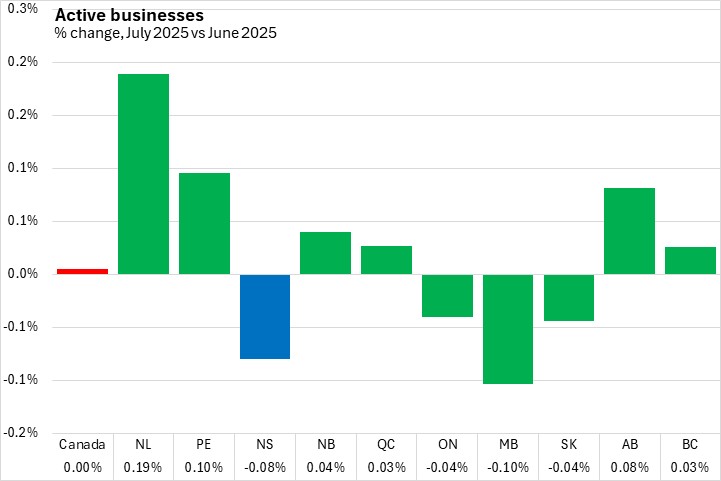
The number of active businesses in Nova Scotia edged down by 0.08% from June 2025 to July 2025, falling by 17 to 21,082 active businesses.
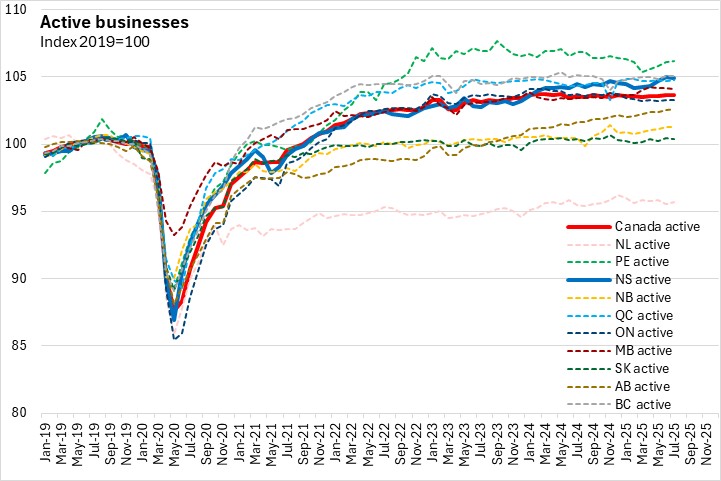
Nationally, active businesses were unchanged, despite gains in six provinces. Newfoundland and Labrador posted the fastest gain, while Manitoba reported the largest decline in active businesses.
A business will be classified as 'opening' if it had no employment in the previous month and then has employment in the next month. A business is 'closing' if it had employment in the previous month and no employment in the current month. For opening and closing, the reason could be a permanent change (i.e. business exit) or temporary for reasons such as seasonal operations, capital maintenance or restructuring. Continuing business are those that had employment in both the current and previous month. Active businesses are the sum of continuing and opening business in the current month.
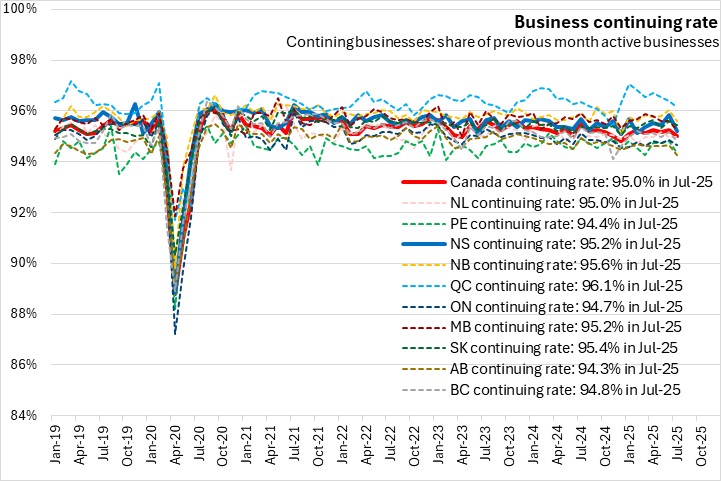
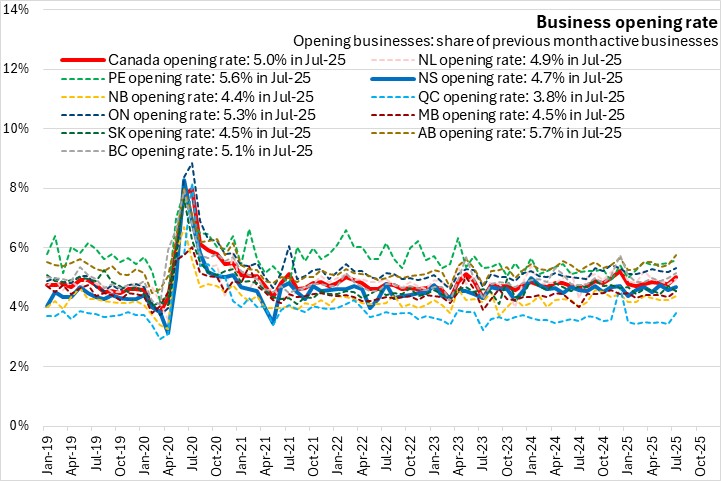
The rate at which business either opened, continued or closed can be examined to see how the number of active businesses has changed. The calculation for the opening, continuing and closure rates are based on the number of active businesses in the previous month.
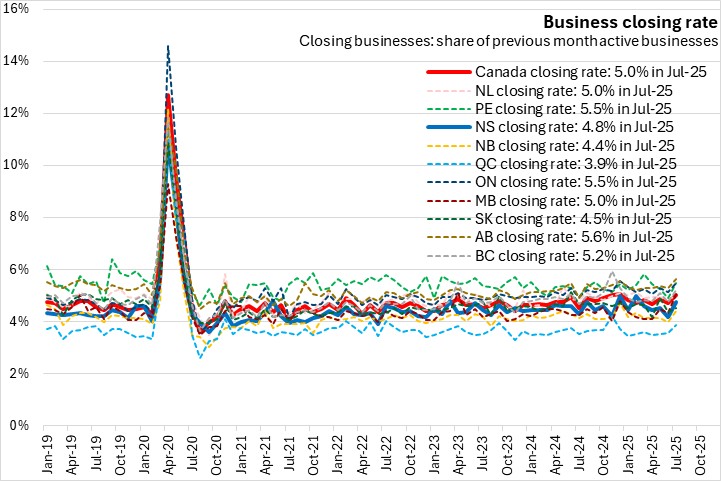
Most businesses continue operating each month. In July 2025, Nova Scotia's business continuing rate was 95.2%, slightly above the national average (95.0%). Québec reported the highest business continuing rate (96.1%) while Alberta reported the lowest continuing rate (94.3%).
Nova Scotia's business opening rate was 4.7% in July 2025, below the national average of 5.0%. Alberta had the highest business opening rate (5.7%) while Québec had the lowest (3.8%).
Nova Scotia's business closing rate was 4.8% in July 2025, below the national average of 5.0%. Alberta reported the highest business closing rate (5.6%), while Québec had the lowest business closing rate (3.9%).
Year-over-year (July 2025 vs July 2024)
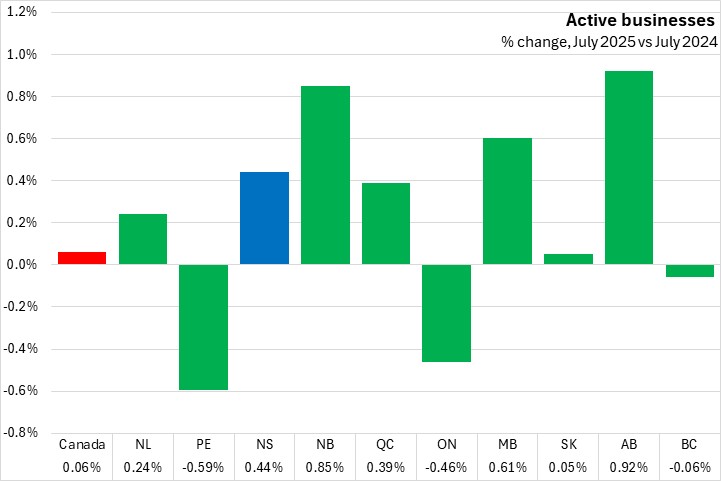
Compared with July 2024, the number of active businesses was up 0.44% for Nova Scotia. Nationally, active businesses were up 0.06% compared to July 2024. Alberta reported the largest increase in active businesses and Prince Edward Island reported the largest year-over-year percentage decline in active businesses.
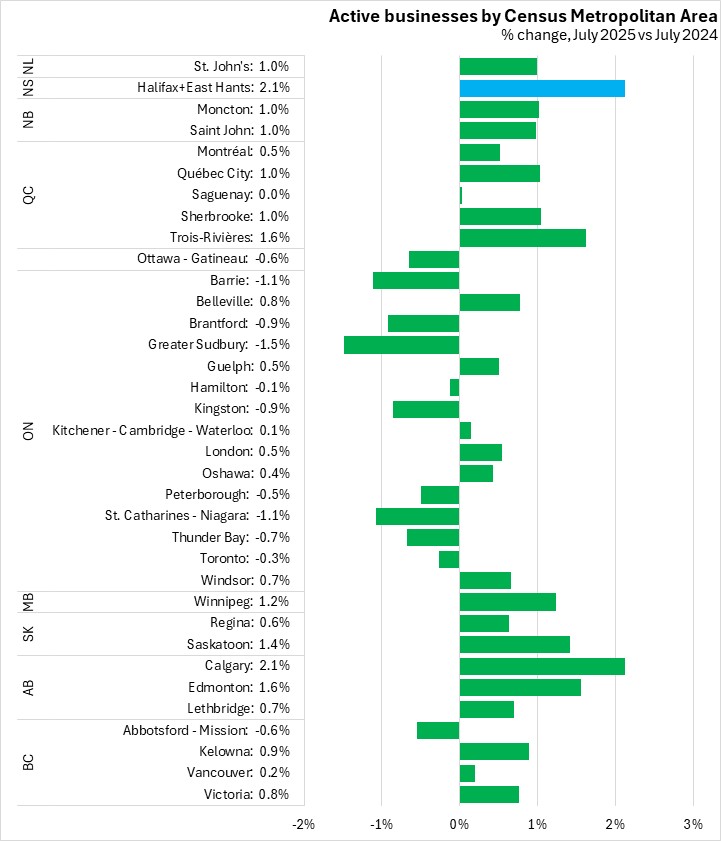
The number of active businesses in the Halifax and East Hants Census Metropolitan Area was up 2.1% from July 2024 to July 2025.
Out of 35 CMAs, 24 reported growth in active businesses over the past 12 months. Calgary and Halifax+East Hants reported the largest gains in the number of active businesses while Greater Sudbury, Barrie and St. Catharines-Niagara reported the largest declines.
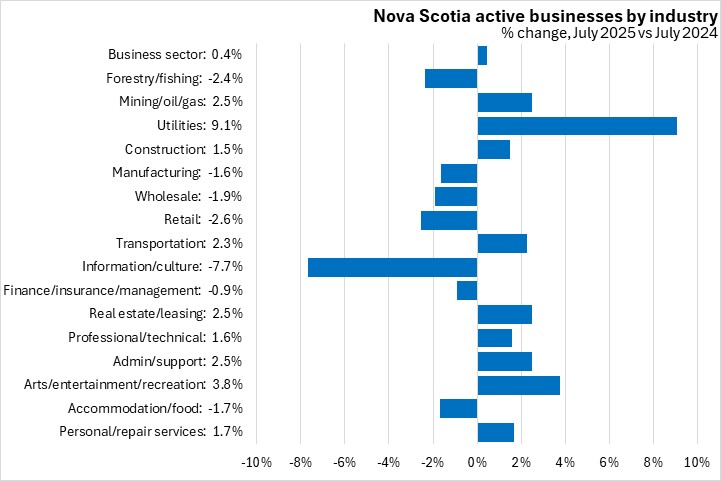
Compared with July 2024, nine sectors saw an increase in active businesses in Nova Scotia in July 2025 with the largest percentage increase in utilities. The steepest decline was in information/culture services.
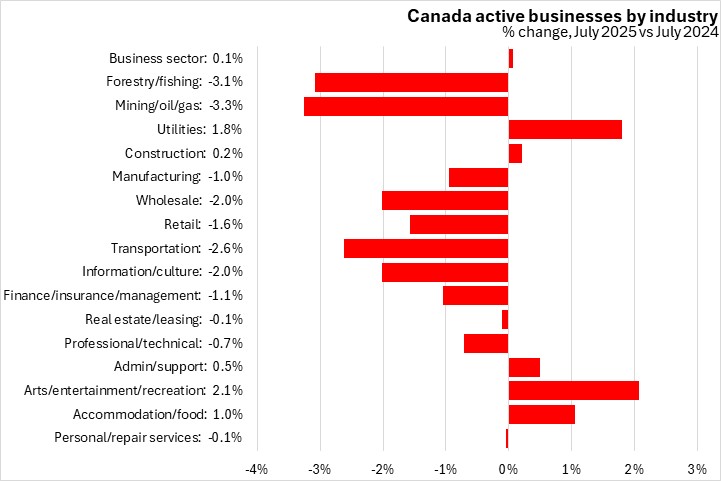
Nationally, the number of active businesses was down for eleven of sixteen business sectors. The largest gain was in arts/entertainment/recreation, while the largest declines were in mining/oil/gas and forestry/fishing.
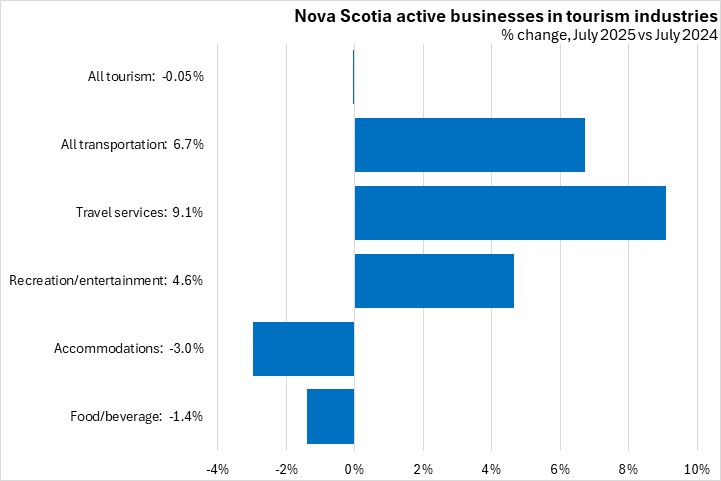
Statistics Canada has broken out specific data for tourism-related industries. Compared with July 2024, the number of active tourism-related businesses edged down 0.05% in Nova Scotia as of July 2025, with gains in all subsectors except accommodations and food/beverage.
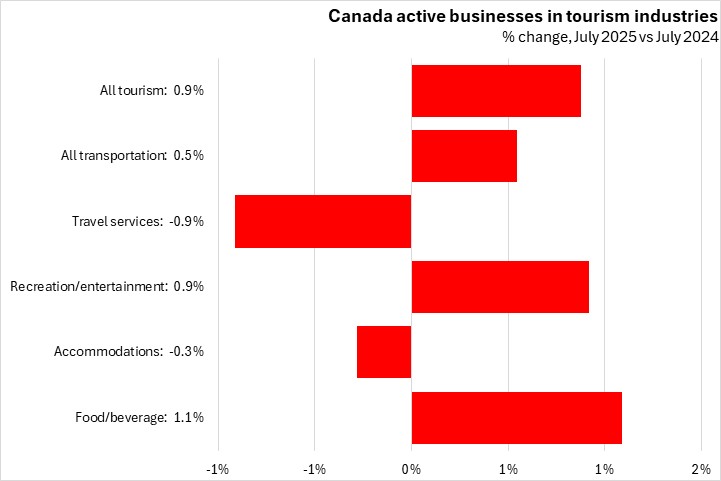
Nationally the number of tourism-related businesses edged up 0.9% from July 2024 to July 2025. All sectors reported growth in active businesses except accommodations and travel services.
Trends
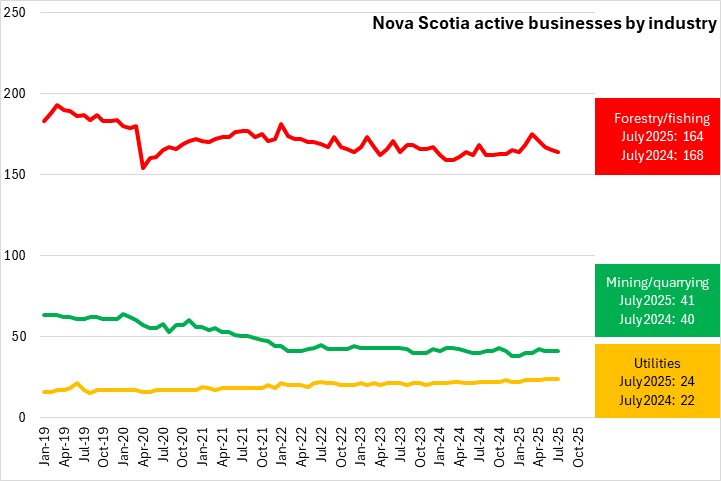
There has been a downward trend in forestry/fishing active businesses, but in the three months prior to April there was a substantial rise in active businesses. Active businesses in forestry/fishing declined starting in April and up to July from their recent peak in March 2025. Mining/quarrying has been steadily declining, but stabilized in the spring of 2025. Utilities have been slowly growing.
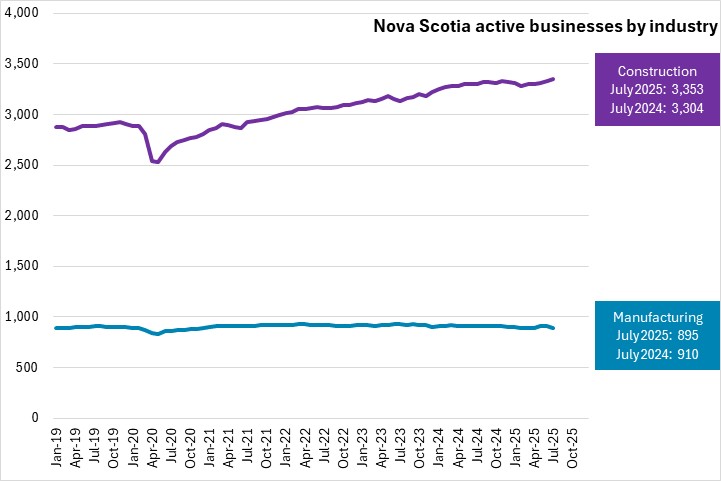
From 2020-2025, the number of active businesses in construction grew at a steady pace with a slight dip in the end of 2024. Growth resumed in recent months. Manufacturing businesses have remained stable for the past 3 years.
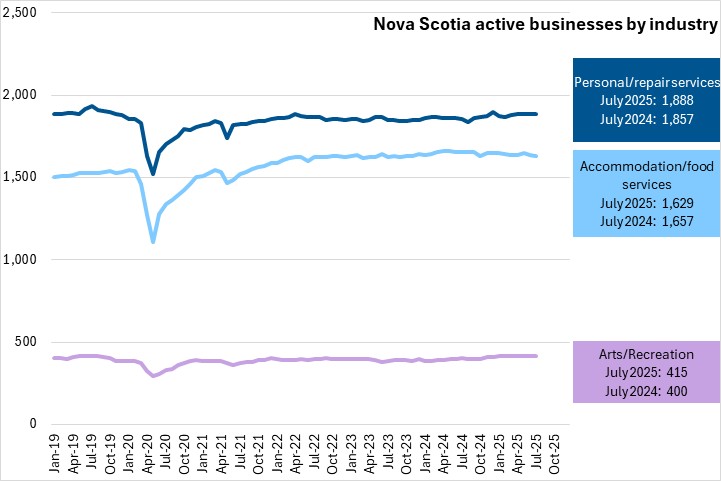
There have been small gains in active businesses for personal/repair businesses in recent months, and small gains in arts/recreation in recent months. Accommodation/food services had a small declines in June and July, following two months of small gains.
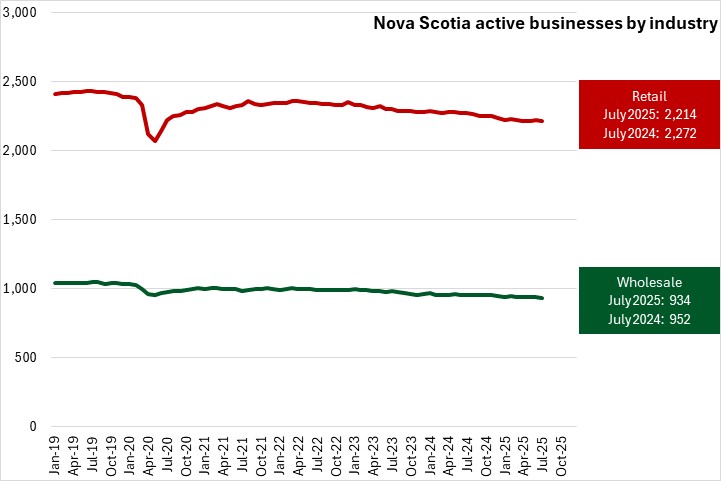
Retail and wholesale businesses have declined in the past two years.
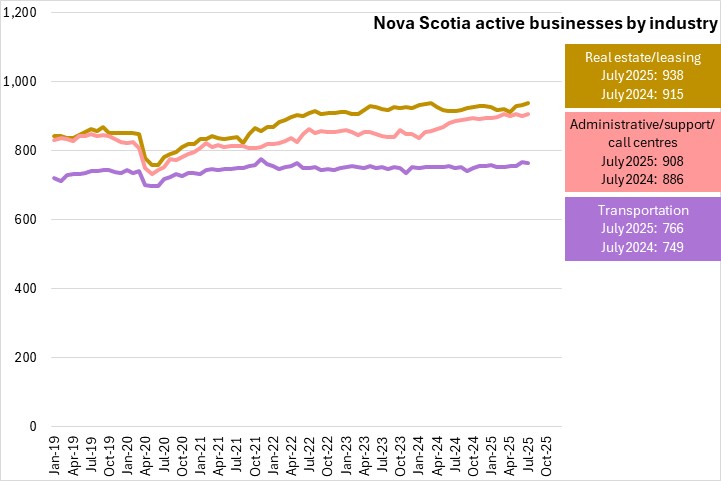
Active businesses in transportation have been fairly stable since 2022. The number of active businesses in real estate/leasing have seen recent growth following several months of declines, and administrative/support/call centers have seen modest growth since 2024, but also stabilized in most recent months.
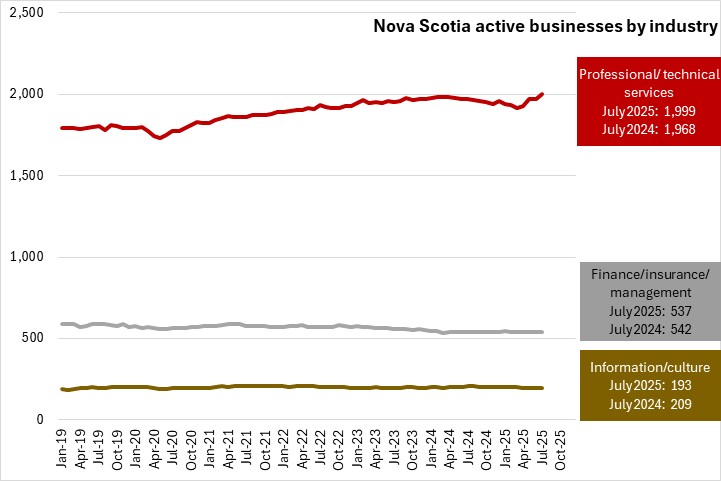
Professional/technical services active businesses have grown in recent months after steady gains in the last year. The decline in finance/insurance/management businesses has slowed, while the number of active businesses in information/culture has been stable.
The source data is seasonally adjusted. The data June not aggregate due to firms being classified into multiple industry or geography.
Source: Statistics Canada. Table 33-10-0270-01 Experimental estimates for business openings and closures for Canada, provinces and territories, census metropolitan areas; Methodology: Business Opening and Closing
<--- Return to Archive