The Economics and Statistics Division maintains archives of previous publications for accountability purposes, but makes no updates to keep these documents current with the latest data revisions from Statistics Canada. As a result, information in older documents may not be accurate. Please exercise caution when referring to older documents. For the latest information and historical data, please contact the individual listed to the right.
<--- Return to Archive
For additional information relating to this article, please contact:
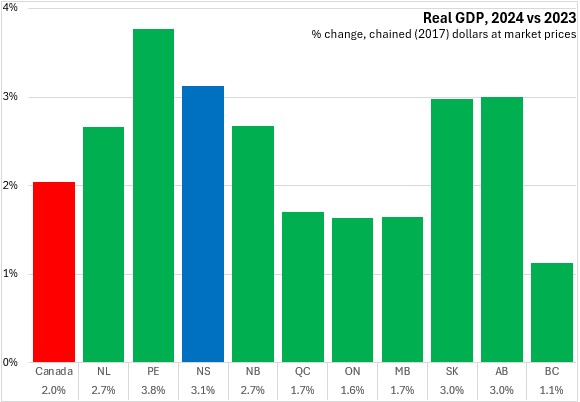
November 06, 2025PROVINCIAL GDP BY INCOME AND EXPENDITURE ACCOUNTS 2024 Nova Scotia's real GDP grew by 3.1% in 2024 following a revised 2.4% increase in 2023, the second fastest growth among provinces (behind Prince Edward Island). Canada's real GDP increased by 2.0% with gains reported in all provinces. British Columbia had the slowest annual increase in GDP.
Data for 2022 and 2023 were also revised. Nova Scotia's real GDP growth for 2022 was revised up from 3.5% to 5.1% while growth in 2023 was revised up from 2.0% to 2.4%.
Nominal GDP growth was revised from 7.4% in 2022 to 9.4% and from 8.0% in 2023 to 7.6%. As a result of these revisions, nominal GDP in 2023 increased from the previous estimate of $59.57 billion up to $60.49 billion.
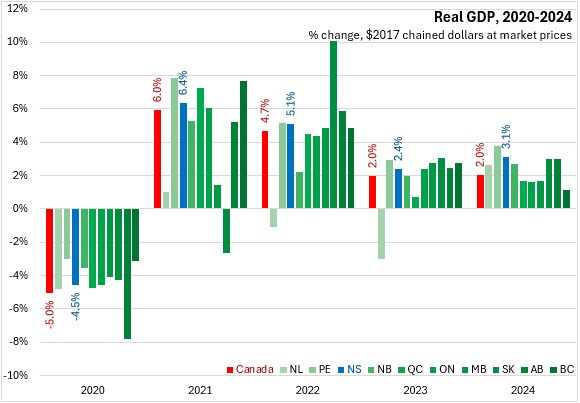
Nova Scotia's real GDP growth accelerated for the first time after the pandemic recovery. Nominal GDP growth also accelerated, largely due to gains in real GDP while the implicit price deflator grew again at an elevated pace.
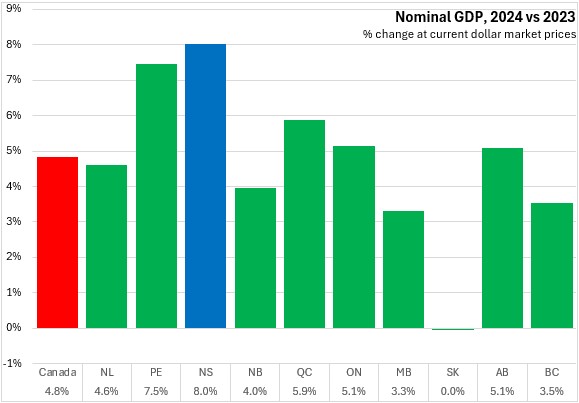
Nova Scotia's nominal GDP growth was 8.0% in 2024, including the increase in value associated with both price and volume changes. Nova Scotia reported the fastest nominal GDP growth among provinces, outpacing Prince Edward Island. National nominal GDP growth was 4.8% with gains in all provinces except Saskatchewan.
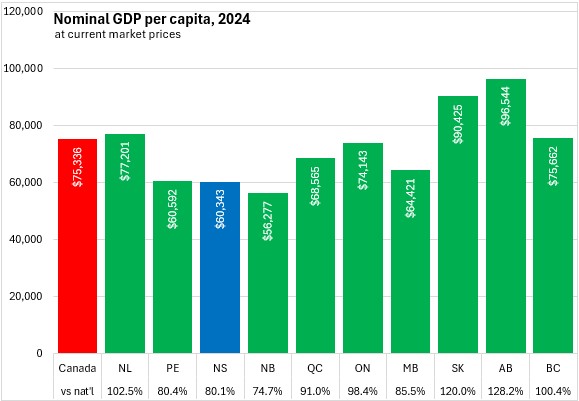
Nova Scotia's per capita nominal GDP amounted to $60,343 per person, or 80.1% of the national average. Nova Scotia's nominal GDP per capita was the second lowest among provinces (ahead of New Brunswick). Alberta and Saskatchewan reported the largest nominal values of GDP per capita.
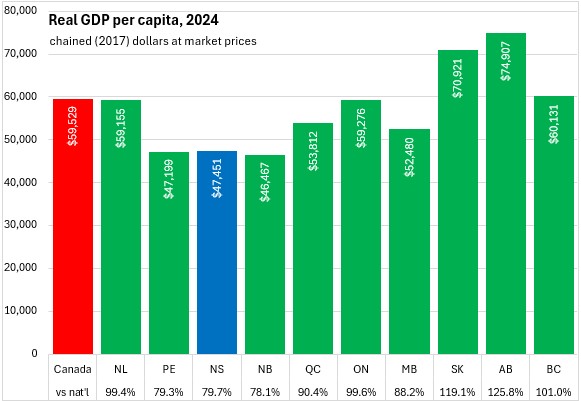
Nova Scotia's real GDP per capita was 79.7% of the national average - 3rd lowest (ahead of Prince Edward Island and New Brunswick). Alberta reported the highest real GDP per capita among provinces.
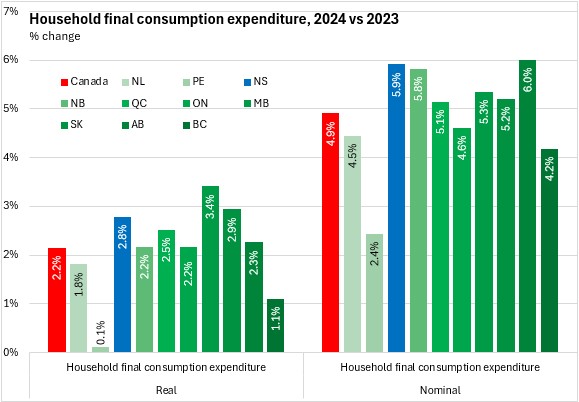
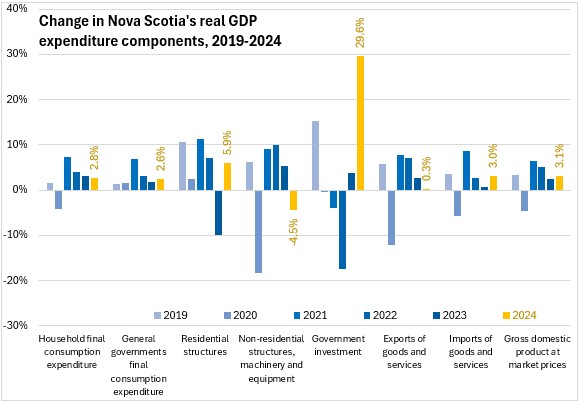
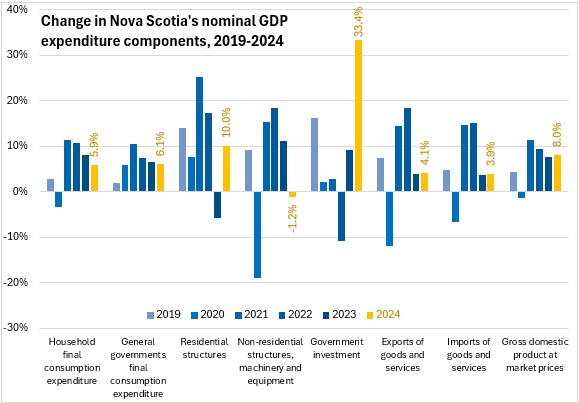
Nova Scotia's household consumer expenditures grew by 2.8% in real terms (third fastest among provinces) and 5.9% in nominal terms (second fastest among provinces).
National household spending increased by 2.2% in real terms and 4.9% in nominal terms. Household consumption spending grew in all provinces. Prince Edward Island reported the slowest growth in both real and nominal terms while Alberta had the fastest growth in nominal consumer spending and Manitoba had the fastest growth in real consumer spending.
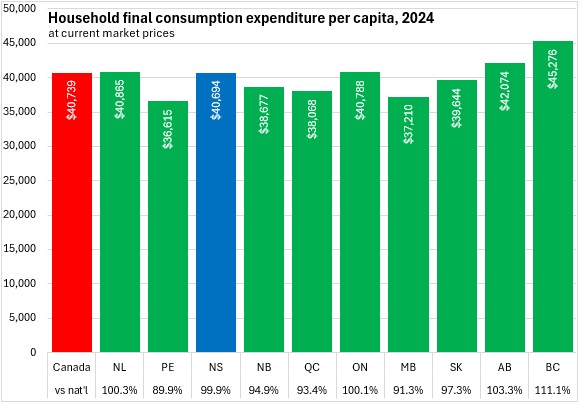
Despite nominal GDP per capita of 80.1% of the national average, Nova Scotia's nominal household consumer expenditures per capita were $40,694 in 2024 or 99.9% of the national average. Per capita household consumption was highest in British Columbia and lowest in Prince Edward Island.
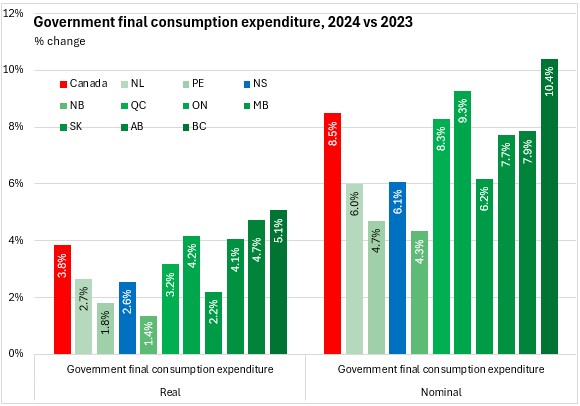
Final consumption expenditures from all levels of government were up 2.6% in real terms for Nova Scotia and 6.1% in nominal terms. National government expenditures grew 3.8% in real terms and 8.5% in nominal terms. British Columbia reported the fastest growth in government spending (both in real and nominal terms) while Québec reported the slowest growth (both real and nominal).
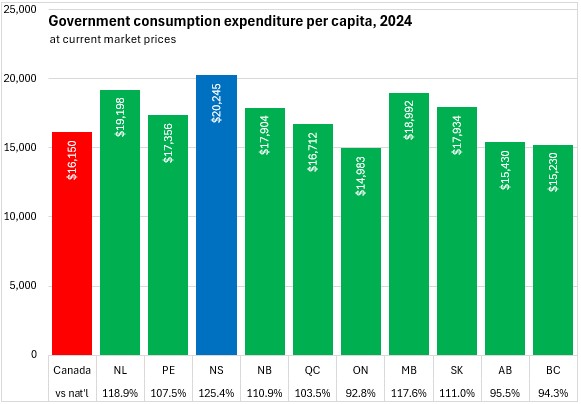
Nova Scotia reported the highest level of nominal government expenditures per capita among provinces at $20,245. As these expenditures include all levels of government, Nova Scotia's large military presence increases government expenditures per capita to 125.4% of the national average. Government consumption expenditures per capita were lowest in Alberta, British Columbia and Ontario.
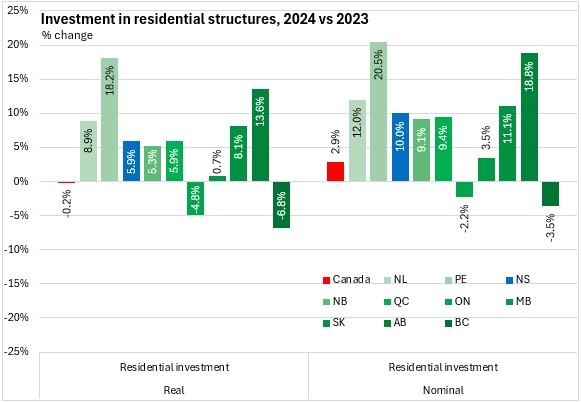
Nova Scotia's investment in residential structures (including both new and renovation spending) up 5.9% in real terms and 10.0% in nominal terms. National residential investment edged down 0.2% in real terms but was up 2.9% in nominal terms. In both real and nominal terms, residential investment was up in all provinces except Ontario and British Columbia.
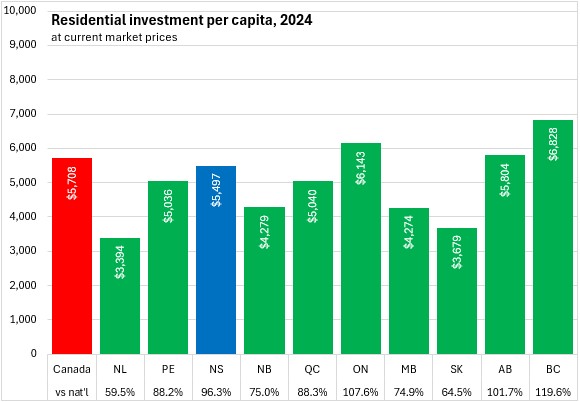
Nova Scotia's residential investments amounted to $5,497 per capita in 2024 or 96.3% of the national average. Residential investments per capita shown here are in nominal terms and elevated home prices in Ontario and British Columbia contribute to higher investments per capita in these provinces. Newfoundland and Labrador reported the lowest per capita investments in residential structures.
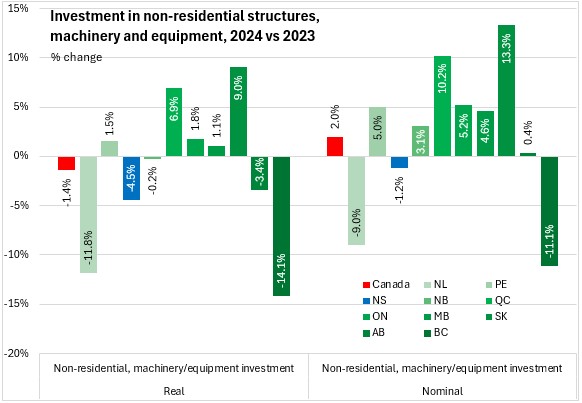
Nova Scotia had a 4.5% decline in business investment for non-residential structures as well as machinery and equipment (-1.2% in nominal terms). National non-residential and machinery investment was down 1.4% in real terms but up 2.0% in nominal terms. Five provinces reported higher real non-residential investment while seven provinces reported higher non-residential investment in nominal terms. Saskatchewan reported the fastest growth in non-residential and machinery investment while British Columbia reported the steepest decline (in both real and nominal terms).
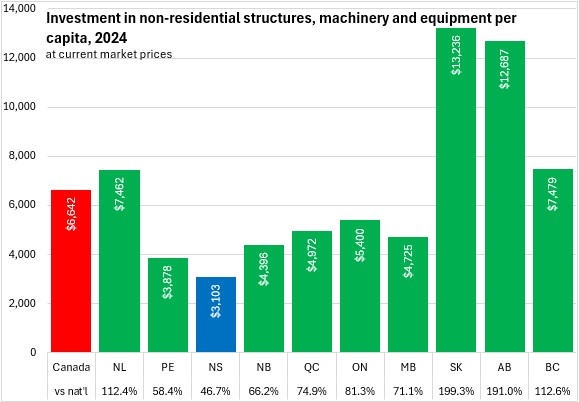
Nova Scotia's overall level of per capita business investment in non-residential structures, machinery and equipment was the lowest among provinces at $3,103 or 46.7% of the national per capita value. Canada's Alberta, Saskatchewan, British Columbia and Newfoundland and Labrador all reported substantially higher per capita business investments in non-residential structures, machinery and equipment.
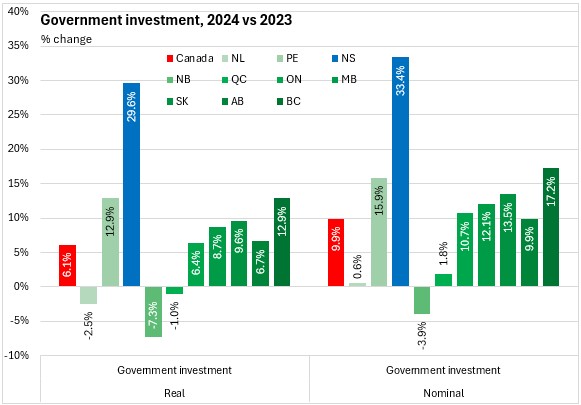
Government (as opposed to business) investment in Nova Scotia increased by 29.6% in real terms and 33.4% in nominal terms - by far the fastest growth among provinces. Nationally, government investments increased 6.1% in real terms and 9.9% in nominal terms. Government investment growth was down in New Brunswick in real and nominal terms. Québec and Newfoundland and Labrador also reported lower real government investment.
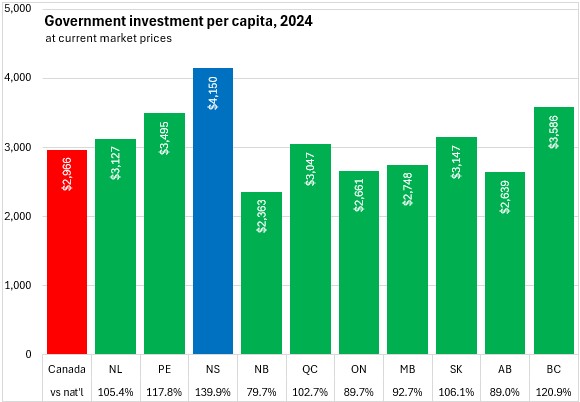
On a per capita basis, Nova Scotia reported the highest level of nominal government investments in 2024 at $4,150 or 139.9% of the national average. New Brunswick reported the lowest level of government investment per capita in 2024.
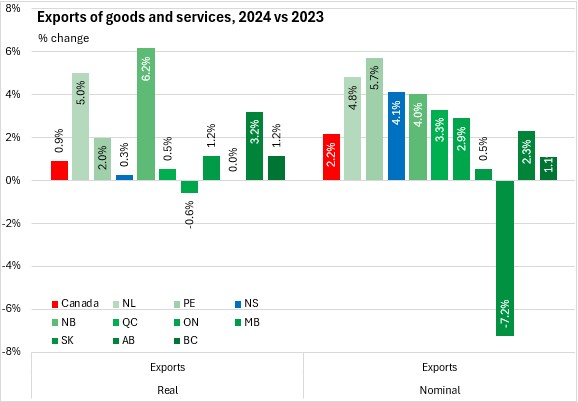
Nova Scotia's exports of goods and services - which includes both international and interprovincial destinations - edged up by 0.3% in real terms and 4.1% in nominal terms. National exports were up 0.9% in real terms with gains in all provinces except Ontario (decline) and Saskatchewan (little change). Nominal exports were up 2.2% nationally with gains in every province except Saskatchewan.
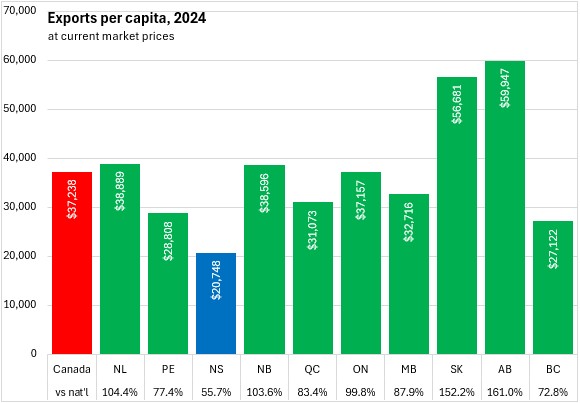
Nova Scotia's per capita exports were the lowest among provinces - by a substantial margin. The $20,748 in per capita interprovincial and international exports from Nova Scotia amounted to 55.7% of the national average. The next lowest province (British Columbia) had exports of $27,122 per capita or 72.8% of the national average. Alberta and Saskatchewan reported the highest exports per capita.
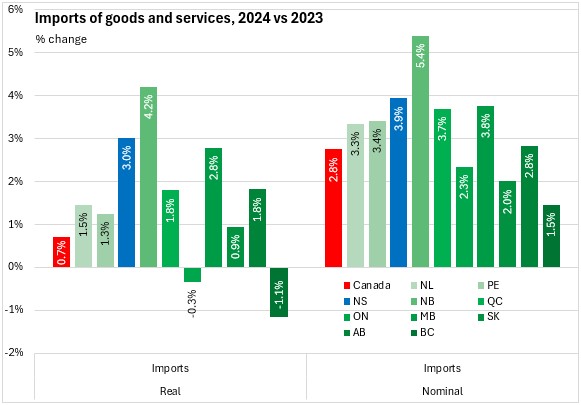
Nova Scotia's imports grew by 3.0% in real terms and 3.9% in nominal terms. Canada's real imports rose 0.7% in 2024 (+2.8% in nominal terms). Imports grew in real terms for all provinces except Ontario and British Columbia. New Brunswick reported the largest growth in imports in both real and nominal terms. British Columbia reported the steepest decline in imports in real terms and the slowest import growth in nominal terms.
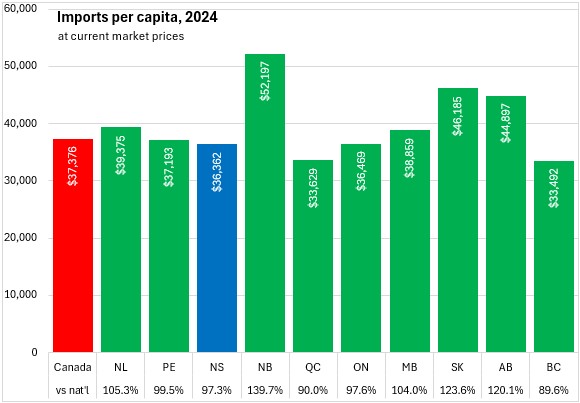
Nova Scotia's per capita imports amounted to $36,362 or 97.3% of the national average. British Columbia and Québec reported the smallest imports per capita. New Brunswick reported the highest imports per capita, including a substantial amount of imported crude oil for the province's large refinery.
Nova Scotia's overall economic growth in 2024 was supported by government capital investment, residential construction and consumption expenditures by both governments and households. Net exports were a drag on Nova Scotia's real GDP growth as imports rebounded while exports continued to contract.
In nominal terms, contributions to growth accelerated for government investment and rebounded for residential construction. Consumption expenditures by households and governments continued to provide positive contributions to growth, albeit at slowing rates. Price growth maintained exports' contribution to rising nominal GDP growth (despite little change in export volumes). Non-residential investment declines and rising imports slowed nominal GDP growth.
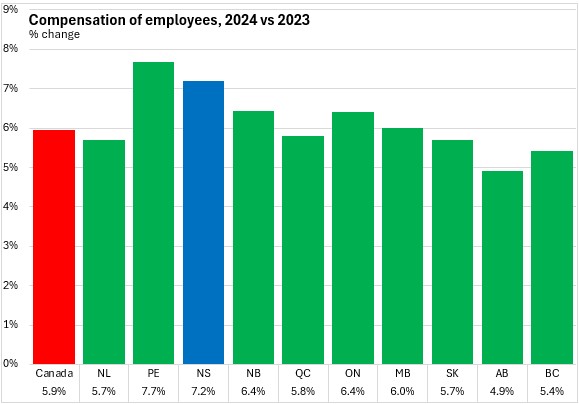
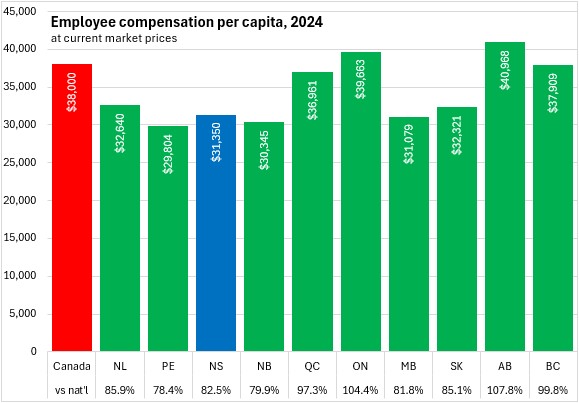
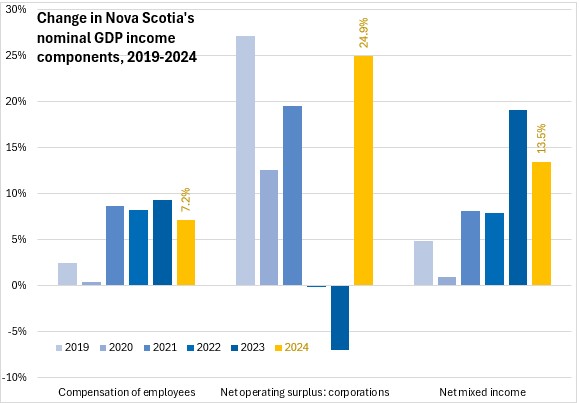
Compensation of employees for all industries in Nova Scotia was up 7.2% in 2024, the second fastest increase (behind Prince Edward Island). National employee compensation growth was 5.9% with gains in all provinces. Alberta had the slowest growth, though this was still just under 5%.
Nova Scotia's employee compensation per capita was $31,350 in 2024 or 82.5% of the national average. The Maritime provinces and Manitoba had the lowest compensation per capita. Employee compensation per capita was $38,000 nationally with the highest values in Alberta and Ontario.
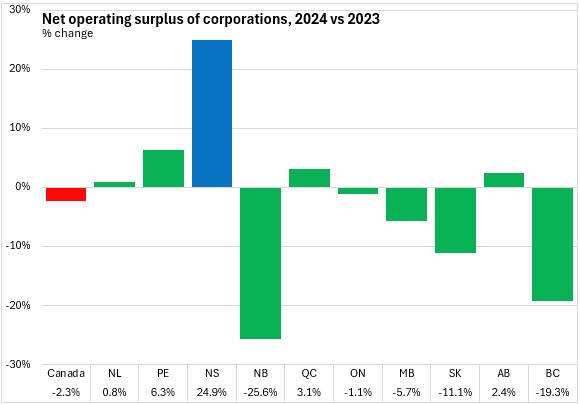
Growth in net operating surplus of corporations is typically volatile from one year to the next. Nova Scotia's net operating surplus of corporations was up 24.9% from 2023 to 2024, the fastest rise among provinces. Nationally, net operating surplus of corporations fell 2.3% with declines in five provinces. New Brunswick reported the steepest decline in corporate net operating surplus.
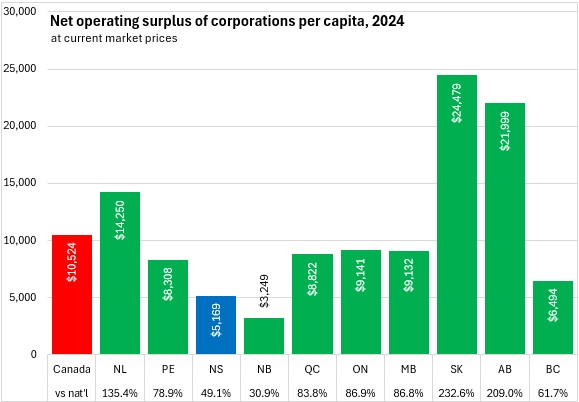
Nova Scotia reported the second lowest corporate net operating surplus per capita at $5,169 in 2024 - just 49.1% of the national per capita average. New Brunswick had by far the lowest per capita corporate net operating surplus in 2023, while Newfoundland and Labrador, Alberta and Saskatchewan reported substantially higher corporate net operating surplus per capita.
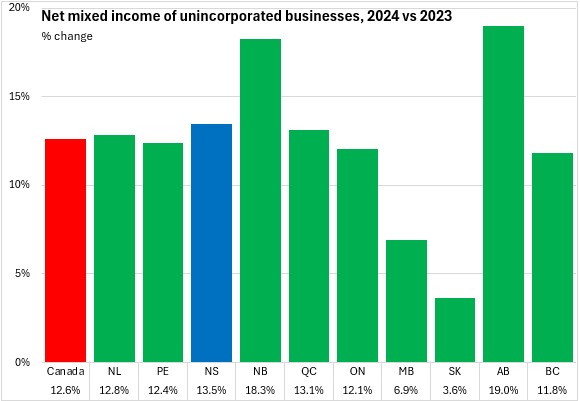
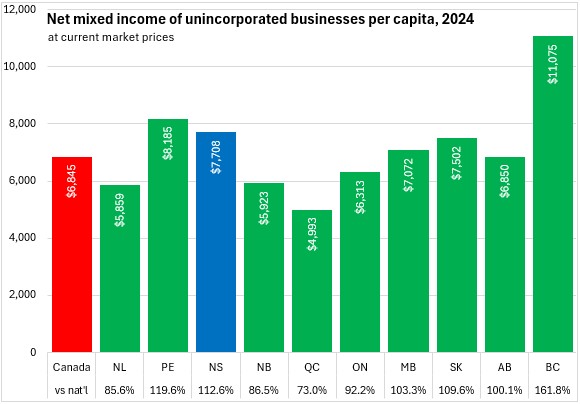
Nova Scotia reported a 13.5% increase in net mixed income of unincorporated businesses in 2024 - the third fastest increase among provinces behind Alberta and New Brunswick. National mixed income was up 12.6% with Saskatchewan reporting the slowest growth.
Unlike corporate net operating surplus, Nova Scotia's net mixed income per capita exceeds the national average at $7,708 (112.6% of national). British Columbia reported much higher per capita net mixed income of unincorporated businesses. Québec reported the lowest per capita net mixed income.
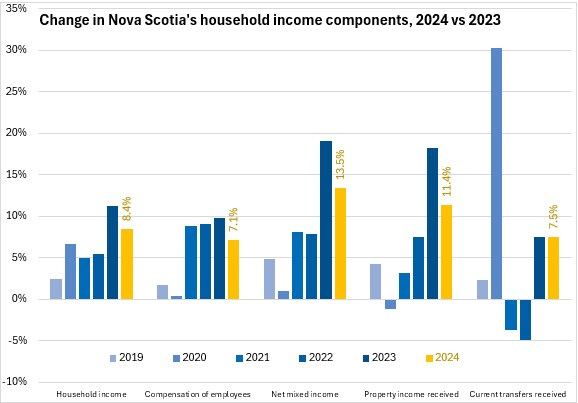
All major income components contributed to higher nominal GDP for Nova Scotia in 2024.
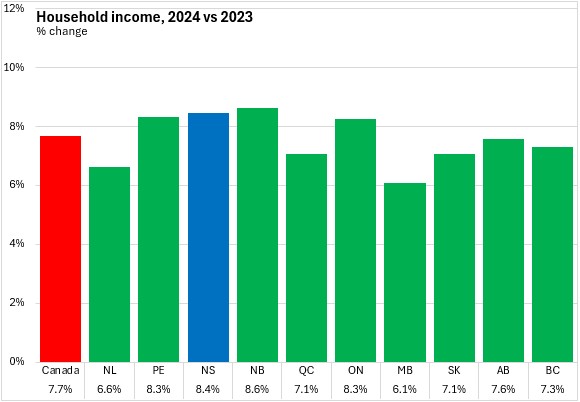
Household income grew by 8.4% in Nova Scotia in 2024, the second fastest rise among provinces behind New Brunswick (and just ahead of Prince Edward Island). Nationally, household income was up 7.7% with increases in all provinces. Manitoba reported the slowest growth in household income in 2024 (though this was 6.1%).
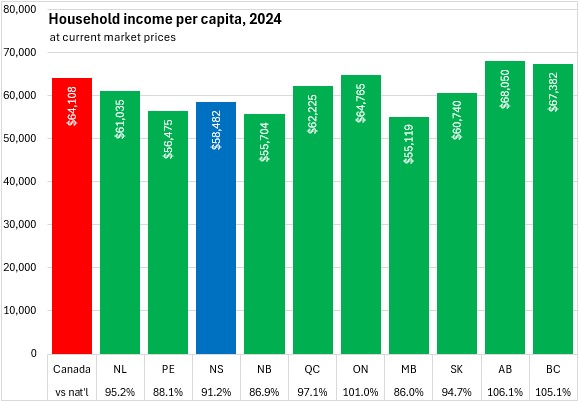
Nova Scotia's per capita household income was $58,482 in 2024 or 91.2% of the national average. Alberta reported the highest per capita household income. The gap between lowest (Manitoba, 86.0% of national) and highest (Alberta, 106.1% of national) per capita household income is substantially narrower than reported for per capita nominal GDP.
Household income includes employee compensation, net mixed income, property income received and current transfers received. It is reported on a national basis for all resident households rather than a domestic basis for all income paid in the province (regardless of household residency).
Property income received by households (such as interest, dividends, pensions) increased by 11.4% in Nova Scotia in 2024, which was the slowest gain among provinces. All provinces reported double digit gains in property income receipts for 2024, led by Saskatchewan.
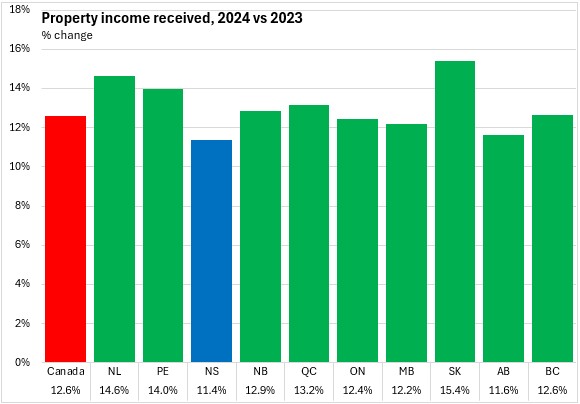
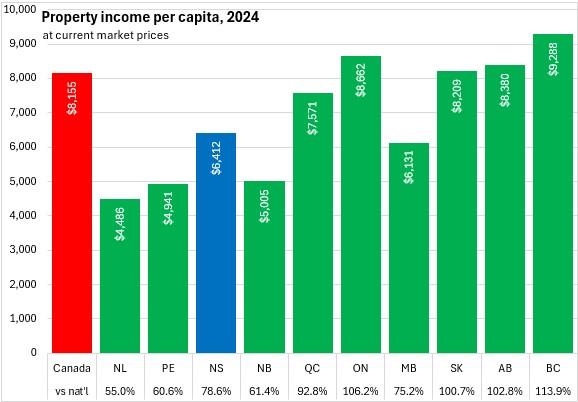
Nova Scotia's property income receipts were $6,412 per capita or 78.6% of the national average. Receipts were highest in British Columbia and Ontario and lowest in the three Atlantic provinces outside Nova Scotia.
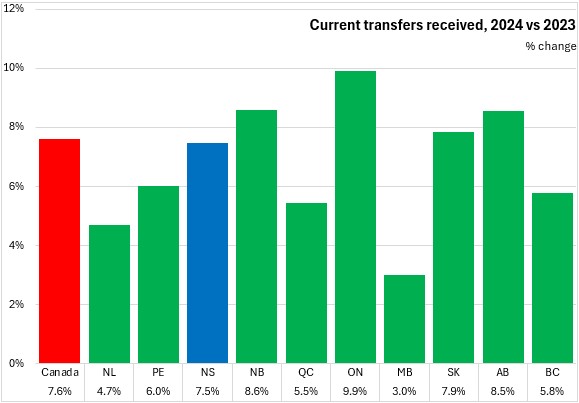
Current transfers received grew by 7.5% in Nova Scotia, just behind the national increase of 7.6% in 2024. Ontario reported the fastest growth in income from current transfer receipts while Manitoba reported the slowest growth.
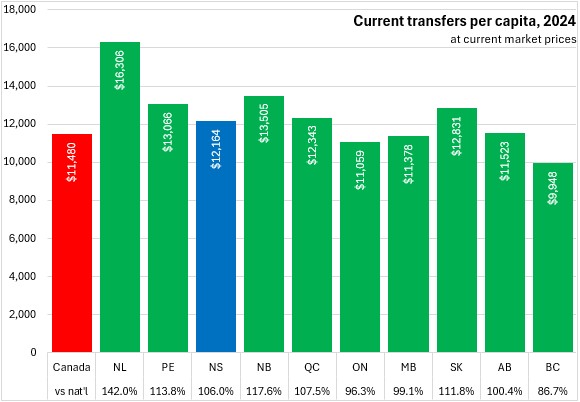
Current transfers per capita were highest in Newfoundland and Labrador and lowest in British Columbia. Nova Scotia's current transfers per capita were $12,164 or 106.0% of the national average.
Nova Scotia's growth in household income in 2024 came from all components, with slowing contributions from all income sources except current transfers (little changed).
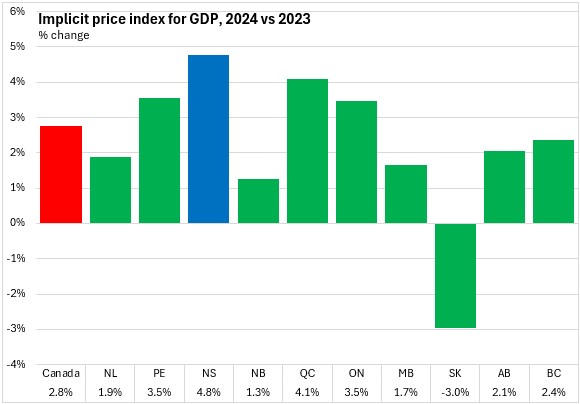
The GDP deflator is the implicit price index that establishes the difference between nominal GDP growth (which includes both price and volume gains) and real GDP growth (which includes only volume changes). This implicit price index is a broader measure of price growth than the consumer price index, which only considers a fixed basket of household consumption items.
Nova Scotia reported the fastest growth among provinces in the GDP deflator at 4.8% in 2024, decelerating slightly from a revised 5.1% increase in 2023. Nationally, the GDP deflator grew by 2.8% in 2024. Saskatchewan reported the only reduction in broad prices in 2024.
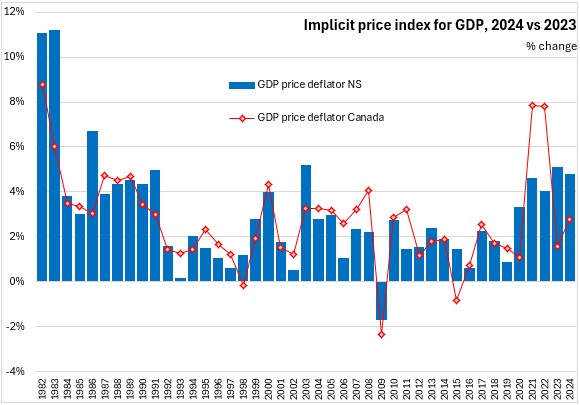
Nova Scotia's GDP deflator grown more rapidly in each of the last 5 years than in the previous 17 years.
Notes: Income and expenditure accounts provide the official estimates of Nova Scotia's gross domestic product (GDP) and select indicators. The estimates released today include revisions for the years 2022 and 2023 and the first estimate of expenditure and income for 2024. GDP as measured by the expenditure account refers to all final consumption and investment spending not bound for further production in the Nova Scotia economy in the year. Exports are added to this whether these are final or intermediate goods they are not bound for further production in Nova Scotia in the year. Imports are subtracted from this value (regardless of whether they are final or intermediate products) as any final expenditure that includes direct or embedded imports would not generate income for Nova Scotia factors of production in the year.
In the income accounts, GDP represents the generation of income from production activities. This income is spread across compensation of employees (in all industries), operating surplus of corporations (including both net operating surplus and consumption of fixed capital), mixed income of unincorporated businesses (including net mixed income as well as consumption of fixed capital by unincorporated businesses) along with adjustments to taxes on products and taxes on production. The analysis below focuses on employee compensation, net operating surplus of corporations and net mixed income of unincorporated businesses - all measured in nominal terms.
Household income includes components from the income account of GDP: employee compensation net mixed income (but measured on a 'national' basis for all resident households as opposed to 'domestic' basis for all activities inside Nova Scotia). The rest of household income is made up of earnings that are not derived from current production: property income received from ownership of real or financial assets as well as current transfers received from governments and corporations.
Source: Statistics Canada. Table 36-10-0221-01 Gross domestic product, income-based, provincial and territorial, annual (x 1,000,000); Table 36-10-0222-01 Gross domestic product, expenditure-based, provincial and territorial, annual (x 1,000,000); Table 36-10-0482-01 Property income of households, provincial and territorial (x 1,000,000); Table 36-10-0226-01 Household sector, selected indicators, provincial and territorial; Table 36-10-0223-01 Implicit price indexes, gross domestic product, provincial and territorial
<--- Return to Archive