The Economics and Statistics Division maintains archives of previous publications for accountability purposes, but makes no updates to keep these documents current with the latest data revisions from Statistics Canada. As a result, information in older documents may not be accurate. Please exercise caution when referring to older documents. For the latest information and historical data, please contact the individual listed to the right.
<--- Return to Archive
For additional information relating to this article, please contact:
November 17, 2025NEW MOTOR VEHICLE SALES, SEPTEMBER 2025 Year-to-date (January-September 2025 vs January-September 2024, unadjusted)
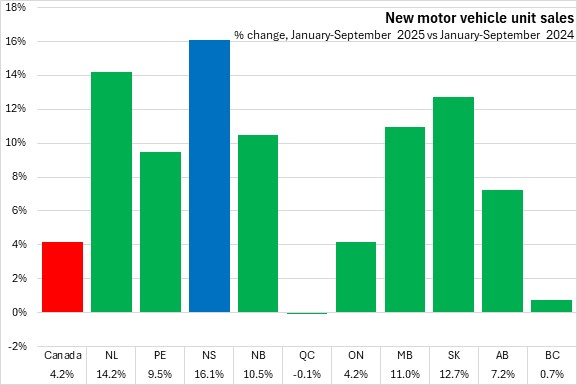
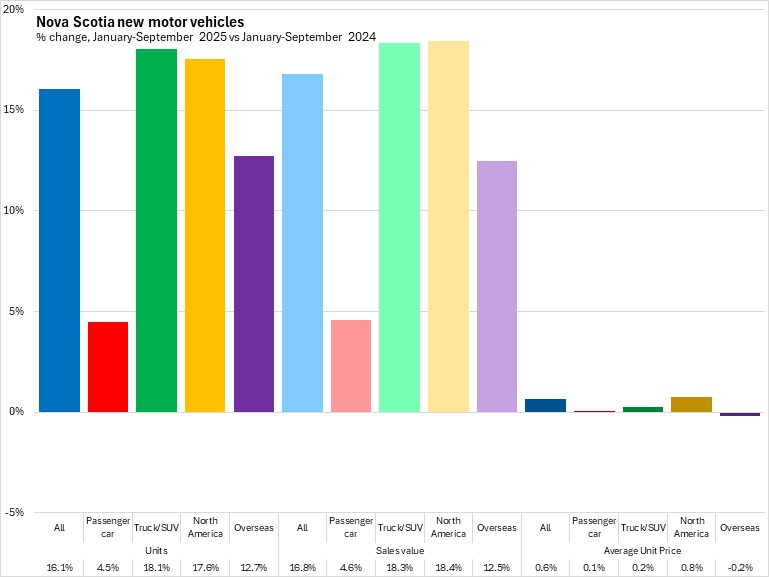
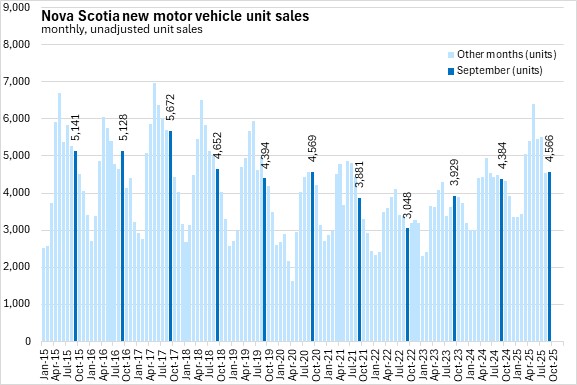
Compared with January-September 2024, Nova Scotia unit sales of new vehicles (+16.1%) reported a faster gain than in any other province, with national unit sales up 4.2%. Unit sales were up in all provinces except Québec.
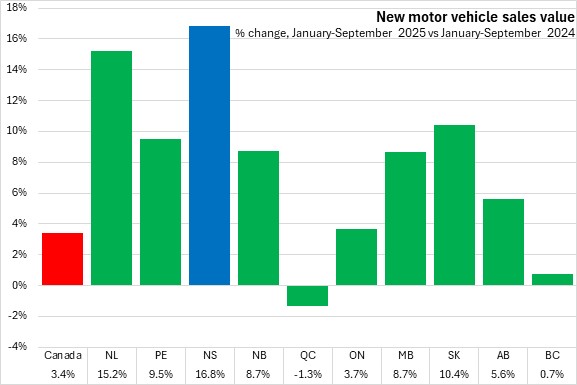
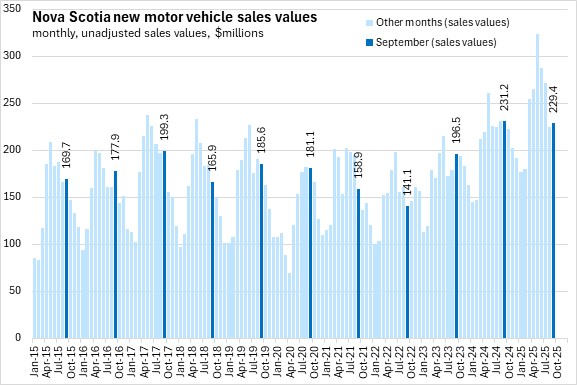
The sales values of new vehicles increased 16.8% in Nova Scotia from January-September 2024 to January-September 2025, the fastest gain among provinces. National sales values were up 3.4% with gains in all provinces except Québec.
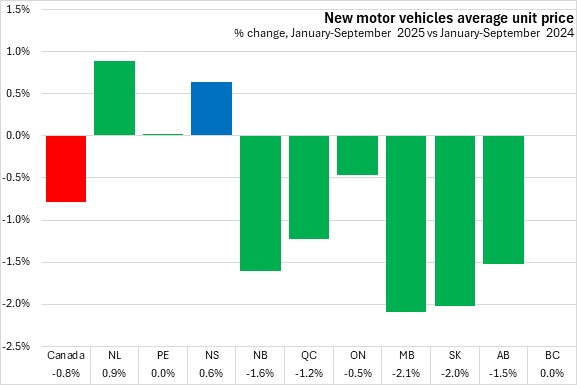
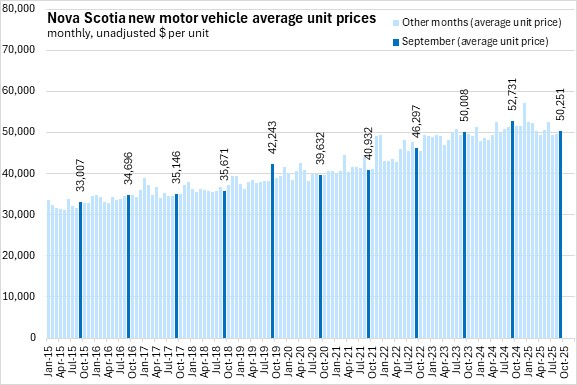
Compared to January-September 2024, average unit prices were up 0.6% in Nova Scotia in January-September 2025, the second fastest gain among provinces after Newfoundland and Labrador. National average unit prices were down 0.8% with declines in six provinces. Saskatchewan and Manitoba had the largest declines in average unit prices.
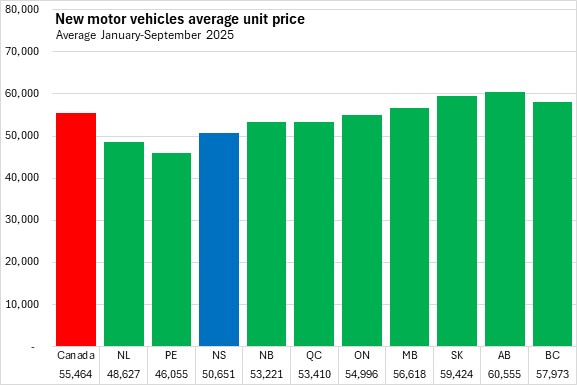
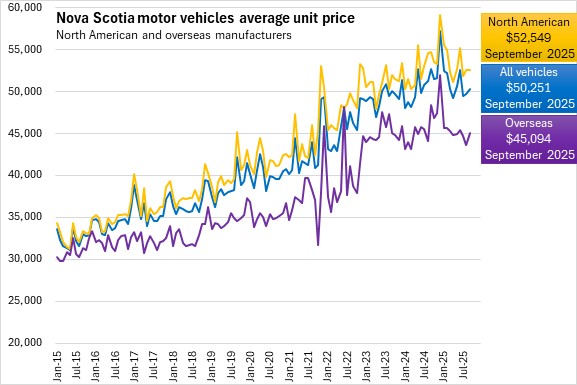
The average price of a new vehicle over January-September 2025 was $50,651 in Nova Scotia - third lowest among provinces ahead of Prince Edward Island and Newfoundland and Labrador. Nationally, the average price of a new vehicle was $55,464 in January-September with the highest value in Alberta.
Compared with January-September 2024, unit sales and sales values were up faster for Trucks/SUVs than passenger cars. North American manufacturers saw faster increases in unit sales and sales values compared to overseas manufactures. Average sales prices were up marginally for both trucks/SUVs and passenger cars. Overseas manufacturers' vehicles reported lower prices while North American vehicle manufacturers' product had higher prices.
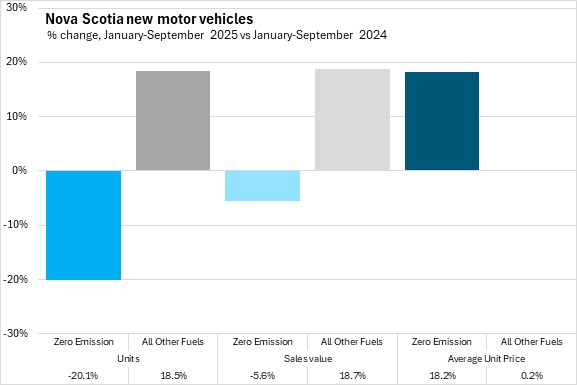
Starting with the January 2024 reference month, new data has been released on vehicle sales by fuel type. Zero emission vehicle unit sales were down 20.1% in January-September 2025 compared with January-September 2024, while sales values fell 5.6%. There was an 18.2% rise in average unit prices for zero emission vehicles. Other fuel type vehicles, which account for the majority of vehicles sold, saw unit sales increase 18.5% while sales values increased 18.7%, with average unit prices for other fuel type vehicles up 0.2%.

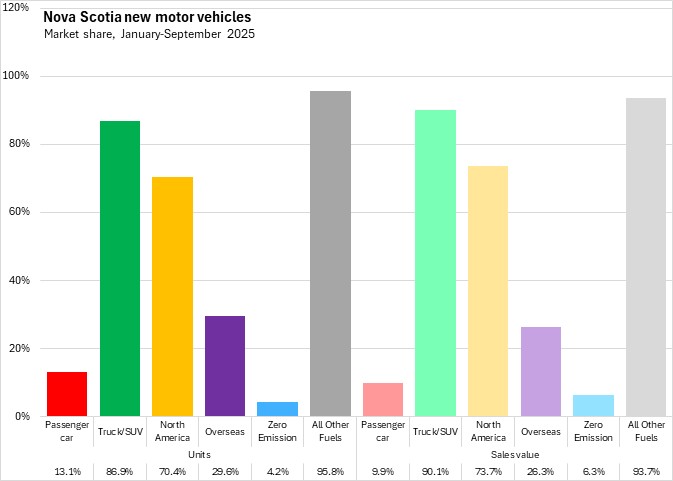
Over the period from January-September 2025, trucks/SUVs accounted for 86.9% of unit sales and 90.1% of sales values. North American manufacturers accounted for 70.4% of Nova Scotia's unit sales and 73.7% of sales values in January-September 2025. Zero emission vehicles made up 4.2% of unit sales, and 6.3% of sales values, while all other fuel types accounted for 95.8% of unit sales and 93.7% of sales values.
Year-over-year (September 2025 vs September 2024, unadjusted)
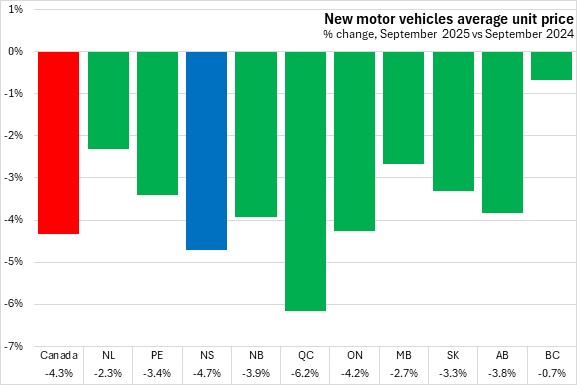
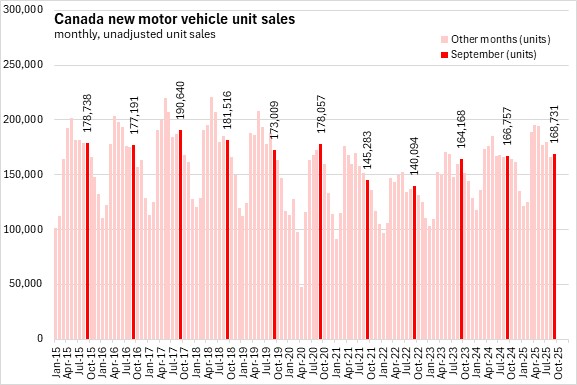
Compared with September 2024, Nova Scotia unit sales of new vehicles were up 4.2%. National unit sales were up 1.2% year-over-year with gains in seven provinces. Newfoundland and Labrador reported the fastest year-over-year gain while British Columbia reported the steepest decline.

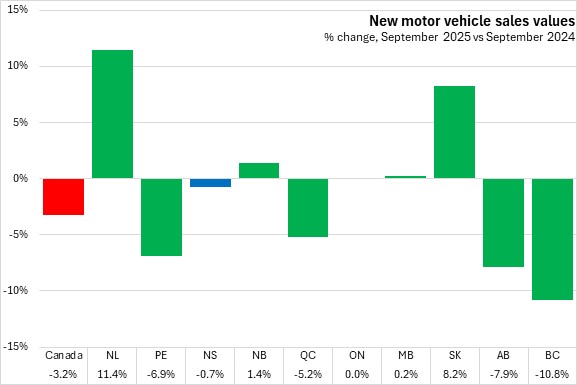
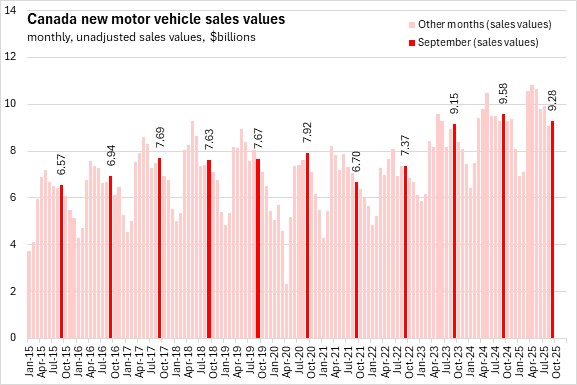
The sales values of new vehicles decreased 0.7% in Nova Scotia from September 2024 to September 2025. National sales values were down 3.2% with declines in five provinces. Newfoundland and Labrador had the fastest growth in year-over-year sales values while British Columbia had the steepest decline.
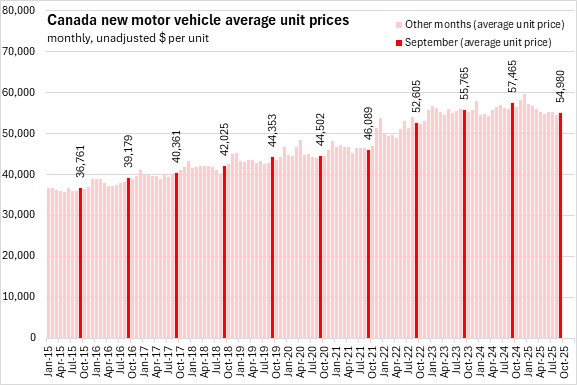
Compared to September 2024, average unit prices were down 4.7% in Nova Scotia in September 2025. Average unit prices were down 4.3% nationally with declines in all provinces. Québec had the steepest year-over-year decline in average motor vehicle prices while British Columbia reported the mildest decline.
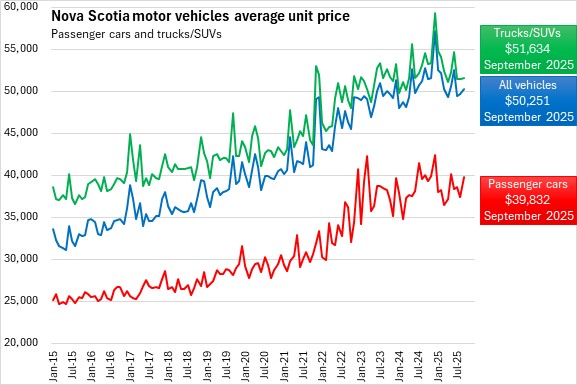
The average price of a new vehicle in September 2025 was $50,251 in Nova Scotia - third lowest among provinces ahead of Prince Edward Island and Newfoundland and Labrador. Nationally, the average price of a new vehicle was $54,980 in September with the highest value in Alberta.

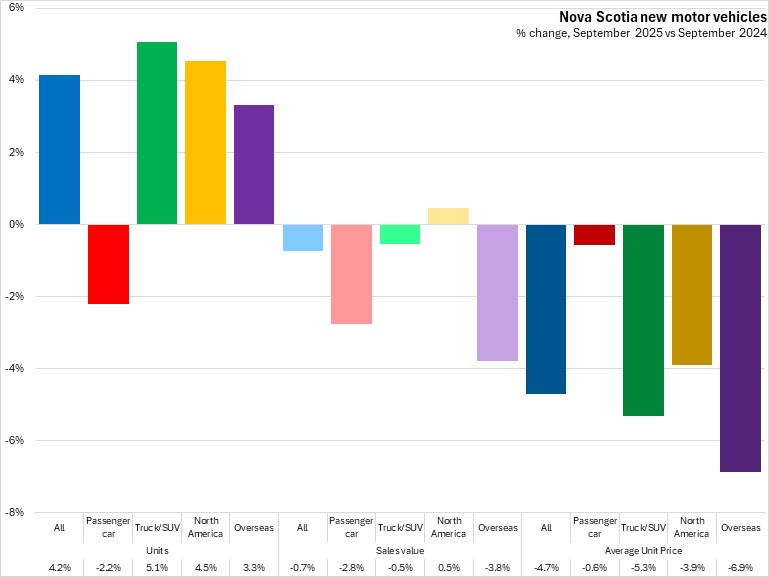
Compared with September 2024, unit sales and sales values were up for trucks/SUVs, but down for passenger cars. Both North American and overseas manufacturers unit sales were up year-over-year. Sales values were down for both passenger cars and trucks/SUVs and for overseas manufacturers while sales values were up for North American manufacturers. Average unit prices were down for all categories.
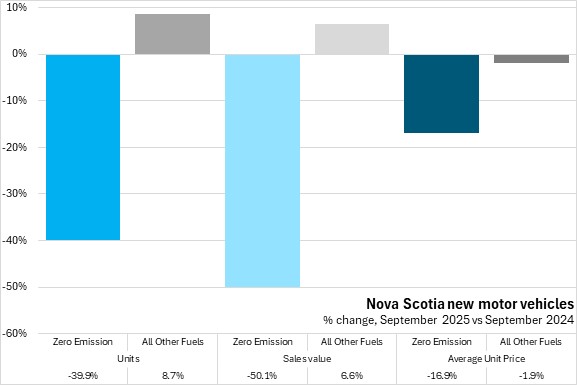
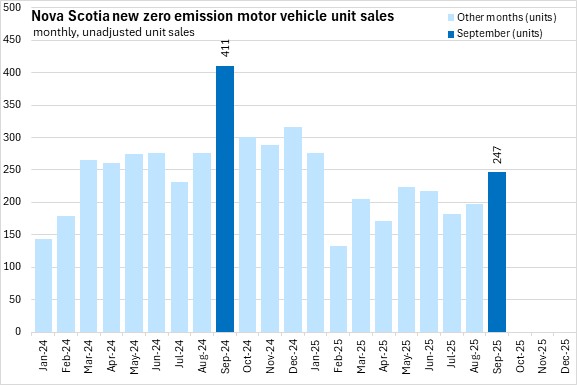
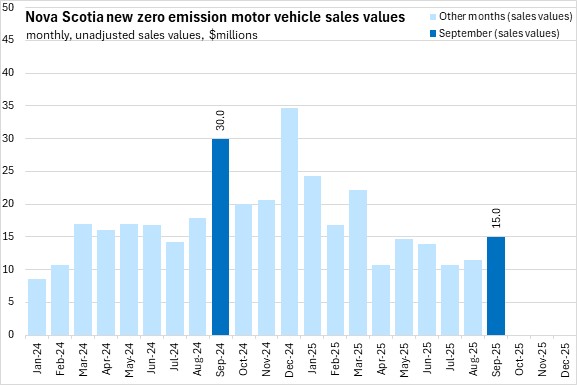
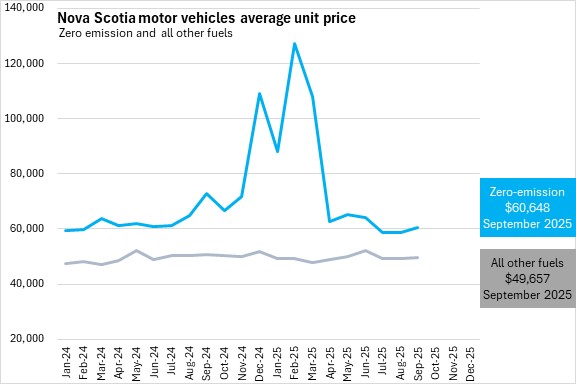
Zero emission vehicle unit sales were down 38.9% in September 2025 compared with September 2024, while sales values declined 50.1% and average unit prices decreased 16.9%. The low overall number of zero emission vehicles sold in Nova Scotia (247 in September 2025) can lead to volatility in unit sales, sales values, and prices. Other fuel type vehicles, which account for the majority of vehicles sold, saw unit sales increase 8.7% while sales values increased 6.6%, and the average unit price for other fuel type vehicles declined 1.9%.
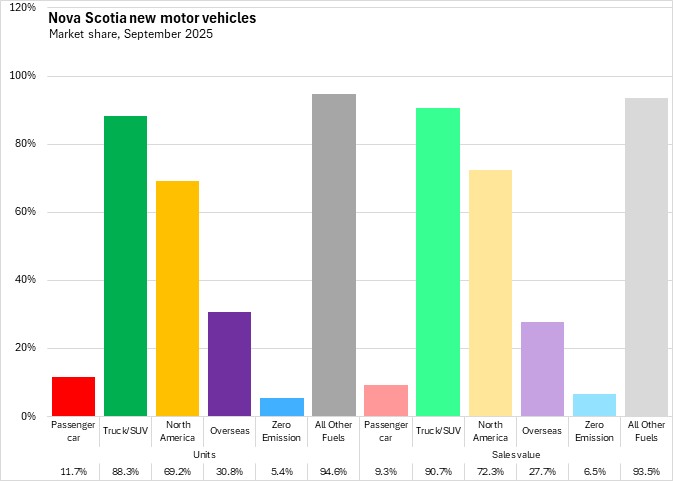
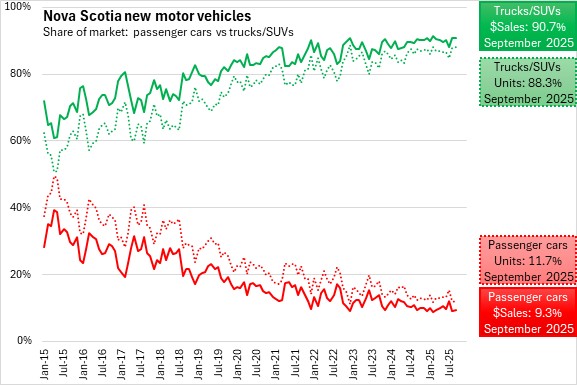
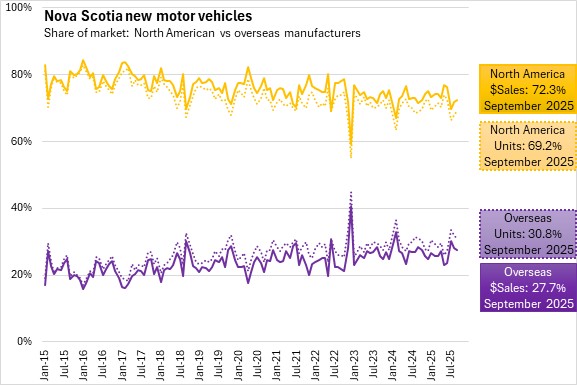
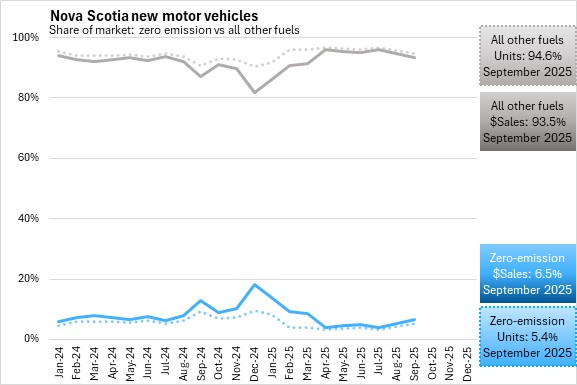
In September 2025, trucks/SUVs accounted for 88.3% of unit sales and 90.7% of sales values. North American manufacturers accounted for 69.2% of Nova Scotia's unit sales and 72.3% of sales values in September 2025. Zero emission vehicles made up 5.4% of unit sales, and 6.5% of sales values, while all other fuel types accounted for 94.6% of unit sales and 93.5% of sales values.
Trends
Nova Scotia's unit sales of 4,566 in September 2025 were stronger than those reported in the same month of any year since 2020.
Sales values of $229.4 million were below the same month in 2024, but above the same month in previous years.
Nova Scotia average unit prices have declined over the last year.
Zero-emission vehicles are currently a small share of the new motor vehicle market in Nova Scotia. Due to the small number of vehicles sold, there can be volatility in the year-over-year or year-to-date comparisons for unit sales, sales value and average prices. Nova Scotia zero-emission vehicle unit sales and sales values were down compared to September 2024.
Across Canada, national unit sales are above any comparable month since 2020, but below levels observed from 2015-2020.
National sales values for September 2025 were below the values from September 2024, but above other comparable months in recent history.
National average unit sales prices have returned to levels seen in early 2024. September 2025 average unit prices were down from September 2024 (and from September 2023).
There has been a steady trend of increasing market share for trucks/SUVs while the market share of passenger cars declines. This trend has become less volatile in recent months.
Over the last twenty years, there has been a slow decline in market share for North American manufacturers while overseas manufacturers' market share has risen. In recent years, market shares for North American and overseas manufactures have stabilized.
The market share for new zero-emission vehicles declined in early months of 2025, but has grown since July.
Prices for trucks/SUVs (the bulk of the market) as well as passenger cars have fallen from their recent peaks at the end of 2024.
Prices for vehicles from North American as well as overseas manufacturers are declining in recent months.
Average prices for zero-emission vehicles rose sharply in late 2024 and have subsequently fallen below previous levels. The low overall number of zero emission vehicles sold in Nova Scotia (247 in September 2025) can lead to volatility in prices.
Source: Statistics Canada. Table 20-10-0001-01 New motor vehicle sales
<--- Return to Archive