The Economics and Statistics Division maintains archives of previous publications for accountability purposes, but makes no updates to keep these documents current with the latest data revisions from Statistics Canada. As a result, information in older documents may not be accurate. Please exercise caution when referring to older documents. For the latest information and historical data, please contact the individual listed to the right.
<--- Return to Archive
For additional information relating to this article, please contact:
November 18, 2025FIXED CAPITAL INVESTMENT, STOCK, AGE AND SERVICE LIFE, 2024 Statistics Canada has released estimates for investment, stock, age and remaining service life of capital investments. Data are available for residential (investment, stock) and non-residential (investment, stock, age, service life). All values in this report are stated in constant dollar terms ($2017).
Residential capital stock and investment
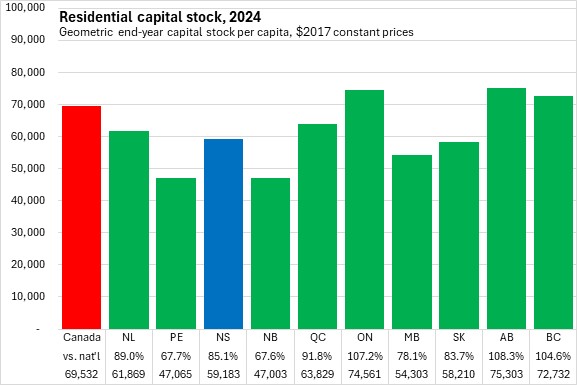
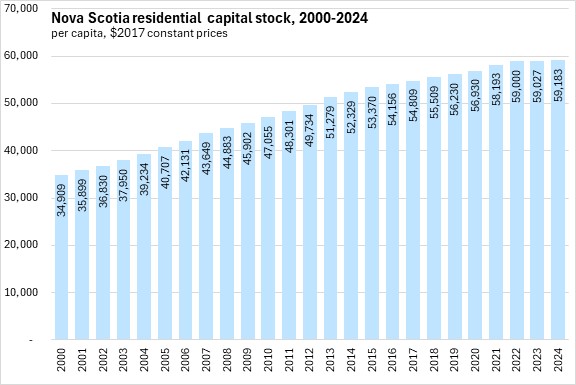
Nova Scotia real residential capital stock per capita ($2017) amounted to $59,183 or 85.1% of the national average. New Brunswick and Prince Edward Island (~2/3 of the national average) had the lowest capital stock per capita while Alberta (108.3% of the national average) and Ontario (107.2% of the national average) had the highest.
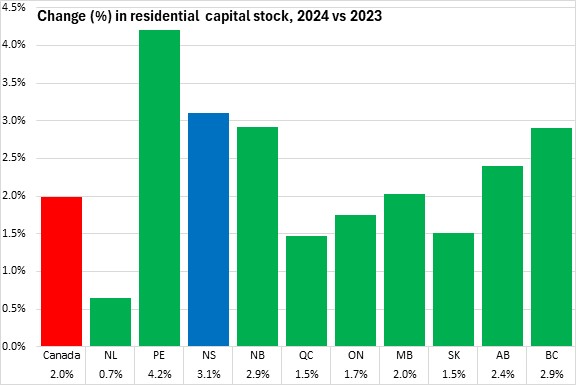
In the last year, Nova Scotia's residential capital stock (measured on a geometric end-year net basis including the impacts of investment, demolitions and depreciation) increased by 3.1%, the second fastest growth among provinces after Prince Edward Island. National residential capital stock increased by 2.0% with gains in all provinces. The slowest growth was reported in Newfoundland and Labrador.
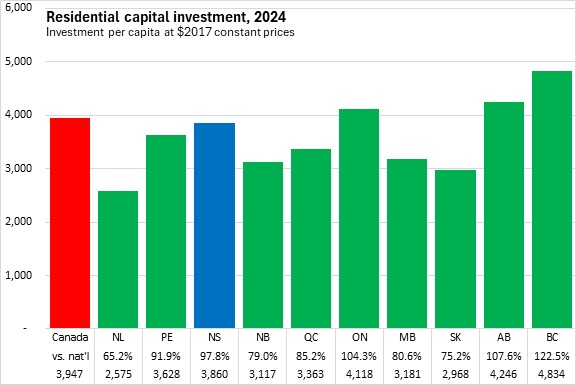
Per capita residential investment for 2024 (in real terms) was $3,860 in Nova Scotia or 97.8% of the national investment per capita ($3,947). Nova Scotia's real per capita investment was 6.7% of the 2023 end year capital stock. National investment was $3,947 per capita or 5.8% of 2023 end year capital stock. The largest investment was in British Columbia at $4,834 per capita (6.8% of 2023 capital stock) while Newfoundland and Labrador had the lowest per capita residential investment ($2,575 or 4.2% of 2023 capital stock).
Nova Scotia's real per capita investment in residential capital resumed growth in 2024 after a decline in 2023. However, residential investment has not yet returned to levels reported in 2021 and 2022.
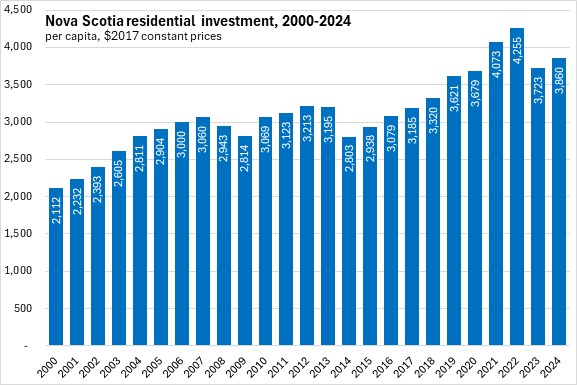
With continued population growth, Nova Scotia's real net stock of residential structures per capita grew more slowly in 2023 and 2024.
Non-residential capital stock and investment
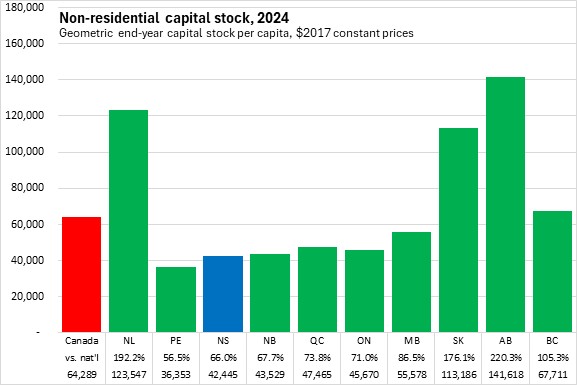
Nova Scotia's real net capital stock of non-residential assets was $42,445 per capita or 66.0% of the national average ($64,289 per capita). This was second lowest among province, ahead of Prince Edward Island.
The amount of non-residential capital stock varies considerably across Canada. Notably, provinces with higher natural resource endowments (Alberta, Newfoundland and Labrador and Saskatchewan) have considerably higher amounts of non-residential capital stock per capita than other provinces. Nova Scotia's net capital stock per capita was 30% of the value in Alberta. Outside resource-producing regions, net non-residential capital stock per capita was similar for Nova Scotia, New Brunswick, Quebec and Ontario; slightly higher for Manitoba and British Columbia and slightly lower for Prince Edward Island.
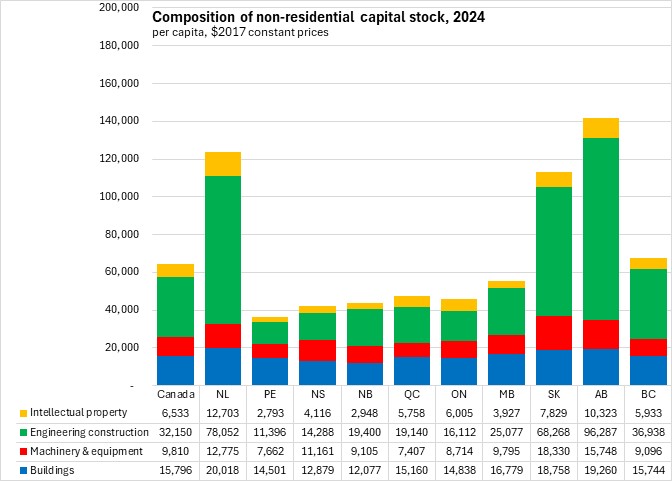
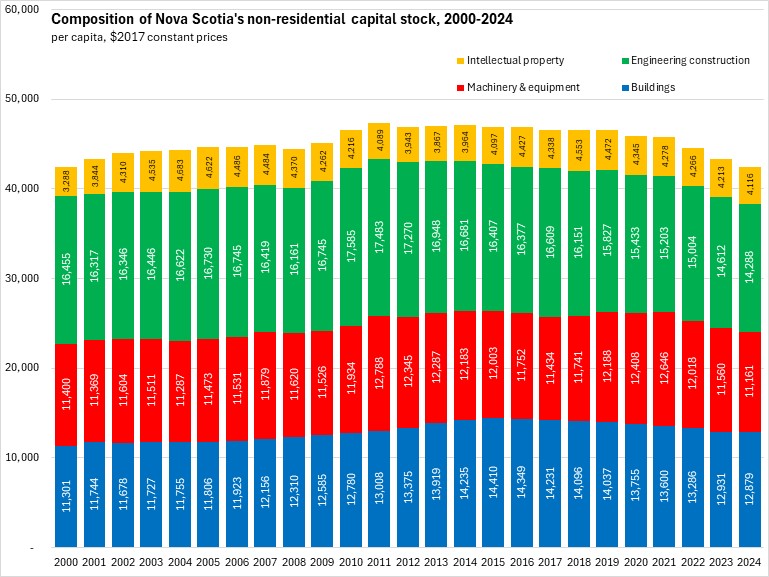
The composition of capital stock by type of asset shows that high quantities of engineering construction assets (including oil and gas production facilities) explain much of the high levels of non-residential capital stock in resource-producing regions. However, resource-producing regions also have higher amounts of machinery and equipment, non-residential buildings and intellectual property assets (including information generated through resource exploration).
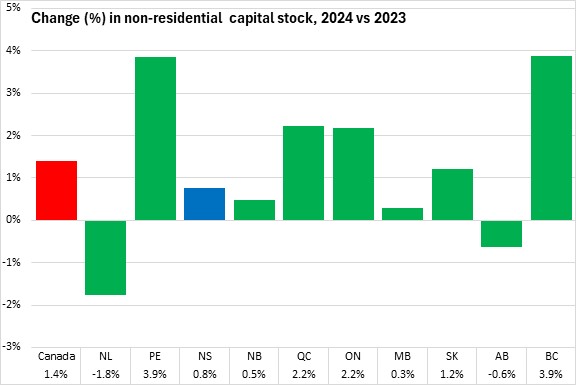
The size of Nova Scotia's real capital stock of non-residential assets increased by 0.8% in 2024, including the effects of investment and depreciation. This was slower than the 1.4% national increase. British Columbia reported the largest gains while Newfoundland and Labrador and and Alberta reported decreases.
Nova Scotia's non-residential capital stock has been declining in real per capita terms since 2014. The pace of this decline has quickened in the last three years.
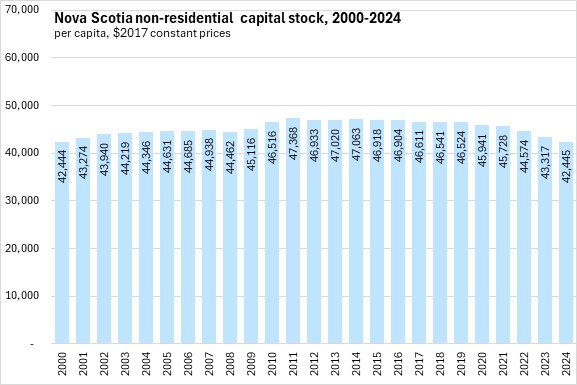
Nova Scotia's declining non-residential capital stock since 2014 can be attributed to falling stock of engineering construction, machinery and buildings.
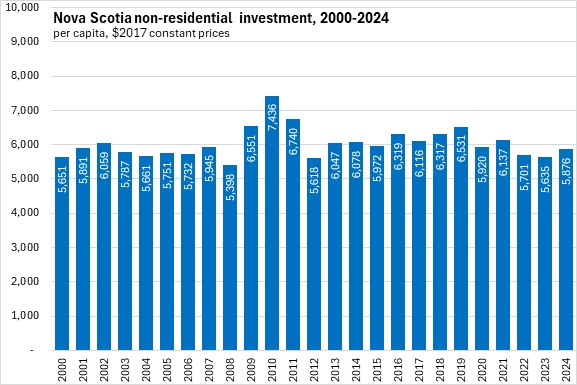
In 2024, Nova Scotia real investment per capita in non-residential capital stock was $5,876 or 66.5% of the national per capita value ($8,832). This was less than half the values reported in either Saskatchewan or Alberta. As with capital stock, resource-producing regions invested in much more non-residential assets per capita than did central Canada, Manitoba and the Maritime provinces.
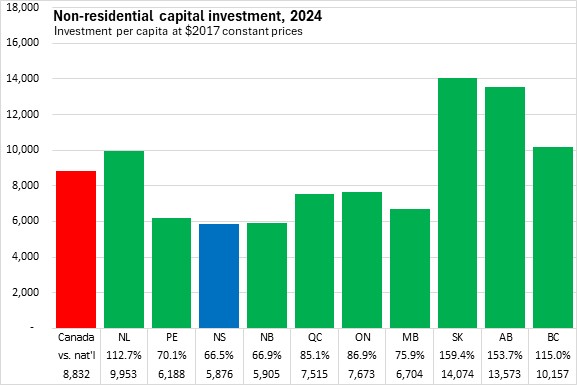
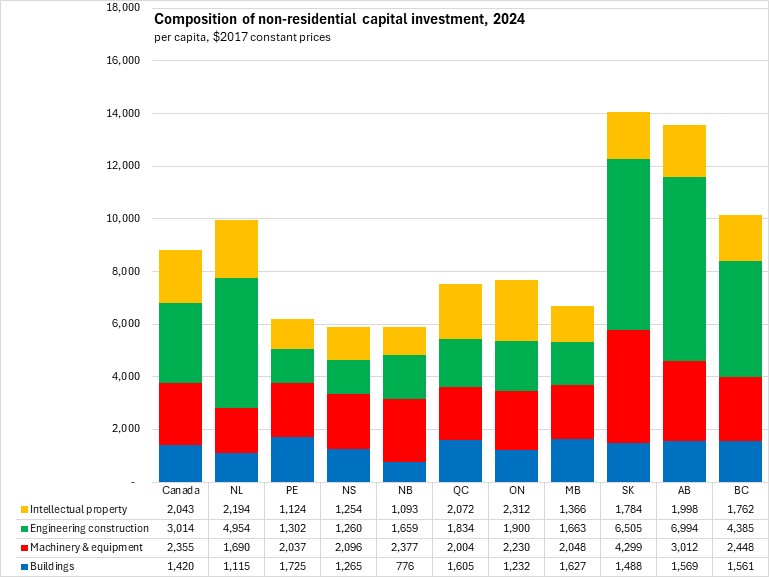
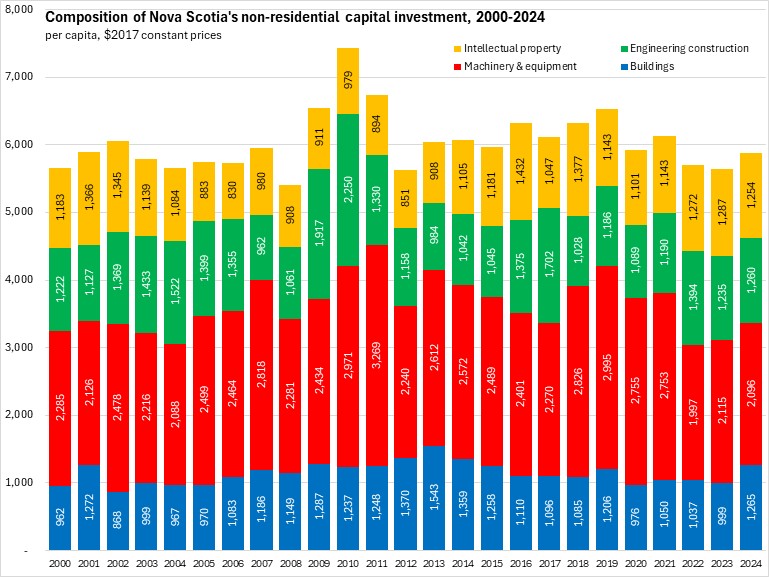
Higher levels of investment reported in resource-producing regions are particularly concentrated in engineering construction assets with higher investments in machinery and equipment as well as intellectual property.
Nova Scotia's pace of real investment in non-residential assets slowed in 2020 and had not yet recovered to 2019 levels by 2024.
Nova Scotia's investment in non-residential assets is generally concentrated in machinery and equipment.
Asset age and remaining service life
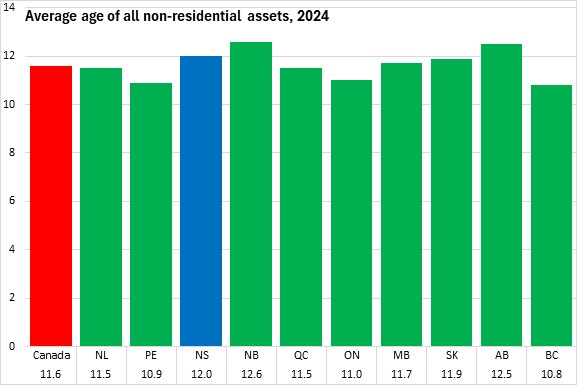
Nova Scotia's non-residential assets had an average age of 12.0 years (at current prices). This was the third oldest average age of assets after New Brunswick and Alberta. The newest average ages for non-residential assets were reported in Ontario, British Columbia and Prince Edward Island.
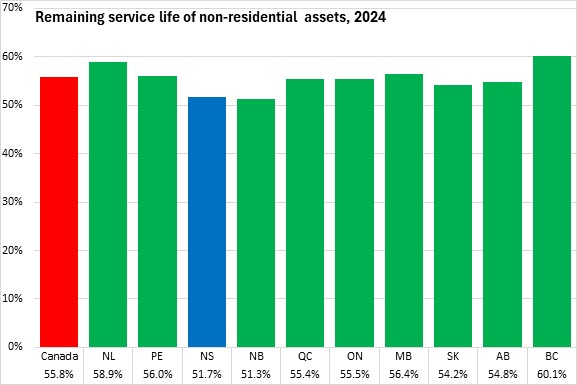
Nova Scotia reported the second lowest amount of remaining service life in their stocks of non-residential assets (51.7%, at current prices), just ahead of New Brunswick. The longest remaining service life of non-residential assets was reported in British Columbia.
Source: Statistics Canada. Table 36-10-0098-01 Flows and stocks of fixed non-residential capital for all industries, by type of asset, provinces and territories (x 1,000,000); Table 36-10-0099-01 Flows and stocks of fixed residential capital by type of asset, provincial and territorial (x 1,000,000); Table 34-10-0166-01 Average age measures of non-residential capital stock by industry, by asset, Canada, provinces and territories
<--- Return to Archive