The Economics and Statistics Division maintains archives of previous publications for accountability purposes, but makes no updates to keep these documents current with the latest data revisions from Statistics Canada. As a result, information in older documents may not be accurate. Please exercise caution when referring to older documents. For the latest information and historical data, please contact the individual listed to the right.
<--- Return to Archive
For additional information relating to this article, please contact:
November 21, 2025GOVERNMENT FINANCIAL STATISTICS, 2024 Statistics Canada has published the latest Consolidated Government Finance Statistics (CGFS) for 2024 including consolidated results for provincial-territorial plus local governments. Statistics Canada's data allows for comparability across jurisdictions, as well as consistency with the government consumption and investment data reported in macroeconomic accounts.
These data are based on the international government financial statistical standard and, as such, may differ in their presentation from similar concepts reported in Public Accounts and other government financial statements. CGFS data differ from reports published by governments due to differences in institutional coverage, accounting rules, timing and integration with the Canadian macroeconomic accounts.
The following analysis compares the per capita results for consolidated provincial-and-local governments. Local governments are consolidated into the analysis because each provincial government may assign different responsibilities to municipal or local governments.
Values for 2023 and 2024 may be influenced be extraordinary economic circumstances including elevated inflation and monetary tightening as well as rapid population growth and rising real estate values.
Revenues and Taxes
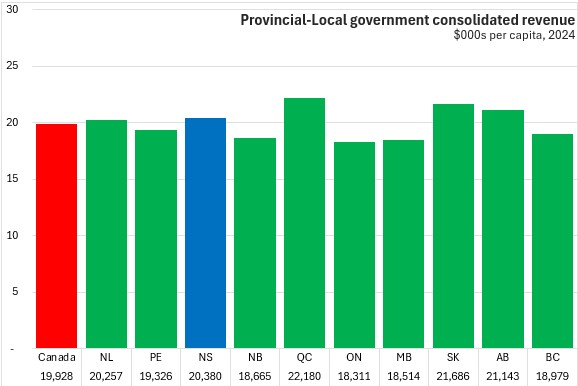
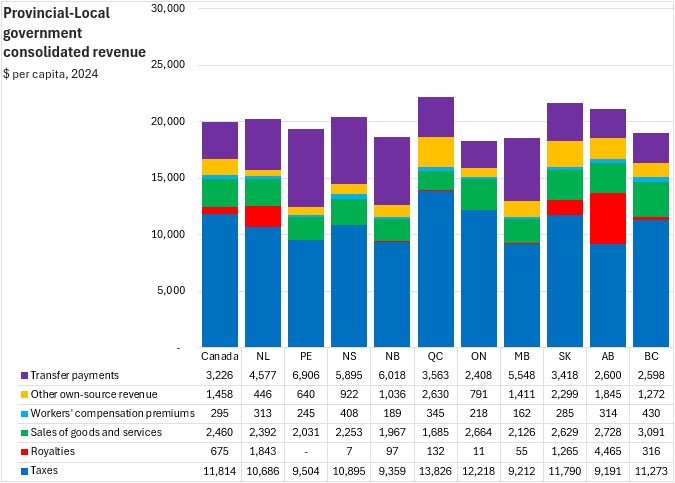
Total revenues per capita vary across the country, with Nova Scotia's provincial-local government revenues amounting to $20,380 per capita in 2024. This was above the Canadian average of $19,928 per capita. The highest per capita revenues were in Québec ($22,180), where the government offers a different mix of public services, including delivering some services that are otherwise delivered by the Federal government. The value of the Quebec abatement to Federal taxes was $839 per capita and is included in revenue figures presented here. The lowest per capita revenues were in Ontario ($18,311).
Although Nova Scotia's provincial-local government revenues were 102.3% of the national per capita average, Nova Scotia's nominal GDP per capita was 80.1% of the national average. Thus, provincial-local government revenues amounted to a larger portion of Nova Scotia's comparatively smaller GDP per capita.
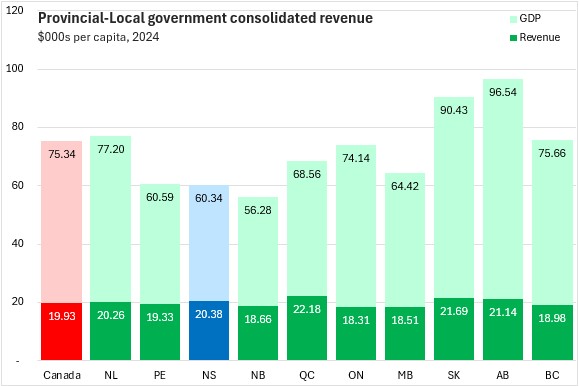
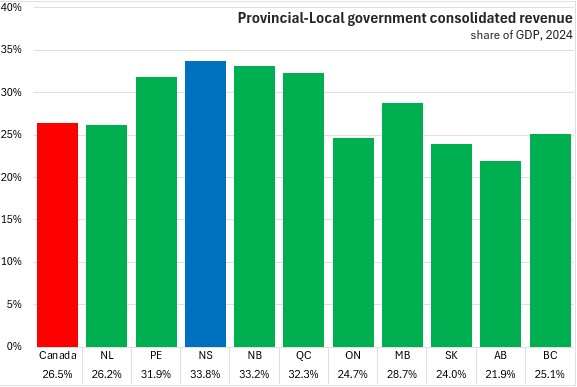
With Nova Scotia's lowest GDP per capita, Nova Scotia's provincial-local government consolidated revenues amount to 33.8% of provincial GDP - the highest share among provinces. Nationally, provincial-local consolidated revenues amounted to 26.5% of GDP. In contrast to Nova Scotia, Alberta's GDP per capita was the highest among provinces - 59.5% higher than that of Nova Scotia. So even though Alberta's per capita provincial-local consolidated revenues were higher, they only amounted to 21.9% of that province's GDP.
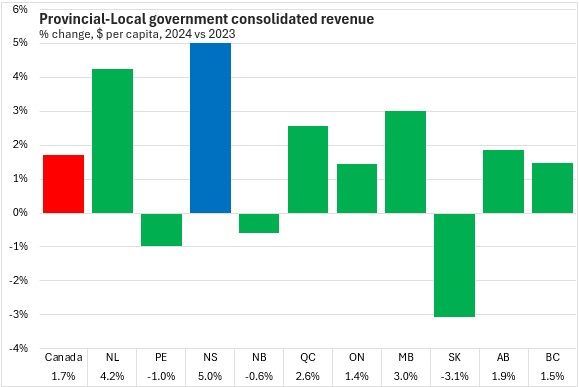
Per capita revenues increased by 5.0% in Nova Scotia from 2023 to 2024. This was the fastest increase in per capita revenues among provinces. Nationally, per capita revenues for consolidated provincial-local governments grew by 1.7% with gains in seven provinces. Saskatchewan reported the sharpest decline.
Taxes and transfers made up the largest portions of provincial-local consolidated government revenues in 2024.
Taxes are typically the largest source of consolidated provincial-local government revenues. Nationally, provincial-local consolidated tax revenues amounted to $11,814 per capita across Canada. Nova Scotia's tax revenues were $919 per capita lower than the national average ($11,814) at $10,895 per capita. The highest provincial-local tax revenues were in Québec at $13,826 (before the $839 per capita Quebec abatement of Federal taxes).
Beyond taxes and user fees, consolidated provincial-local governments generate revenues from workers compensation premiums, fiscal transfer payments, interest/dividend income, royalties and sales of goods/services. Those provinces that are Equalization recipients report higher fiscal transfer revenues per capita, particularly in the Maritimes and Manitoba. Nova Scotia's transfer payments amounted to $5,895 per capita.
Provinces with substantial oil and gas sectors (and to a lesser extent hydroelectricity and forestry) report stronger royalty income. In Alberta, royalty revenues were $4,465 per capita. Newfoundland and Labrador ($1,843) and Saskatchewan ($1,265) also reported substantial royalty revenues. In comparison, Nova Scotia's consolidated provincial-local royalty revenues amounted to $7 per capita (Prince Edward Island had none while Ontario had $11 per capita).
Saskatchewan and Quebec also report substantially higher revenues from other sources, though this may include specific items that cannot be classified with others. In Statistics Canada's data, consolidated revenue from sales of goods and services includes tuition fees.
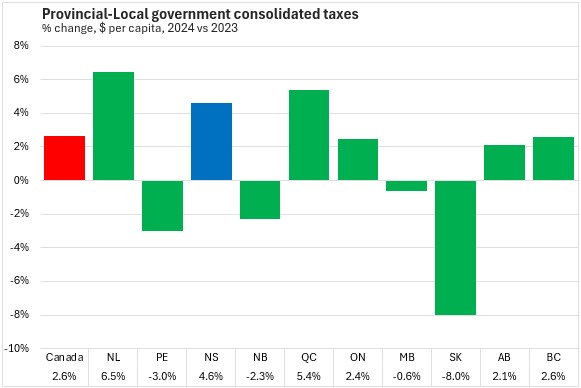
Per capita taxes for provincial-local governments increased 2.6% from 2023 to 2024 across the country with six provinces reporting gains. Nova Scotia's taxes per capita increased by 4.6%. Newfoundland and Labrador (+6.5%) reported the fastest growth while Saskatchewan (-8.0%) reported the sharpest decrease.
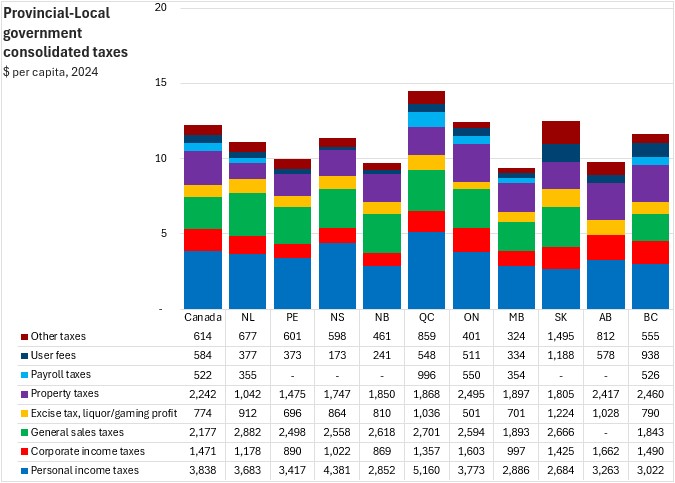
Tax revenues break down into 8 major categories, including personal income taxes, corporate income taxes, general sales taxes, excise taxes/profits of fiscal monopolies, payroll taxes, property taxes, user fees and other taxes. The amount of revenues generated by these taxes reflects both the tax system itself (tax rates, deductions, credits, number of taxes levied) as well as overall economic conditions.
Personal income taxes per capita were $4,381 in Nova Scotia or 14.1% above the national average ($3,838). Québec reported the highest consolidated provincial-local personal income taxes per capita at $5,160 while Saskatchewan reported the lowest at $2,684 per capita.
Nova Scotia's corporate income taxes were $1,022 per capita - 69.5% of the national per capita average ($1,471). Corporate income taxes per capita were highest in Ontario ($1,603) and Alberta ($1,662). The lowest corporate income taxes per capita were reported in New Brunswick ($869).
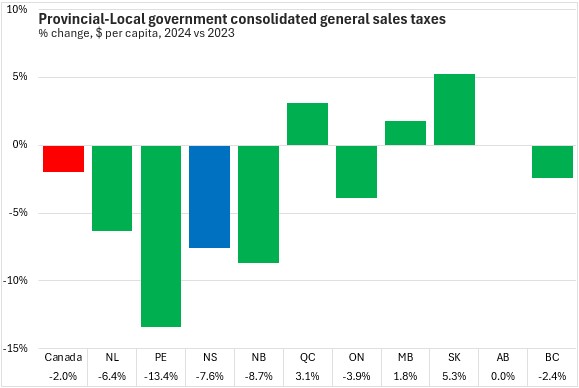
Nova Scotia's consolidated provincial-local general sales tax revenues were $2,558 per capita in 2024, 17.5% higher than the national average ($2,177). General sales tax revenues were highest in Newfoundland and Labrador ($2,882) and lowest in Alberta (which has no general sales tax).
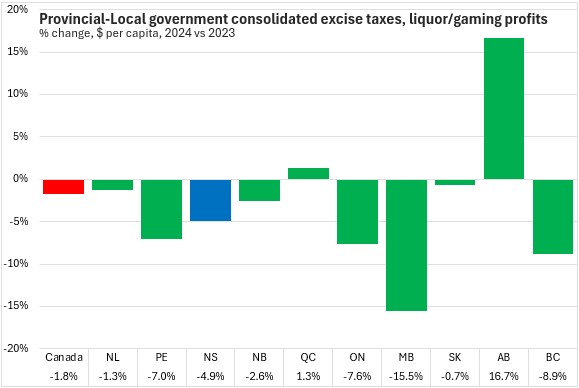
Excise taxes plus the profits remitted from liquor and gaming monopolies were $864 per capita in Nova Scotia in 2024, 11.6% above the national average ($774 per capita). Consolidated provincial-local excise taxes and remitted profits from fiscal monopolies were highest in Saskatchewan and lowest in Ontario.
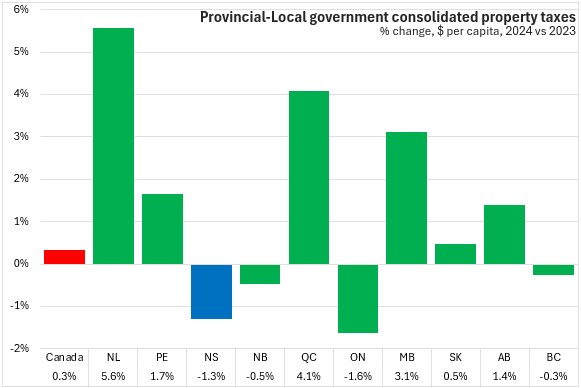
Property tax revenues for consolidated provincial-local governments amounted to $1,747 per capita in Nova Scotia, which was 77.9% of the national average ($2,242). Ontario ($2,495), Alberta ($2,417) and British Columbia ($2,460) reported the highest consolidated provincial-local property tax revenues per capita.
Only Newfoundland and Labrador, Quebec, Ontario, Manitoba and British Columbia generate revenue from payroll taxes.
Nova Scotia's personal income taxes per capita increased by 11.8% in Nova Scotia in 2024 - the fastest growth among provinces. Nationally, personal income taxes per capita were up 4.5% with gains in eight provinces. Manitoba reported the most substantial decline in personal income taxes per capita (-7.0%).

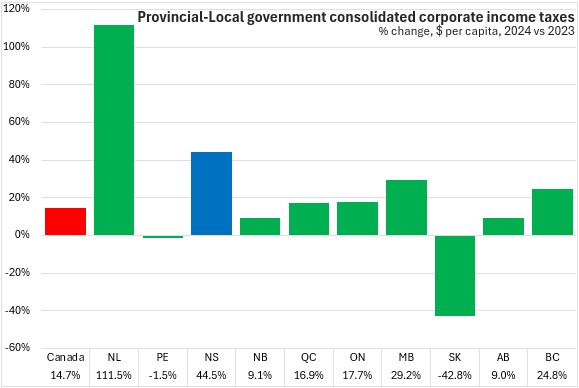
Corporate income taxes are often volatile from one year to the next. Nova Scotia's consolidated provincial-local corporate income tax revenues per capita rose by 44.5% in 2024 - second fastest among provinces after Newfoundland and Labrador. Nationally, corporate income taxes per capita grew by 14.7% with gains in every province except Prince Edward Island and Saskatchewan.
Per capita general sales tax revenues from consolidated provincial-local governments declined 7.6% in Nova Scotia in 2024. Nationally, general sales tax revenues per capita were down 2.0% with declines in six of nine provinces with general sales tax. Prince Edward Island reported the steepest drop in general sales tax revenues per capita while Saskatchewan reported the fastest growth.
Excise taxes (such as tobacco and fuel) along with profits from fiscal monopolies (such as liquor and gaming) were down 4.9% per capita in Nova Scotia in 2024. Nationally, these revenues declined 1.8% per capita with declines in all provinces except Québec and Alberta. Manitoba reported the sharpest decline in excise taxes and fiscal monopoly profits per capita.
Nova Scotia's consolidated provincial-local property tax revenues per capita declined by 1.3% - the second steepest decline among provinces after Ontario. Nationally property tax revenues per capita were up 0.3% with gains in six provinces led by Newfoundland and Labrador.
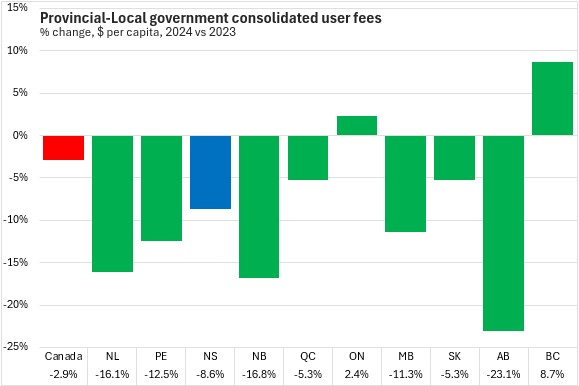
Nova Scotia's consolidated provincial-local user fees declined 8.6% per capita in 2024. Nationally, user fee revenues per capita fell 2.9% per capita on declines in all provinces except Ontario and British Columbia. Alberta reported the steepest drop in per capita user fee revenues (-23.1%).
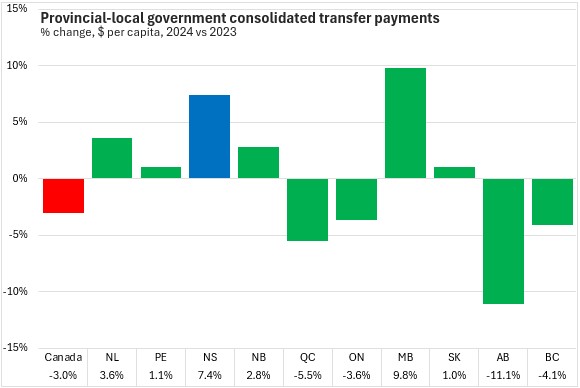
Per capita transfers for consolidated provincial-local governments were up 7.4% in Nova Scotia - second fastest among provinces after Manitoba (+9.8%). Nationally, per capita transfer revenues for consolidated provincial-local governments were down 3.0% despite gains in six provinces. Alberta (-11.1%) reported the steepest decline.
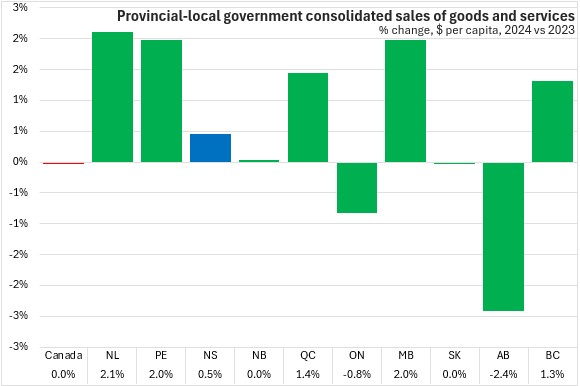
Consolidated provincial-local revenues include substantial revenues from the sale of goods and services, which includes tuition fees, recreation fees and insurance premiums in provinces with public insurance corporations. Nova Scotia's per capita revenues from sales of goods and services increased by 0.5% in 2024. Nationally, sales revenue from goods and services edged down -0.03% per capita desite gains in seven provinces. Newfoundland and Labrador, Manitoba and Prince Edward Island reported the largest gains in per capita revenues from sales of goods and services while Alberta reported the sharpest decline.
Expenses
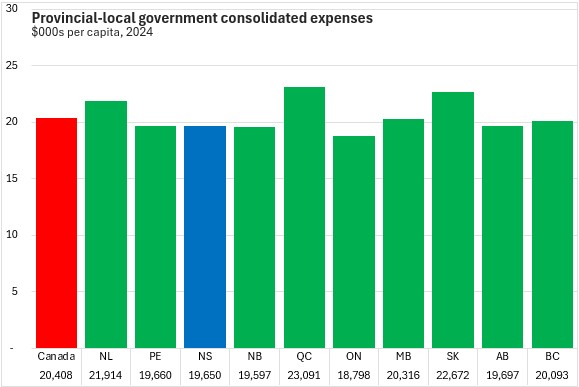
Consolidated provincial-local government expenditures in Canada were $20,408 per capita. Nova Scotia's consolidated provincial-local government expenditures were $19,650 per capita or 96.3% of the national average per capita. Ontario ($18,798 per capita) reported the lowest per capita expenditures while Québec had the highest ($23,091). .
As with consolidated provincial-local government revenues, modest differences in per capita expenditures appear larger when measured relative to GDP per capita, which remained substantially larger in resource-producing provinces.
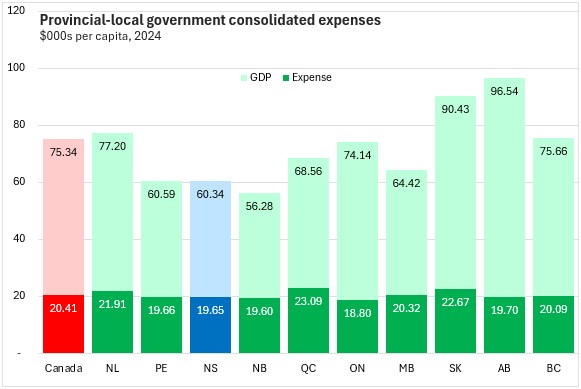
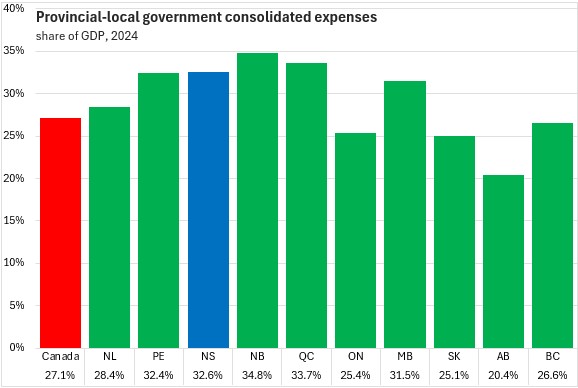
Nova Scotia's provincial local consolidated government expenditures amounted to 32.6% of GDP - the third highest among provinces after Québec and New Brunswick. Across Canada, provincial-local expenditures amounted to 27.1% of GDP. With high GDP per capita, Alberta's provincial-local expenditures were the lowest at 20.4% of GDP.
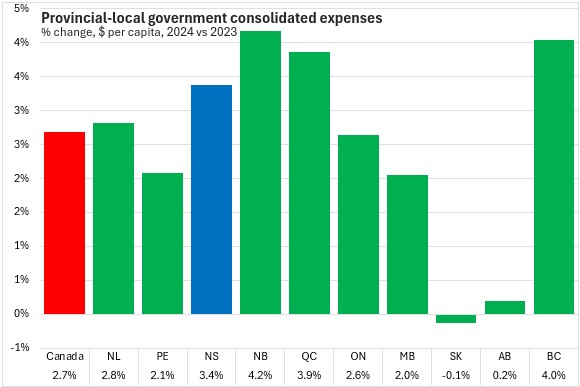
Consolidated provincial-local government expenditures increased in all provinces except Saskatchewan (-0.1%) from 2023 to 2024. Growth in Nova Scotia was 3.4%, outpacing the national growth of 2.7%.
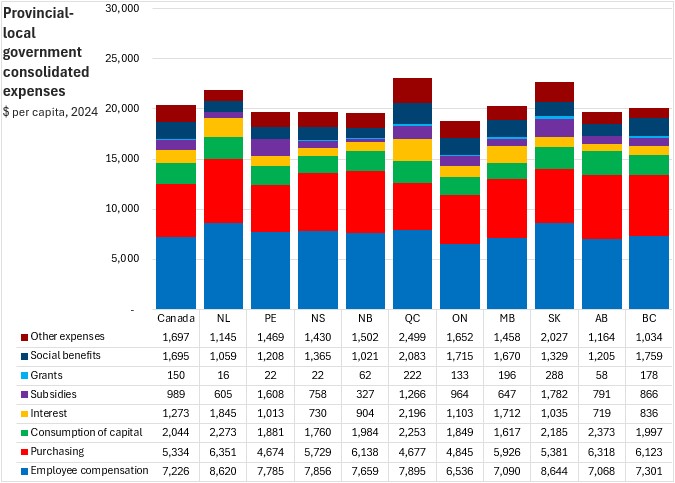
The largest components of consolidated provincial-local government expenditures were: employee compensation, purchases of goods and services, consumption of capital, social benefits, interest payments and subsidies.
Nova Scotia's consolidated provincial-local government employee compensation (including health agencies, social service institutions, colleges and universities along with provincial and local governments) amounted to $7,856 per capita, which was 8.7% above the national average ($7,226). Saskatchewan ($8,644) and Newfoundland and Labrador ($8,620) reported the highest consoldiated provincial-local government employee compensation while Ontario ($6,536) reported the lowest).
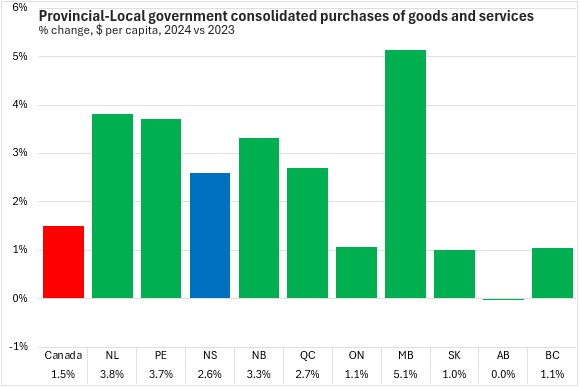
Purchases of goods and services was the next largest expenditure category with a national average provincial-local government expenditure of $5,334 per capita. Nova Scotia provincial-local purchases of goods and services were $5,729 per capita (7.4% above the national average). Expenditures on goods and services were highest in Alberta ($6,318). Québec ($4,677) and Prince Edward Island ($4,674) reported the lowest per capita purchases of goods and services by consolidated provincial-local governments.
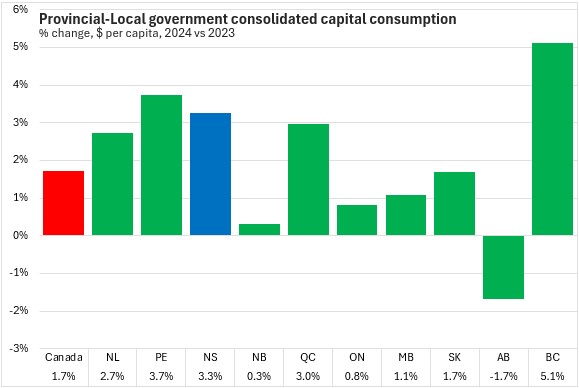
Capital consumption expenses per capita were $1,760 for Nova Scotia's consolidated provincial-local government sector in 2024 - second lowest among provinces after Manitoba ($1,617). Nationally, consolidated provincial-local capital consumption expenditures were $2,044 per capita in 2024. Alberta reported the largest consolidated provincial-local capital consumption expenditures per capita ($2,373).
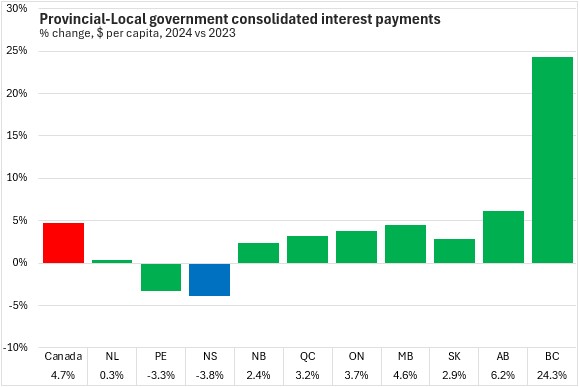
Interest expenses depend on net financial liabilities and costs of funds. Across Canada, consolidated provincial-local expenditures on interest payments averaged $1,273 per capita while interest costs were $730 per capita in Nova Scotia, the second lowest among provinces after Alberta ($719). The highest per capita interest expenditures were in Québec ($2,196).
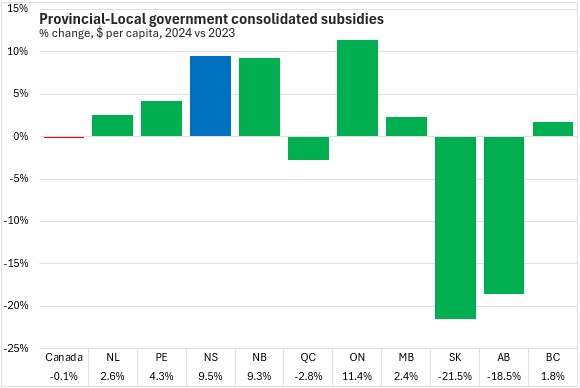
Subsidies (particularly in agriculture) were uneven across the country, with an average of $989 per capita. Nova Scotia's consolidated provincial-local government subsidies amounted to $758 per capita. The highest per capita subsidy payments were in Saskatchewan at $1,782 per capita. The lowest subsidies were paid in New Brunswick ($327 per capita).
Social assistance and family/employment benefit expenditures per capita were $1,695 per capita across Canada. Nova Scotia's social benefits per capita from provincial-local governments were $1,365 in 2024. The lowest social benefits were paid in New Brunswick ($1,021 per capita) and Newfoundland and Labrador ($1,059) while Québec reported the highest ($2,083)
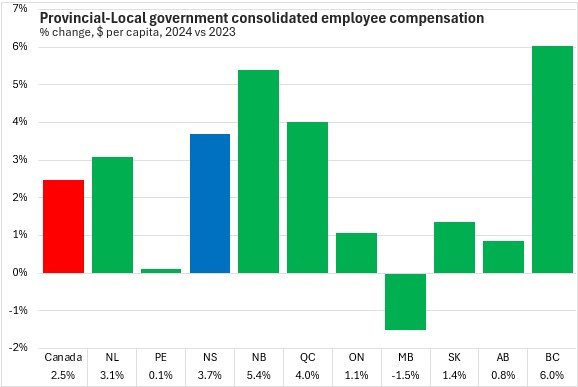
Compared with 2023, per capita consolidated provincial-local expenditures on employee compensation rose 3.7% in Nova Scotia. Nationally employee compensation expenditures for consolidated provincial-local governments were up 2.5% per capita with gains in all provinces except Manitoba (-1.5%). British Columbia reported the fastest rise (+6.0%).
Over the last year, Nova Scotia's consolidated provincial-local purchases of goods and services increased by 2.6% per capita. Nationally, these purchases were up 1.5% per capita with increases in all provinces except Alberta (little changed). Manitoba reported the fastest rise (+5.1%).
Capital consumption expenses per capita for Nova Scotia's consolidated provincial-local government sector in 2024 were up 3.3% from 2023. Nationally, consolidated provincial-local capital consumption expenditures were up 1.7% increase from 2023. British Columbia reported the fastest growth (+5.1%) while Alberta reported the only decline (-1.7%).
Consolidated provincial-local government interest expenditures fell by 3.8% in Nova Scotia - the steepest decline among provinces. Nationally, consolidated provincial-local interest expenditures were up 4.7% per capita in 2024 with gains in all provinces except Prince Edward Island and Nova Scotia. British Columnia reported the fastest rise in consolidated provincial-local government interest expenditures (+24.3%).
Compared with 2023, Nova Scotia's consolidated provincial-local subsidies per capita increased by 9.5%. Nationally, per capita subsidies were down 0.1% despite increases in seven provinces (led by Ontario). Saskatchewan reported the sharpest decline in per capita subsidies from provincial-local governments in 2024.
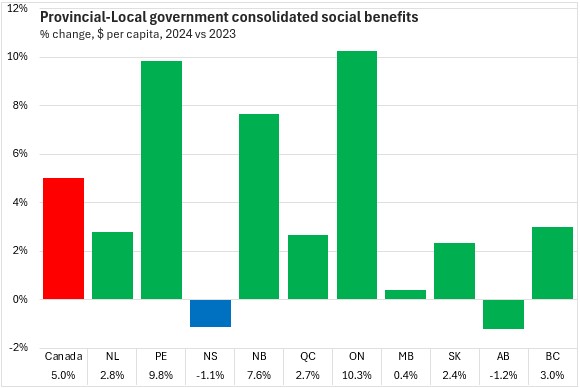
Compared with 2023, Nova Scotia's social benefits per capita from provincial-local governments fell by 1.1%. Nationally, social benefits from provincial-local governments were up 5.0% per capita with gains in all provinces except Nova Scotia and Alberta (-1.2%). Ontario (+10.3%) and Prince Edward Island (+9.8%) reported the fastest growth in provincial-local government consolidated social benefits.
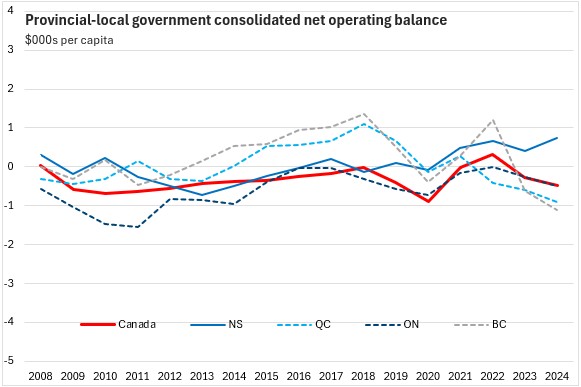
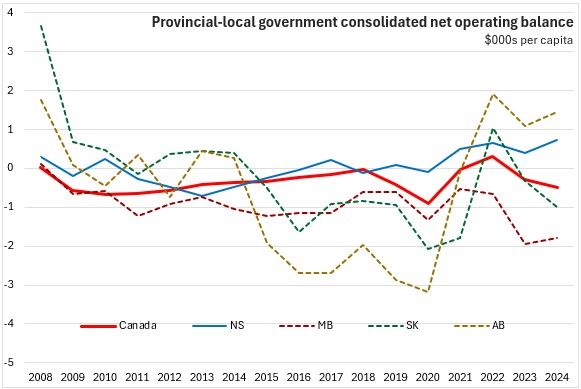
Net Operating Balance
The net operating balance of the consolidated provincial-local government sector reflects the difference between revenues and expenses. As this includes local governments, colleges, universities, workers' compensation boards and other entities, it is not comparable to statements of surplus or deficit for Provincial governments as reported in their respective Public Accounts.
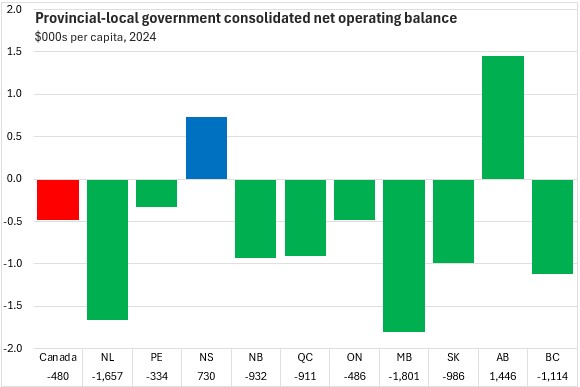
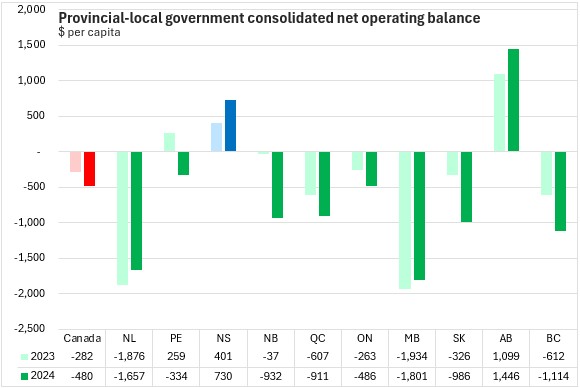
In 2024, Nova Scotia ($730 per capita) and Alberta ($1,446 per capita) were the only consolidated provincial-local government entities with positive net operating balances. The largest net operating deficit was reported in Manitoba (-$1,801 per capita). The consolidated provincial-local government sector reported a deficit of $480 per capita across Canada.
Manitoba, Newfoundland and Labrador, Nova Scotia and Alberta all reported improvements in consolidated provincial-local government net operating balance per capita in 2024. All other provinces (and the national average) reported deteriorating consolidated provincial-local net operating balances with New Brunswick reporting the steepest erosion.

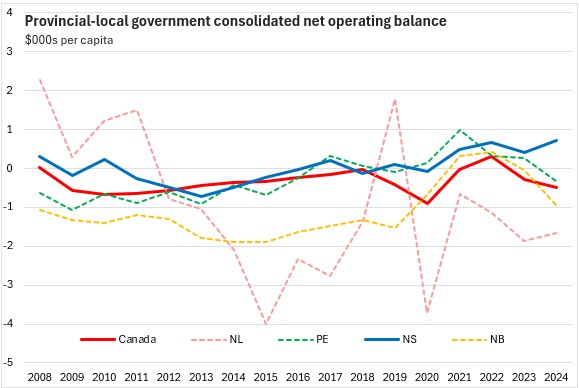
With last year's gain, Nova Scotia's consolidated provincial-local government net operating balance resumed a rising trend that has been underway (with interruptions) since 2013.
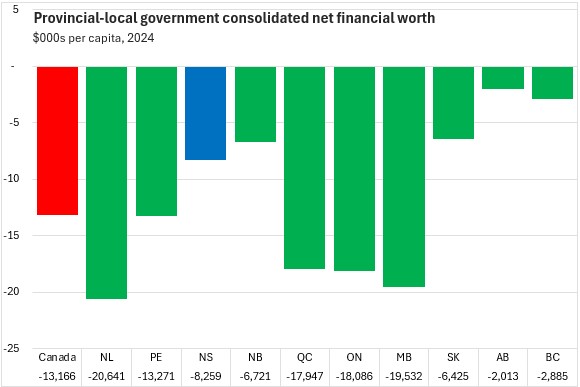
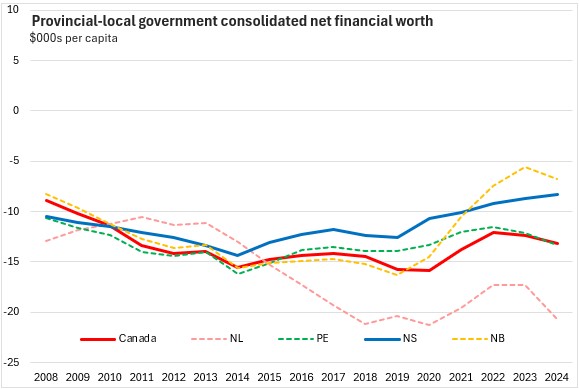
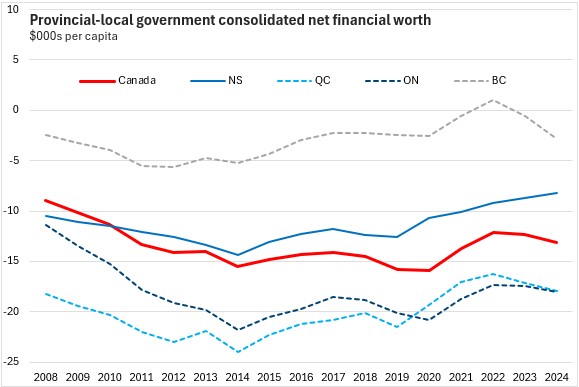
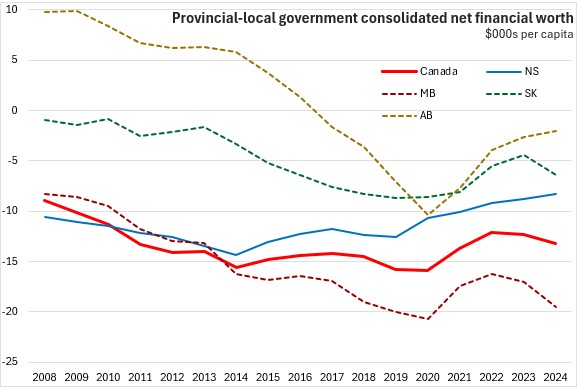
Net Financial Worth
As with net operating balance, the net financial worth of the consolidated provincial-local government sector includes different entities and accounting treatments than reported by Provincial governments in Public Accounts.
All provinces report negative net financial worth of consolidated provincial-local governments, with an average of -$13,166 per capita across Canada. The three westernmost provinces along with Nova Scotia and New Brunswick had the strongest net financial worth in 2024. Nova Scotia's provincial-local government net financial worth was -$8,259 per capita. The largest negative net financial worth per capita values were reported in Newfoundland and Labrador, Manitoba, Ontario and Québec.
Net financial worth per capita deteriorated for all provinces except Nova Scotia and Alberta in 2024. The largest deteriorations were in Newfoundland and Labrador and Manitoba.
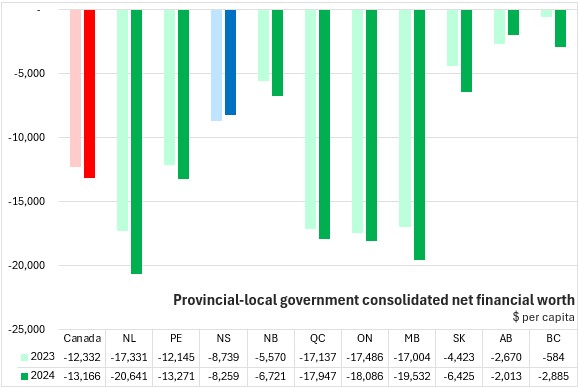
Nova Scotia's net financial worth has been on an improving trend since 2014 (except for 2018-2019).
Statistics Canada. Table 10-10-0147-01 Canadian government finance statistics (CGFS), statement of operations and balance sheet for consolidated governments (x 1,000,000); Table 17-10-0009-01 Population estimates, quarterly; Table 36-10-0222-01 Gross domestic product, expenditure-based, provincial and territorial, annual (x 1,000,000)
<--- Return to Archive