The Economics and Statistics Division maintains archives of previous publications for accountability purposes, but makes no updates to keep these documents current with the latest data revisions from Statistics Canada. As a result, information in older documents may not be accurate. Please exercise caution when referring to older documents. For the latest information and historical data, please contact the individual listed to the right.
<--- Return to Archive
For additional information relating to this article, please contact:
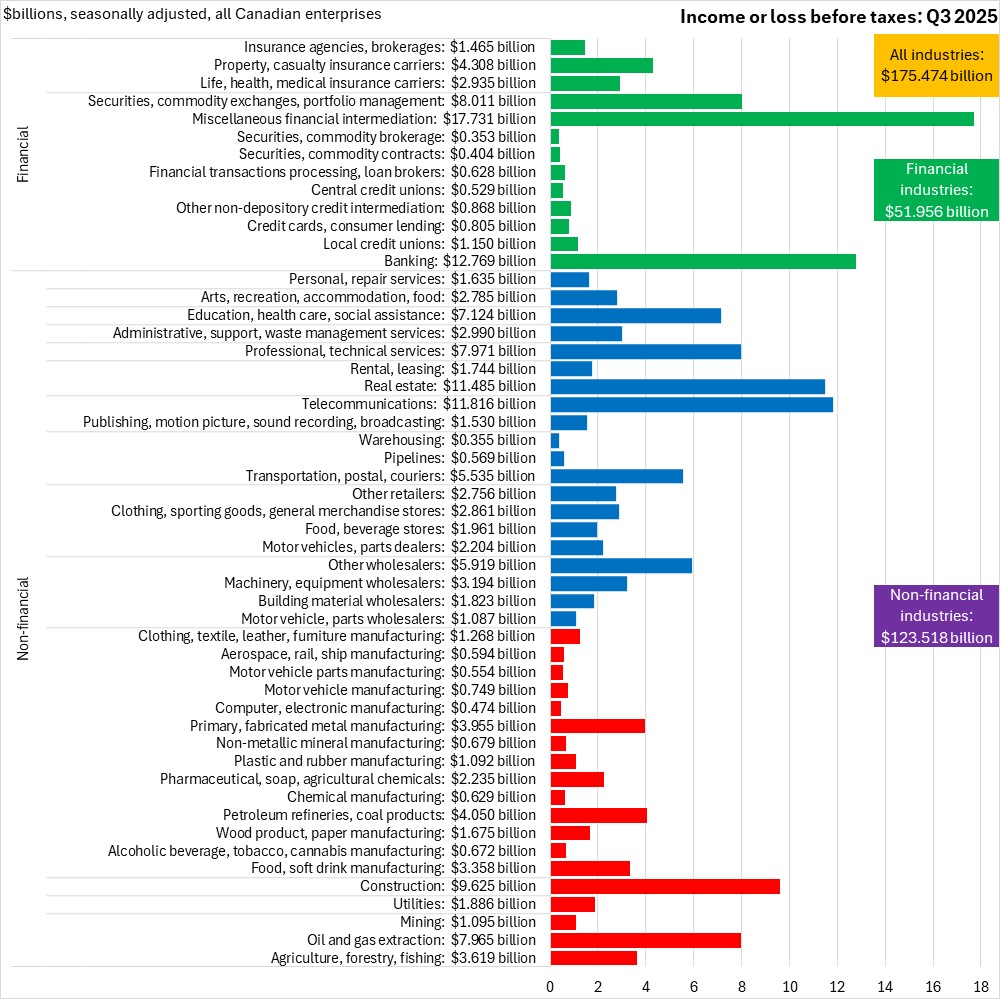
November 24, 2025CANADA FINANCIAL STATISTICS FOR ENTERPRISES, Q3 2025 In Q3 2025, Canadian enterprise net income before taxes (seasonally adjusted) was $175.474 billion. All broad industry categories reported positive income before taxes in Q3 2025. The largest values of net income before taxes were reported in miscellaneous financial intermediation ($17.731 billion), banking ($12.769), telecommunications ($11.816), real estate ($11.485 billion), and construction ($9.625).
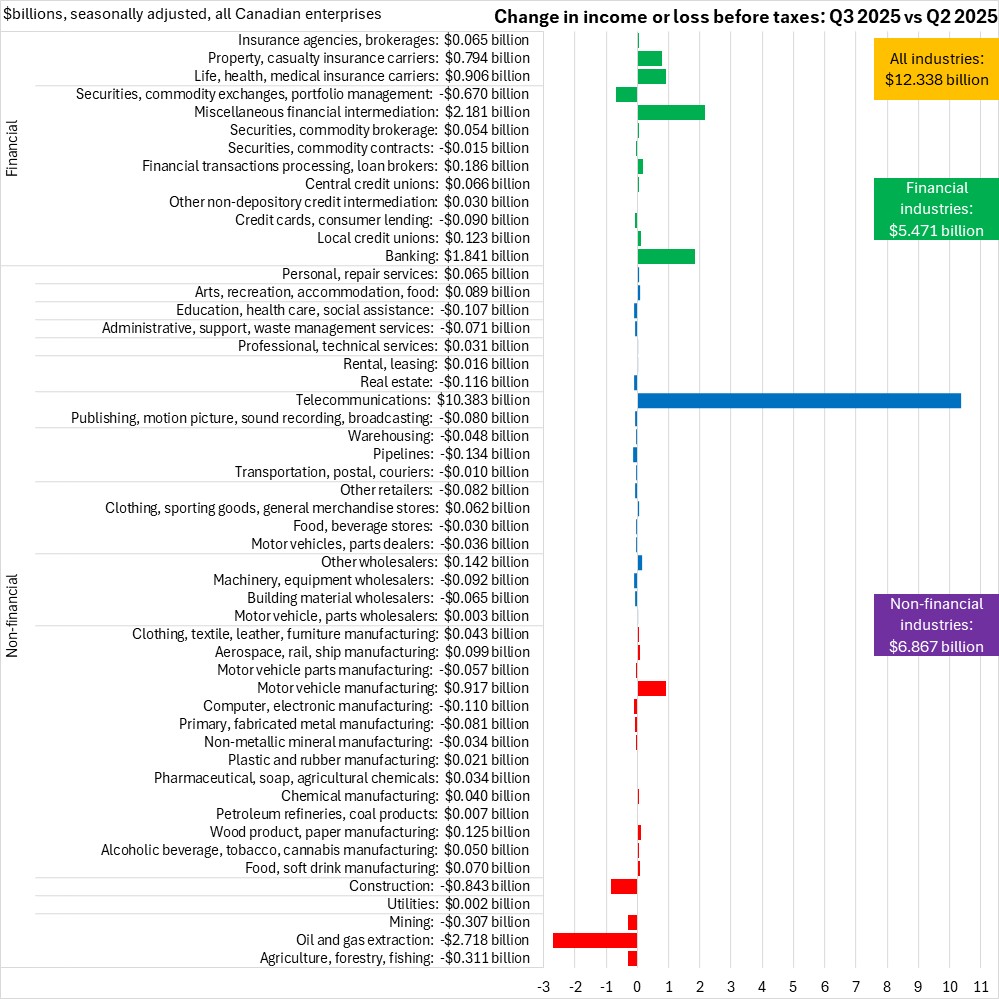
Compared with Q2 2025, net income before taxes rose by $12.338 billion across all industries. Net income increased by $5.471 billion for financial/insurance industries largely on gains in miscellaneous financial intermediation, banking, life/medical/health insurance carriers, and property/casualty insurance carriers. Securities/commodity/exchanges/portfolio management reported the largest drop in net income before taxes among financial industries.
Net income for non-financial industries rose by $6.867 billion. Telecommunications is reported to have had a significant increase non-financial net income while oil/gas extraction posted the largest decline in non-financial net income in the Q3 2025.
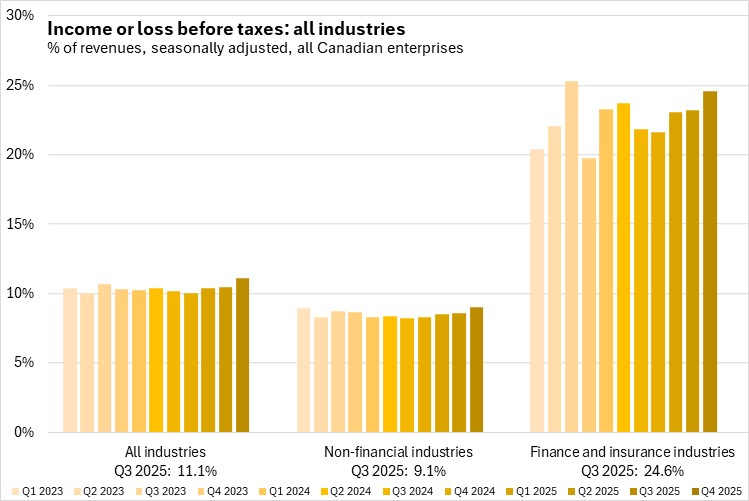
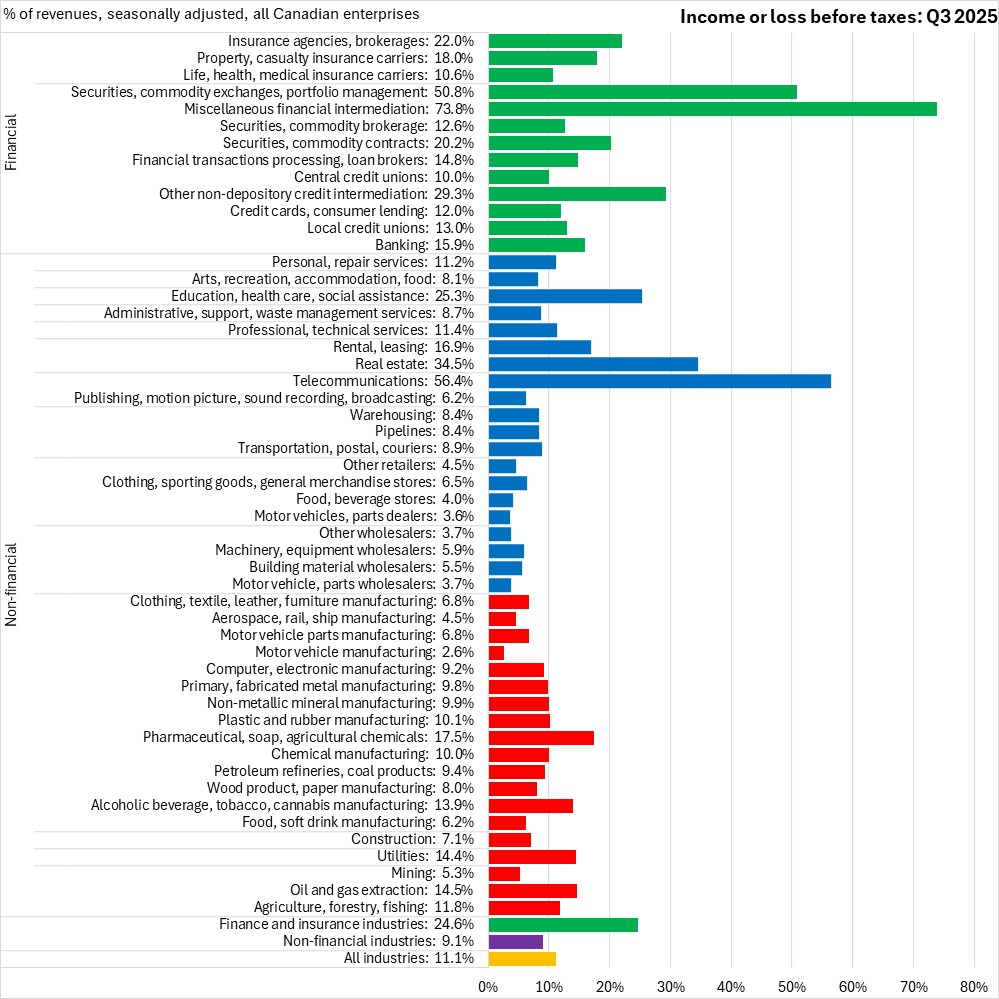
Measured as a share of revenue, income before taxes averaged 11.1% across all industries; 24.6% for financial industries and 9.1% for non-financial industries. Income as a share of revenues was up for both non-financial and financial industries in Q3 2025.
Measured as a share of revenue, income before taxes was highest in miscellaneous financial intermediation (73.8% of revenues) followed by telecommunications (56.4%), securities/commodity exchanges/portfolio management (50.8%), and real estate (34.5%).
Source: Statistics Canada. Table 33-10-0226-01 Quarterly balance sheet and income statement, by industry, seasonally adjusted (x 1,000,000)
<--- Return to Archive