The Economics and Statistics Division maintains archives of previous publications for accountability purposes, but makes no updates to keep these documents current with the latest data revisions from Statistics Canada. As a result, information in older documents may not be accurate. Please exercise caution when referring to older documents. For the latest information and historical data, please contact the individual listed to the right.
<--- Return to Archive
For additional information relating to this article, please contact:
November 27, 2025GOVERNMENT EXPENDITURE BY FUNCTION, 2024 Statistics Canada has published details from Consolidated Government Finance Statistics for 2024 including consolidated results for provincial-territorial and local governments by nine functional areas of expenditure: health care, education, social protection, general public service (which includes debt payments), economic affairs (which includes transportation), public order/safety, environmental protection (which includes wastewater and solid waste), housing/community amenities (which includes water services) and recreation/culture.
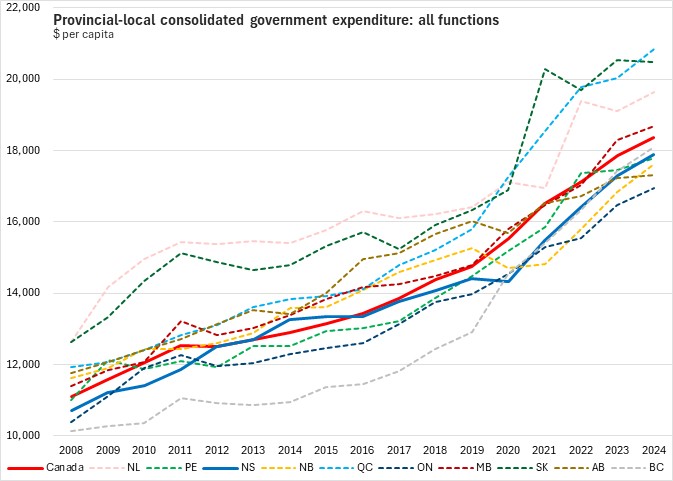
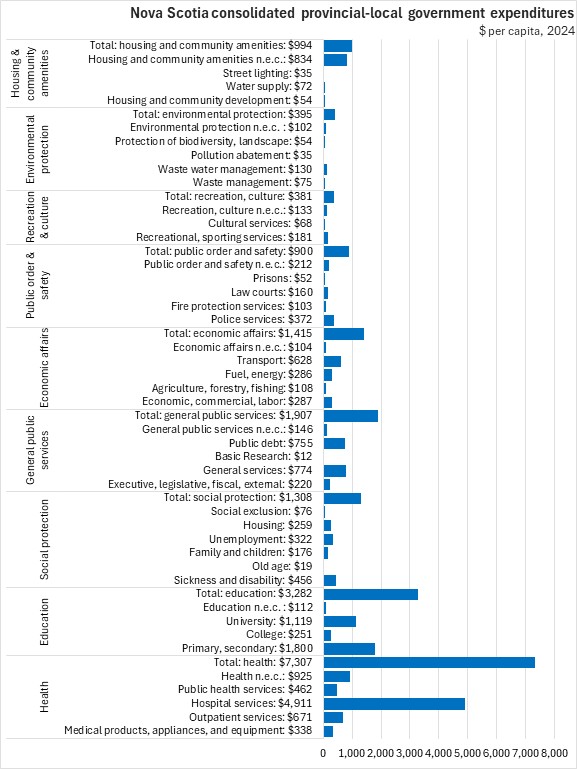
Total per capita expenditures by provincial-local government function added up to $17,889 in Nova Scotia, which was $475 (2.6%) below the national average of $18,364 per capita. Saskatchewan ($20,486 per capita) and Québec ($20,838 per capita) reported the highest expenditures per capita while Ontario ($16,949 per capita) had the lowest.
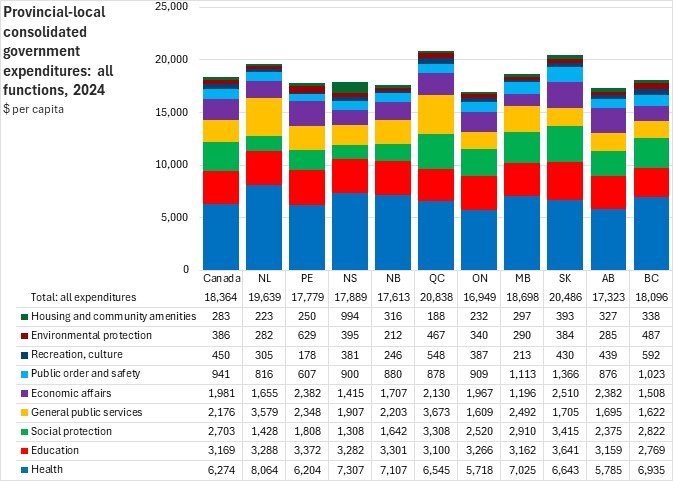

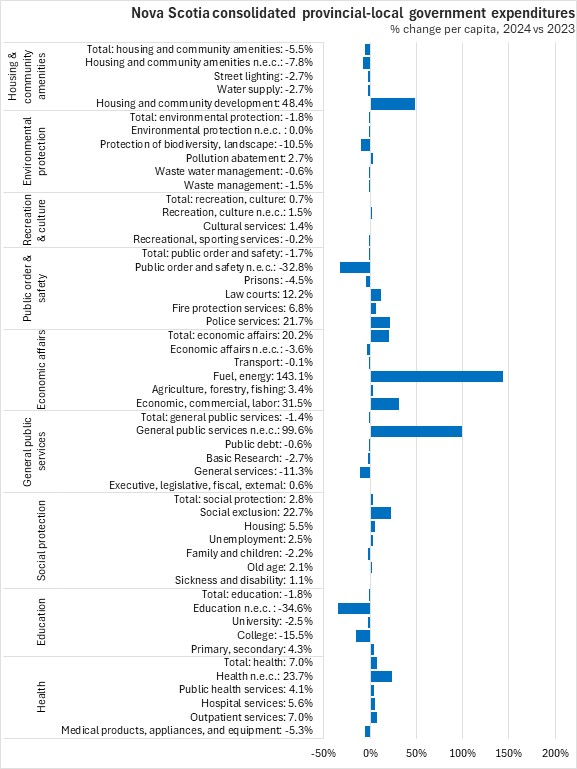
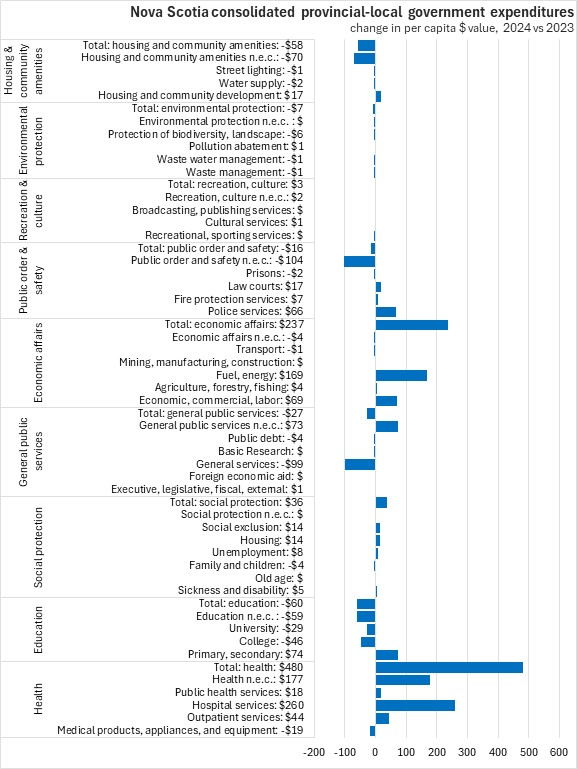
In the last year, Nova Scotia's per capita consolidated expenditures on provincial-local government functions increased by $588 per capita or 3.4%. National expenditures increased by $500 per capita or 2.8%. The fastest growth was in New Brunswick (+4.6% or +$780 per capita). Saskatchewan (-0.3% or -$64 per capita) reported the only decline in per capita provincial-local government spending.
Health care makes up the largest per capita expenditure function in every provincial-local government. Nova Scotia's health expenditures of $7,307 per capita were second highest among provinces after Newfoundland and Labrador ($8,064 per capita). The national average for health expenditures was $6,274 per capita.
Hospitals and outpatient services make up the bulk of health care spending. Nova Scotia's per capita expenditures were above average for hospitals ($4,911 per capita) and public health services ($462 per capita) but lower for outpatient services ($671 per capita - lowest among provinces) and medical equipment and appliances ($338 per capita). The lowest per capita health expenditures were reported in Ontario ($5,718 per capita) and Alberta ($5,785 per capita).
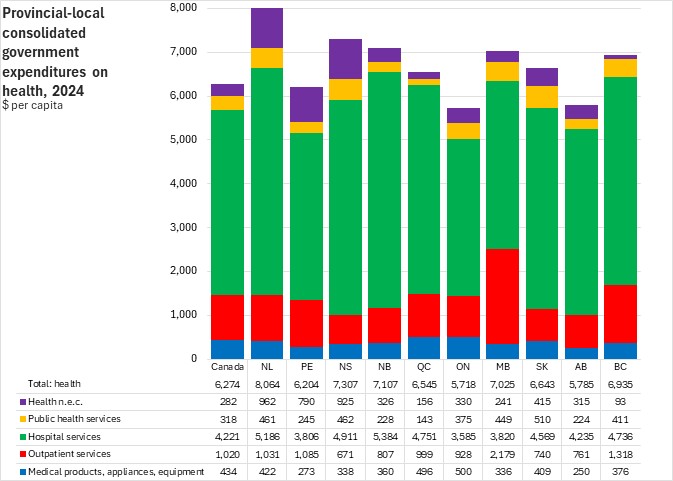
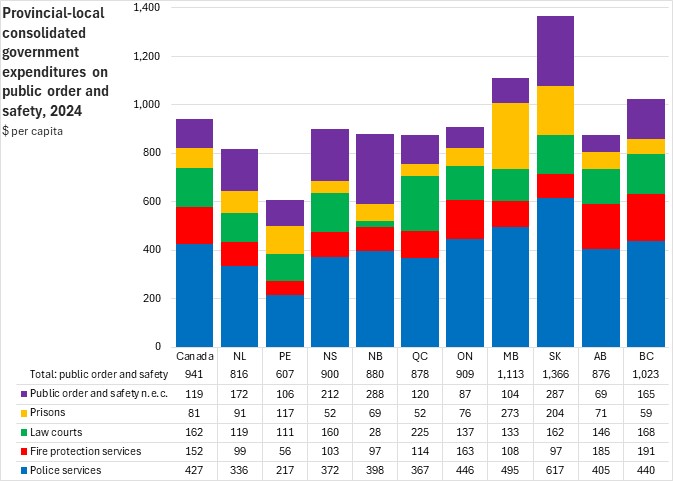
Note: n.e.c. refers to expenditures "not elsewhere classified".
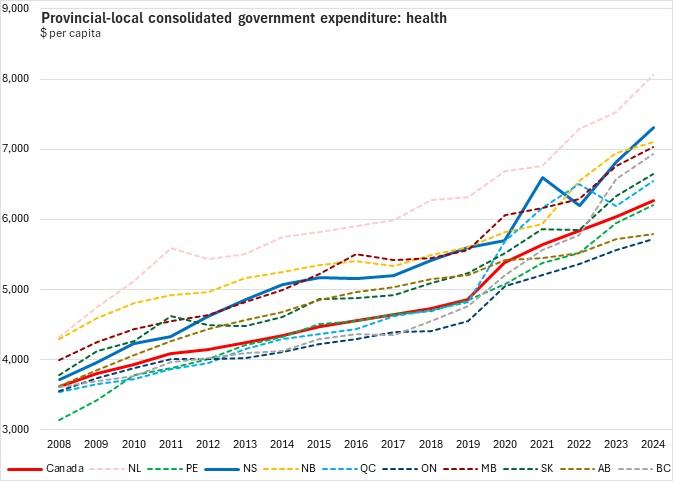
Nova Scotia's per capita health expenditures contracted in 2022 and rebounded over the next two years. In 2024, Nova Scotia's health expenditures per capita grew by 7.0% or $480 per capita. Only Newfoundland and Labrador reported faster growth in per capita health spending (+7.1% or +$534 per capita). Alberta reported the slowest growth in per capita health expenditures (+1.1% or +$62 per capita). National per capita health expenditures were up 3.9% or $235 per capita from 2023 to 2024.
Education is the second largest functional expenditure made by provincial-local governments. Nova Scotia's education spending of $3,282 per capita was above the national average among provincial-local governments ($3,169 per capita).
Nova Scotia's spending on universities ($1,119 per capita) was the highest among provinces while its expenditures for primary/secondary education ($1,800 per capita) were the second lowest among provinces. Per capita education spending was highest in Saskatchewan ($3,641 per capita) and lowest in British Columbia ($2,769 per capita).
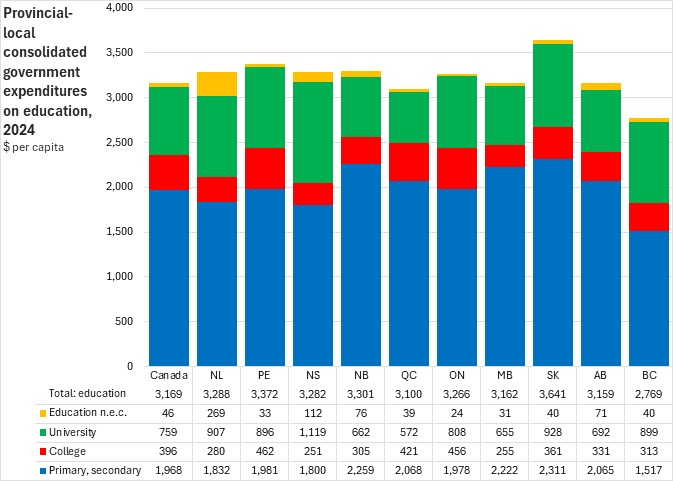
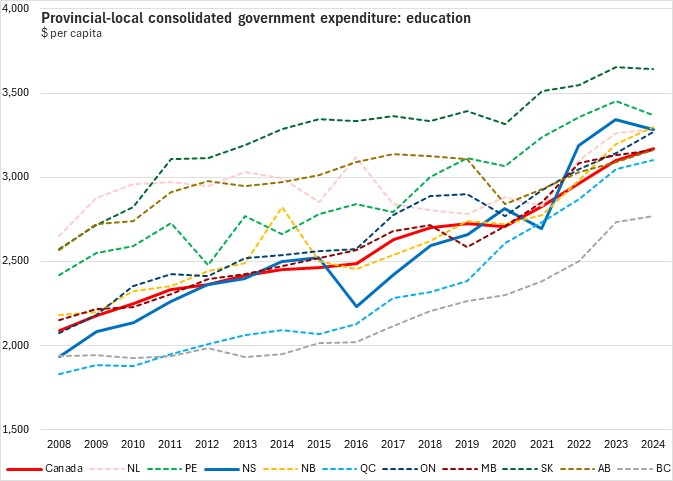
Nova Scotia's per capita education spending decreased by 1.8% or $60 per capita from 2023 to 2024. National education expenditures increased by 2.3% ($72 per capita). Prince Edward Island (-2.4% or -$81 per capita ) reported the steepest decline while Ontario (+3.8% or $120 per capita) reported the fastest per capita rise in education spending.
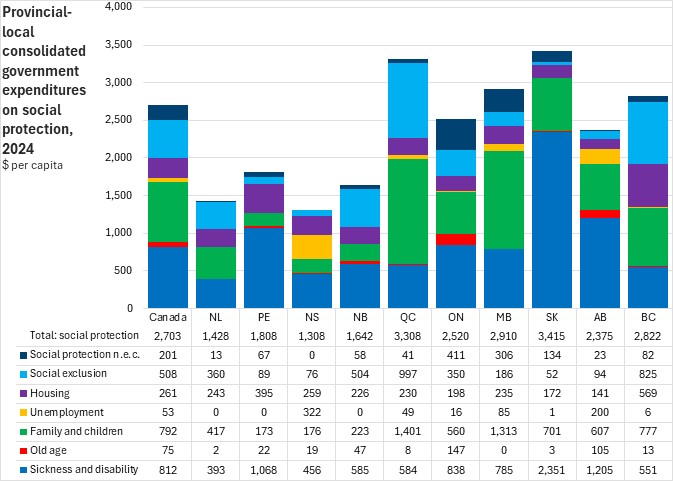
Provincial-local government consolidated expenditures on social protection amounted to $1,308 per capita in Nova Scotia - lowest among provinces. The national average provincial-local expenditure on social protection was $2,703 per capita, but expenditures on social protection exhibit a wide variation across provinces with over $2,100 per capita difference from the lowest spending provincial-local government (Nova Scotia) to the highest (Saskatchewan). Some of this variation is explained by markedly different service levels across provinces. For example, Saskatchewan's higher payments for sickness and disability are attributable to benefits provided under that province's public auto insurance program.
Sickness/disability payments make up the largest portion of social protection expenditures in most jurisdictions, followed in some by children/family services and in others by expenditures to address social exclusion (including funding for low-income earners, refugees and homeless persons).
Nova Scotia's provincial-local expenditures on sickness/disability ($456 per capita), social exclusion ($76 per capita), old age ($19 per capita), housing ($259 per capita) and family/children ($176 per capita) were below the national averages for these functions. Nova Scotia's provincial-local expenditures per capita on unemployment were $322 per capita - highest among provinces.
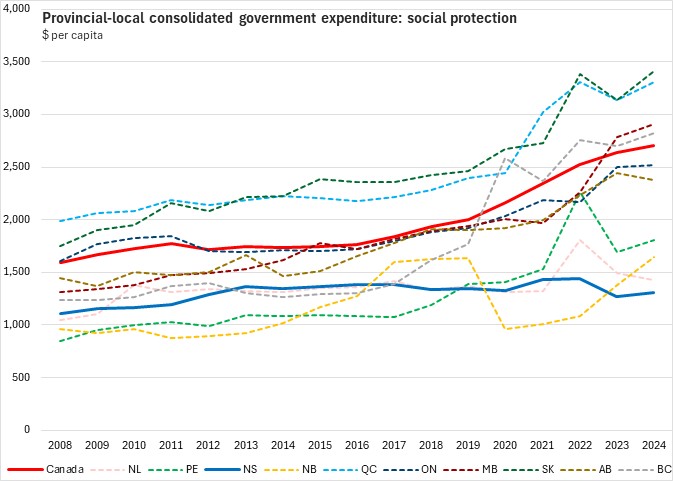
Consolidated provincial-local expenditures on social protection increased by 2.8% (+$36 per capita) in Nova Scotia from 2023 to 2024, but this was only a partial rebound from the reduction in 2023.
National expenditures increased by 2.6% (+$68 per capita) with the largest gains in New Brunswick (+19.0% or +$262 per capita). Newfoundland and Labrador (-4.7% or -$70 per capita) and Alberta (-2.8% or -$69) reported the only declines in per capita expenditures on social protection in 2024.
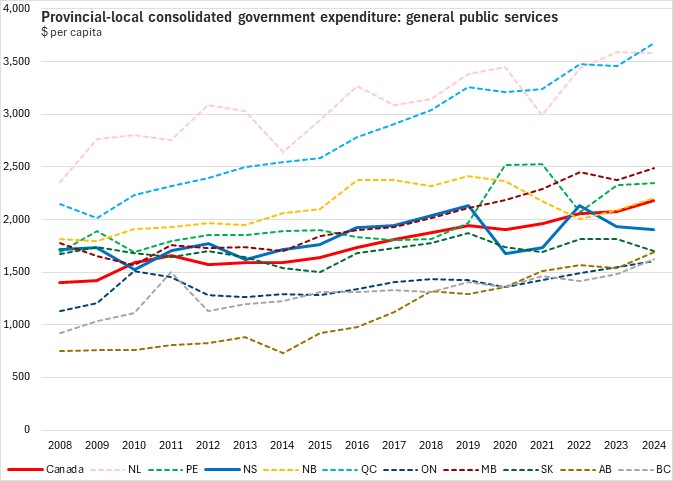
General public service expenditures (consolidated provincial-local) were $1,907 per capita in Nova Scotia, which was below the national average of $2,176 per capita. Nova Scotia's general public service expenditures included $755 per capita in public debt transactions (second lowest among provinces), $774 per capita in general provincial-local government services (above the national average), $220 per capita in executive/legislative/financial/fiscal affairs (second lowest among provinces) and $12 per capita in basic research (highest among provinces). The highest expenditures on general public services were in Newfoundland and Labrador ($3,579 per capita) as well as Québec ($3,673 per capita). The lowest general public service expenditures were in Ontario ($1,609 per capita) and British Columbia ($1,622 per capita).
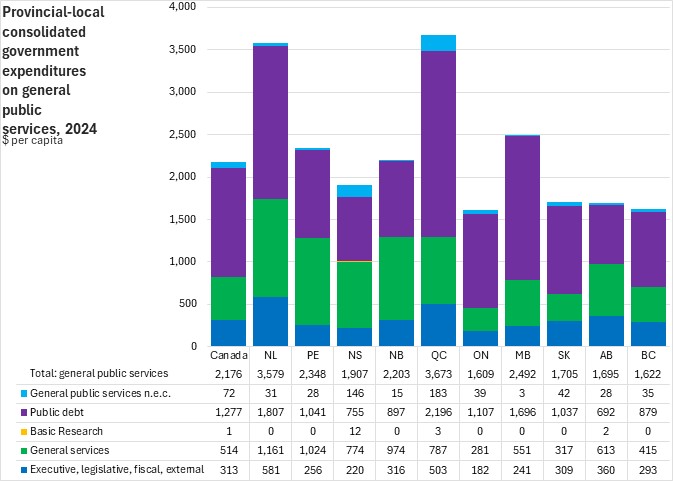
Nova Scotia's consolidated provincial-local per capita expenditures on general public services were down 1.4% or -$27 per capita, a second consecutive year of decline. Nationally, per capita expenditures on general public services were up 5.0% or +$103 per capita with faster gains in Alberta (+9.8% or +$151 per capita), British Columbia (+9.5% or +$141 per cepita) and Québec (+6.1% or +$213 per capita). Saskatchewan reported the steepest decline in provincial-local per capita expenditures on general pubic services (-6.1% or -$110 per capita).
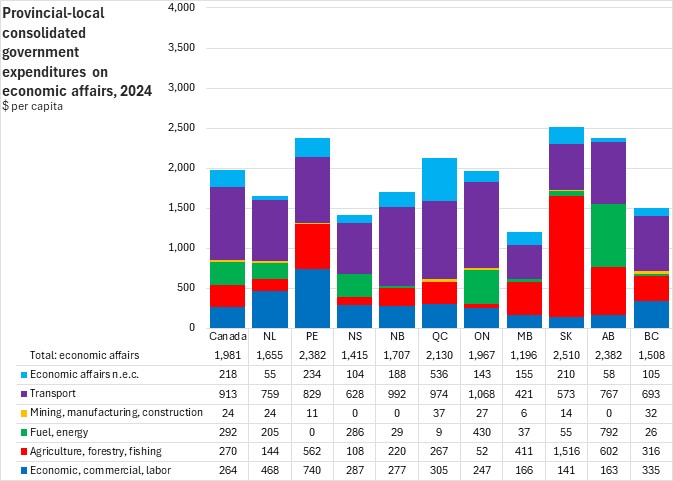
The economic affairs functional category includes expenditures in a wide range of activities. Transportation is the largest provincial-local exepnditure on economic affairs across Canada, but it is not the largest expenditure in Saskatchewan where supports for agriculture, forestry, fishing, hunting and were larger, or Alberta, where supports for fuel/energy was larger.
Overall per capita spending on economic affairs in Nova Scotia was $1,415 - second lowest among provinces (ahead of Manitoba). Nova Scotia's expenditures on transportation ($628 per capita) were the third lowest among provinces. The highest expenditures on economic affairs were in Saskatchewan ($2,510 per capita), with large agriculture/forestry supports. The national average spending on economic affairs was $1,981 in 2024.
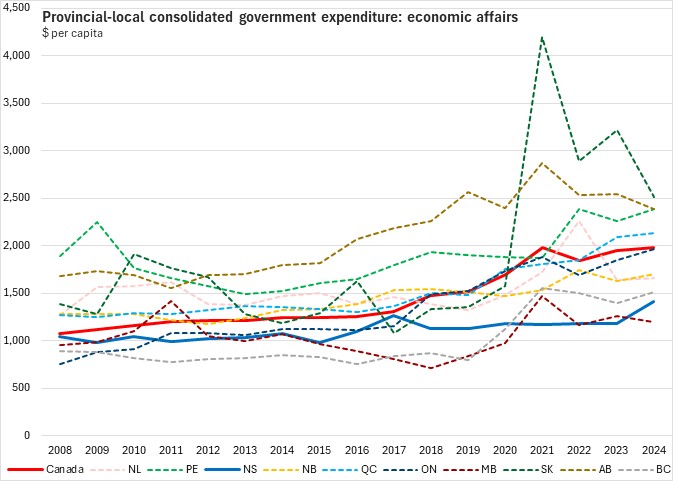
In 2024, Nova Scotia's consolidated provincial-local expenditures on economic affairs increased by 20.2% or +$237 per capita - the largest gain among provinces.
Across Canada, provincial-local consolidated expenditures on economic affairs were up 1.8% or +$35 per capita. Saskatchewan reported the steepest decline (-22.1% or -$710 per capita) in provincial-local per capita expenditures on economic affairs.
Expenditures on public order and safety were $941 per capita in Canada and $900 per capita in Nova Scotia in 2024. Police services ($372 per capita - below the national average) made up the largest part of these expenditures in Nova Scotia, followed by law courts ($160 per capita - just below the national average) and fire protection services ($103 per capita - below the national average). Nova Scotia's expenditures on prisons ($52 per capita) were tied for the lowest among provinces with Québec. The highest expenditures on public order and safety were reported in Saskatchewan ($1,366 per capita). The lowest expenditures on public safety were in Prince Edward Island ($607 per capita).
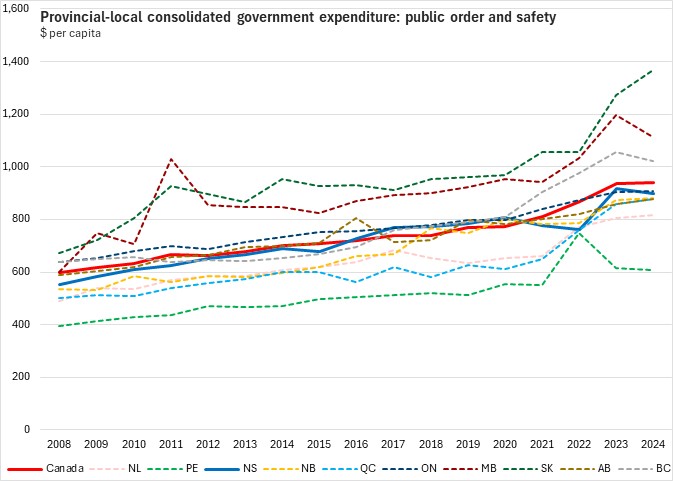
Nova Scotia's consolidated provincial-local expenditures on public order and safety decreased by 1.7% or -$16 per capita from 2023 to 2024, after a sharp rise in 2023. Across Canada, public order and safety expenditures were up 0.4% or +$3 per capita. The largest increases in public order and safety spending were reported in Saskatchewan (+7.5% or +$96 per capita). Manitoba reported the steepest per capita decline in public order and safety spending (-7.0% or -$84 per capita).
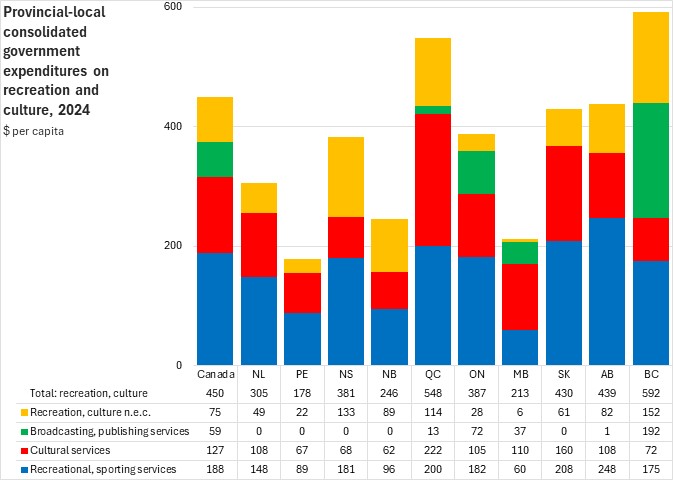
Spending on recreation and cultural services was $450 per capita across Canada and $381 per capita in Nova Scotia. Recreation and culture spending was higher in British Columbia ($592 per capita), which has a larger expenditure on broadcasting/publishing services. Prince Edward Island ($178 per capita) had the lowest spending on recreation and cultural services.
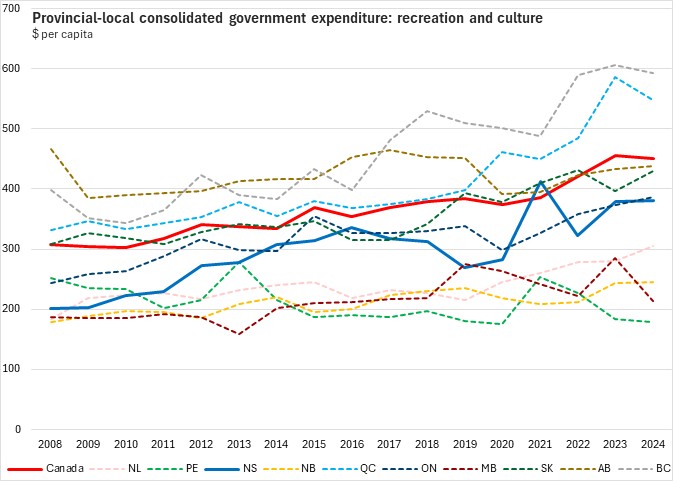
National consolidated provincial-local spending on recreation and culture was down 1.3% or -$6 per capita from 2023 to 2024. Nova Scotia's expenditures on recreation and culture increased by 0.7% or +$3 per capita. The largest decline was reported in Manitoba (-25.4% or -$72 per capita) while Newfoundland and Labrador (+9.0% or +$25 per capita) and Saskatchewan (+8.5% or +$34 per capita) reported the largest increases.
National consolidated provincial-local spending on environmental protection was $386 per capita in 2024. Nova Scotia's expenditures on environmental protection were $395 per capita.
Waste management and waste water management typically make up the largest portions of national expenditures on environmental protection. Prince Edward Island reported the highest per capita expenditures on environmental protection ($629 per capita) with notably higher spending on pollution abatement. New Brunswick reported the lowest expenditures per capita on environmental protection ($212 per capita).
Nova Scotia's expenditures on protection of biodiversity ($54 per capita) and waste water management ($130 per capita) were above national averages. Nova Scotia's consolidated provincial-local spending on pollution abatement ($35 per capita) and waste management ($75 per capita) were below national averages.
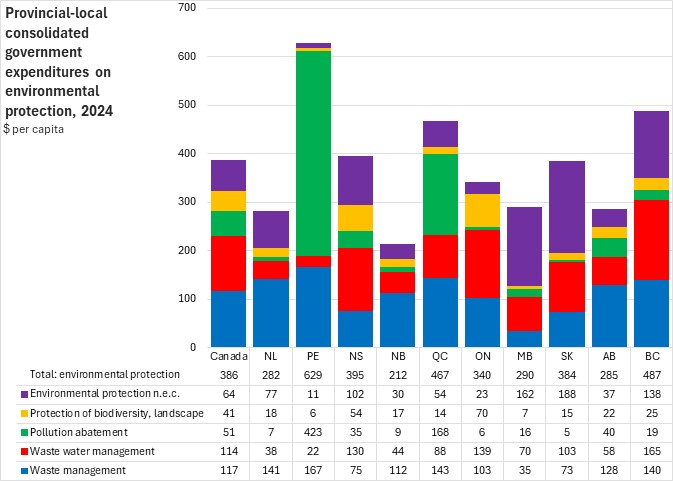
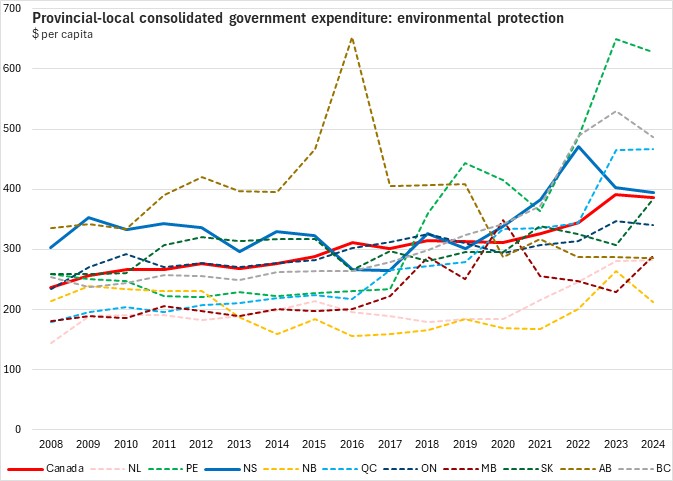
From 2023 to 2024, Nova Scotia reported a 1.8% (-$7 per capita) decline in consolidated provincial-local expenditures on environmental protection while national expenditures declined by 1.5% or $6 per capita. Manitoba (+26.0% or +$60 per capita) and Saskatchewan (+24.9% or +$76 per capita), reported the fastest growth in expenditures on environmental protection. New Brunswick (-19.5% or -$51 per capita) reported the steepest decline.
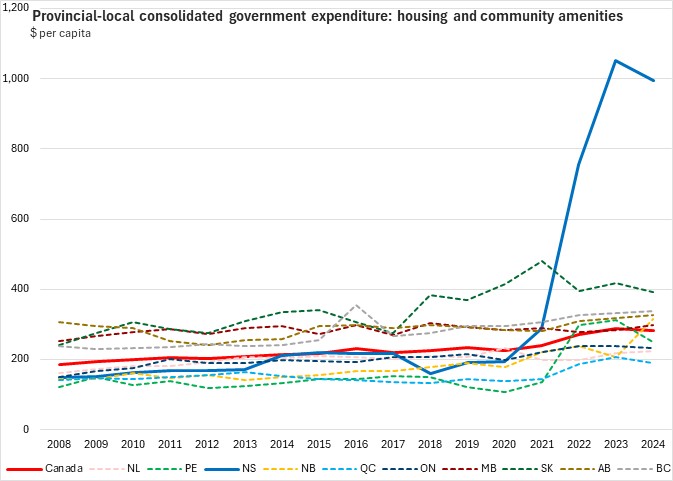
Consolidated provincial-local spending on housing and community amenities amounted to $283 per capita nationally and $994 per capita in Nova Scotia. For the third consecutive year, Nova Scotia's 2024 expenditures on housing and community amenities featured unusually large spending in unclassified activities ($834 per capita). Provision of water supply typically makes up the largest part of housing/community amenity spending in most provinces. Nova Scotia's expenditures on water supply ($72 per capita) and housing/community development ($54 per capita) were below national averages. Nova Scotia made the highest expenditures on street lighting among provinces ($35 per capita).
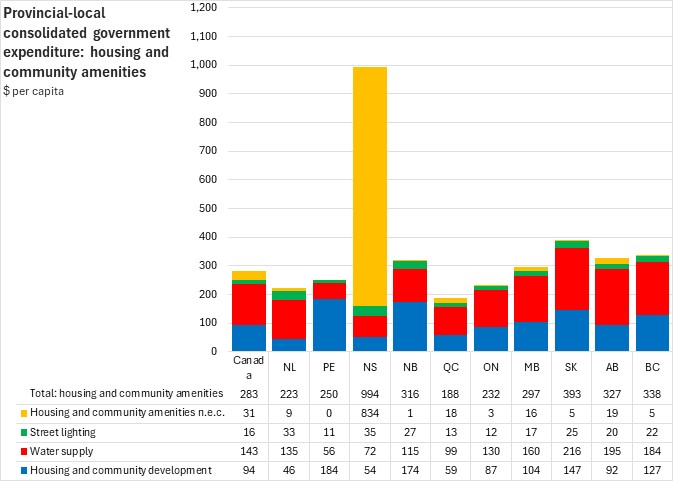
Nova Scotia reported a decline of 5.5% (-$58 per capita) in consolidated provincial-local expenditures per capita on housing and community amenities, following sharp increases in prior years. National expenditures on housing and community amenities were down 1.4% or -$4 per capita. New Brunswick reported the largest increase (+53.5% or +$110 per capita).
Nova Scotia's largest 2024 consolidated provincial-local expenditures were in: hospital services, primary/secondary education, universities, general services, public debt and unclassified housing/community amenities.
From 2023 to 2024, the largest per capita increases in consolidated provincial-local expenditures were reported in hospital services, unclassified health and fuel/energy. However, in percentage terms growth was fastest for unclassified general public services and fuel/energy (both starting from relatively small bases).
The largest per capita expenditure reductions were reported in general public services and unclassified public order/safety expenditures. Unclassified education expenditures reported the largest percentage decline.
Notes: Details on defence spending are provided only at the Federal level. Annual data correspond to the end of the fiscal year closest to December 31. For example, data for the fiscal year ending on March 31, 2024 (fiscal year 2023-24) are reported as the 2024 reference year. Per capita expenditures are calculated using the population as of July 1 nearest the end of the fiscal year; for fiscal year 2023-24, per capita expenditures are calculated using the population as of July 1, 2024.
These data are based on the international government financial statistical standard and, as such, may differ in their presentation from similar concepts reported in Public Accounts and other financial statements. Statistics Canada's data allows for comparability across jurisdictions.
Source: Statistics Canada. Table 10-10-0005-01 Canadian Classification of Functions of Government (CCOFOG) by consolidated government component (x 1,000,000), Table 17-10-0005-01 Population estimates on July 1st, by age and sex
<--- Return to Archive