The Economics and Statistics Division maintains archives of previous publications for accountability purposes, but makes no updates to keep these documents current with the latest data revisions from Statistics Canada. As a result, information in older documents may not be accurate. Please exercise caution when referring to older documents. For the latest information and historical data, please contact the individual listed to the right.
<--- Return to Archive
For additional information relating to this article, please contact:
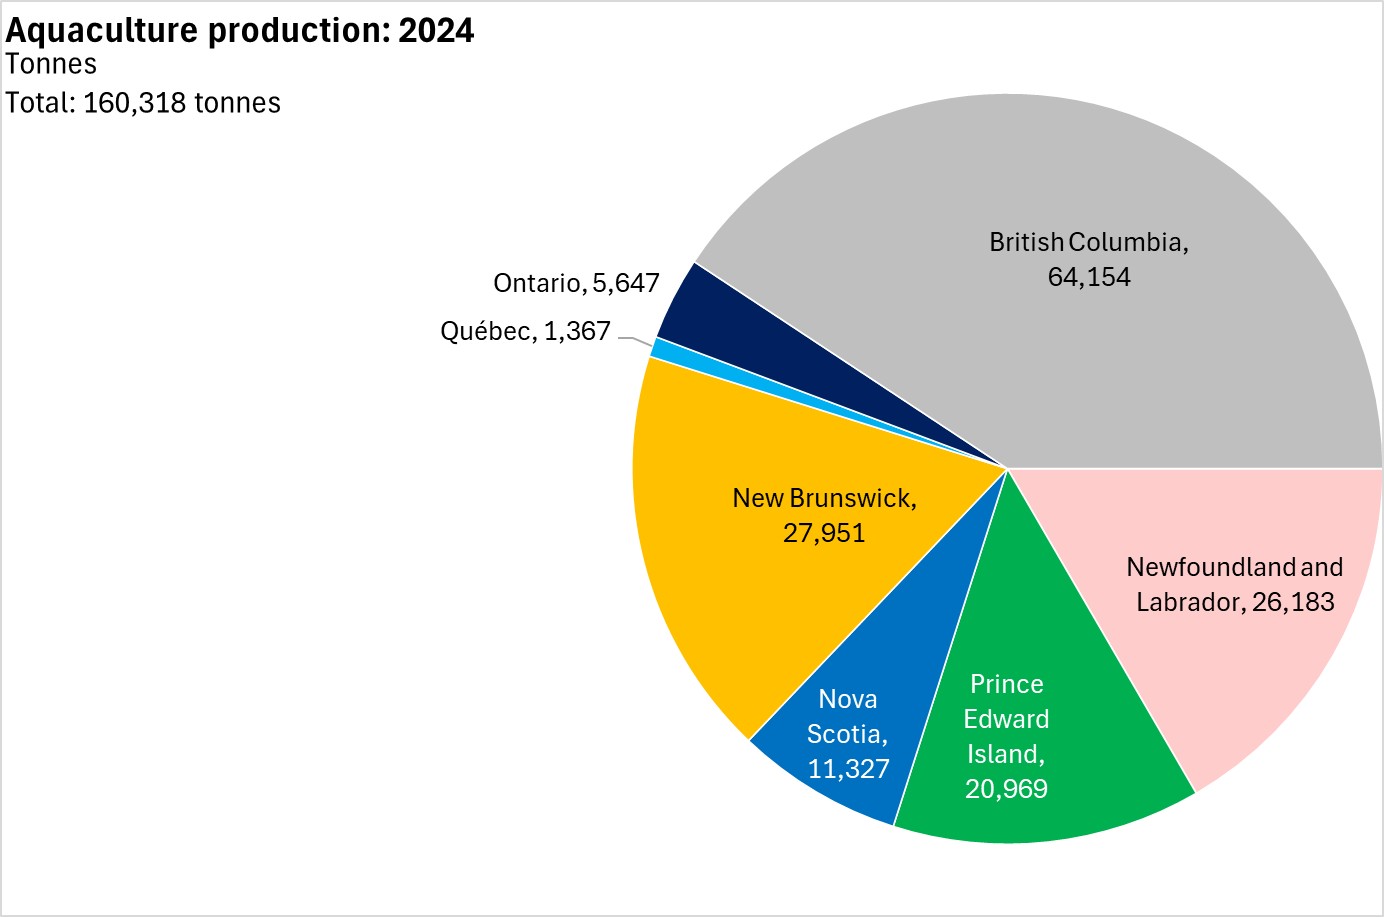
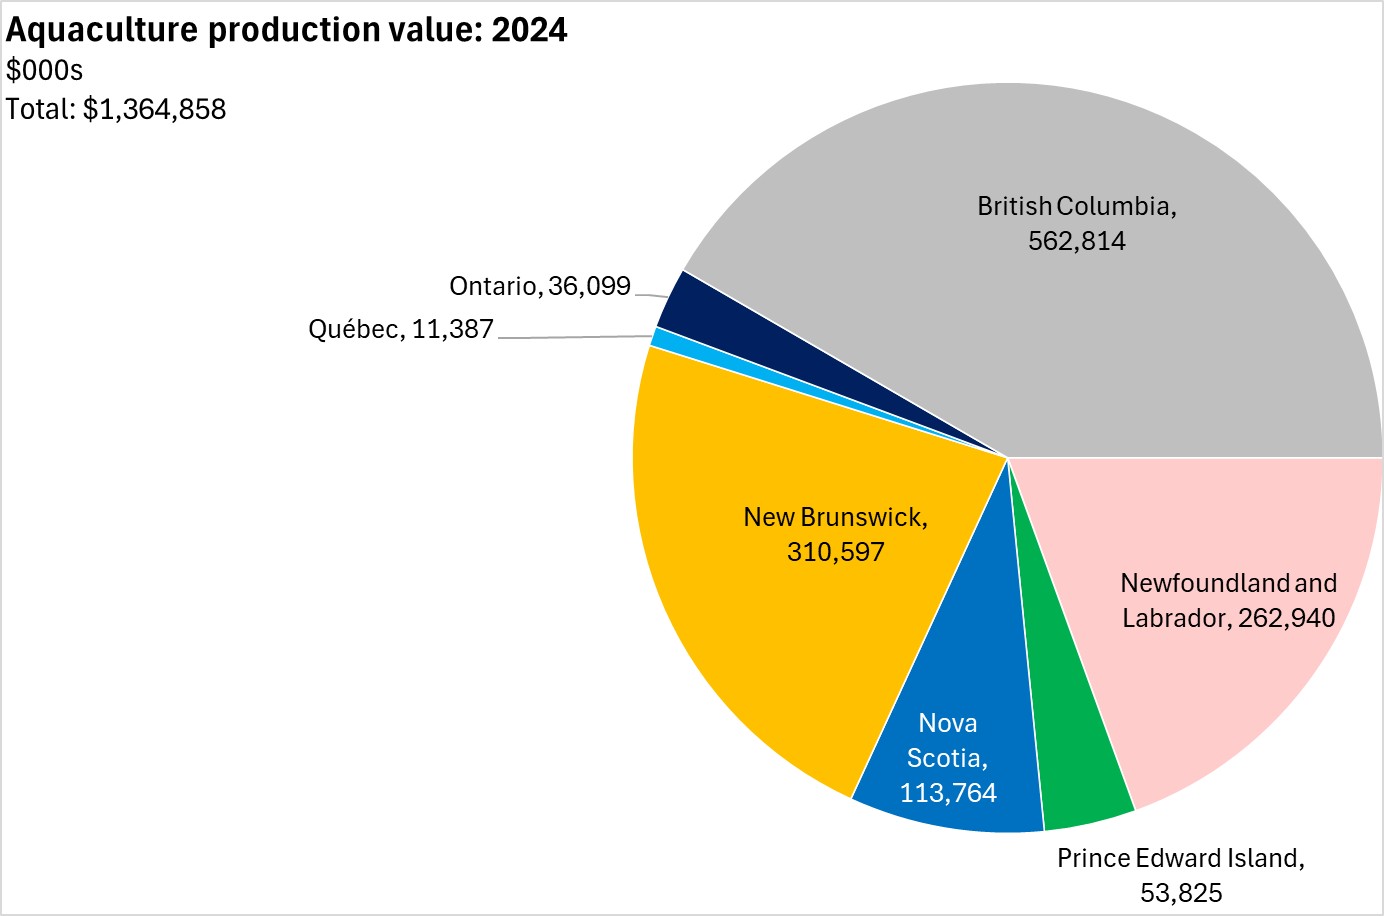
December 01, 2025AQUACULTURE, 2024-PRELIMINARY Canada's aquaculture industry produced 160,318 tonnes of finfish and shellfish products in 2024 (including restocking), with a value of $1.36 billion.
Note: Production and value estimates for finfish and shellfish farmed in Nova Scotia in 2024 are preliminary and will be updated when final estimates are available (this note was missing from an earlier version). Data for aquaculture production in Alberta, Saskatchewan, and Manitoba was suppressed. Data for aquaculture production in Alberta, Saskatchewan, and Manitoba was suppressed.
British Columbia is Canada's largest aquaculture producing province, accounting for 40.0% of production volume and 41.2% of production value in 2024.
Nova Scotia's aquaculture output of 11,327 tonnes was 7.1% of national output while the province's aquaculture production value of $113.8 million represented 8.3% of the national total.
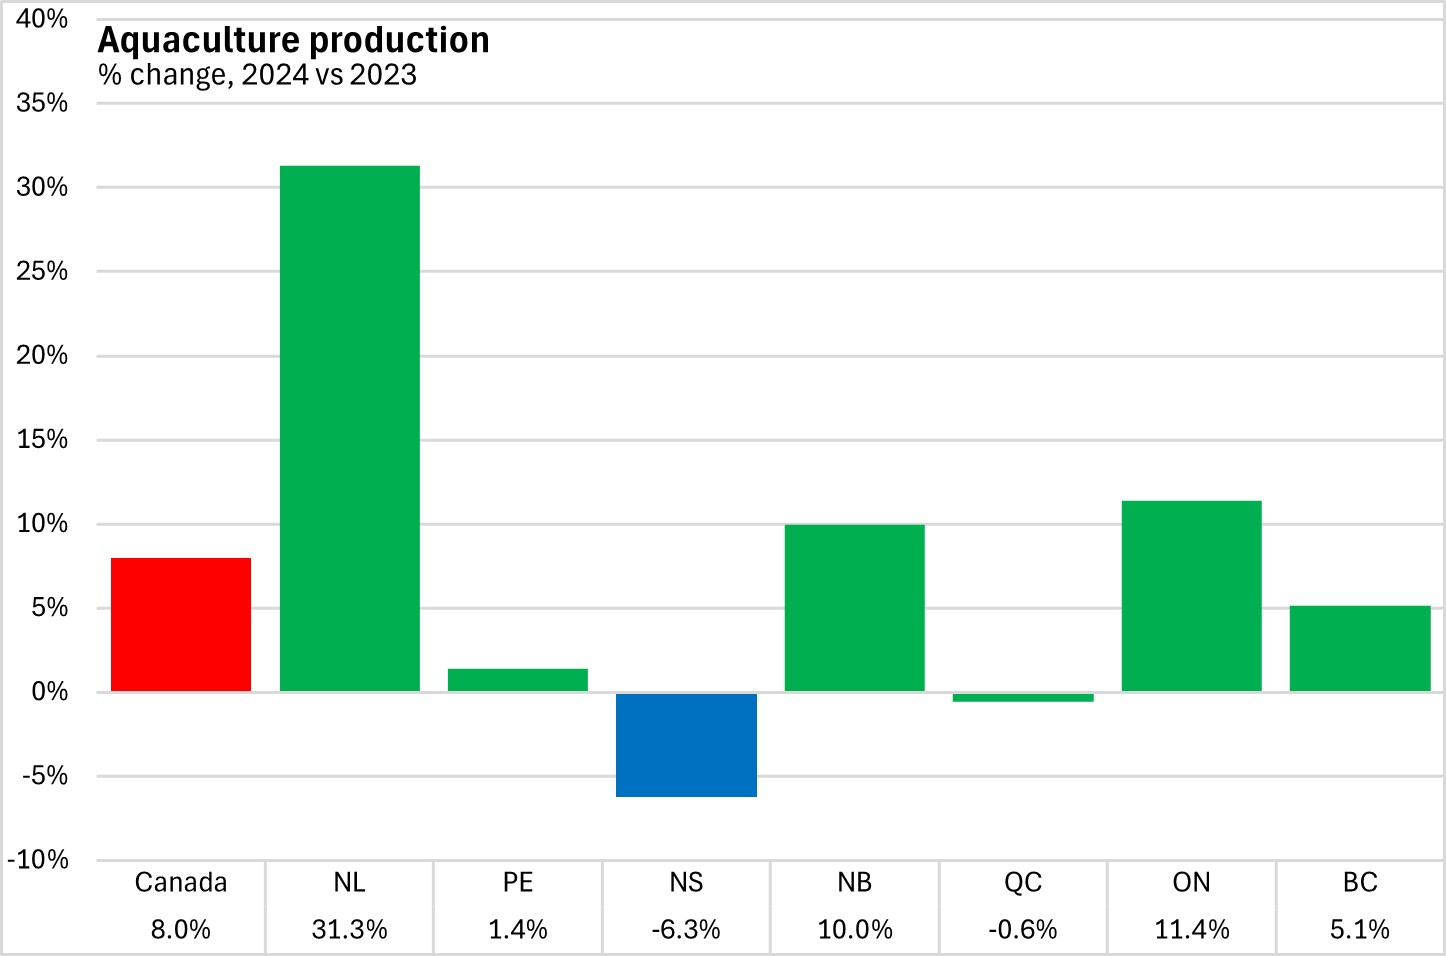
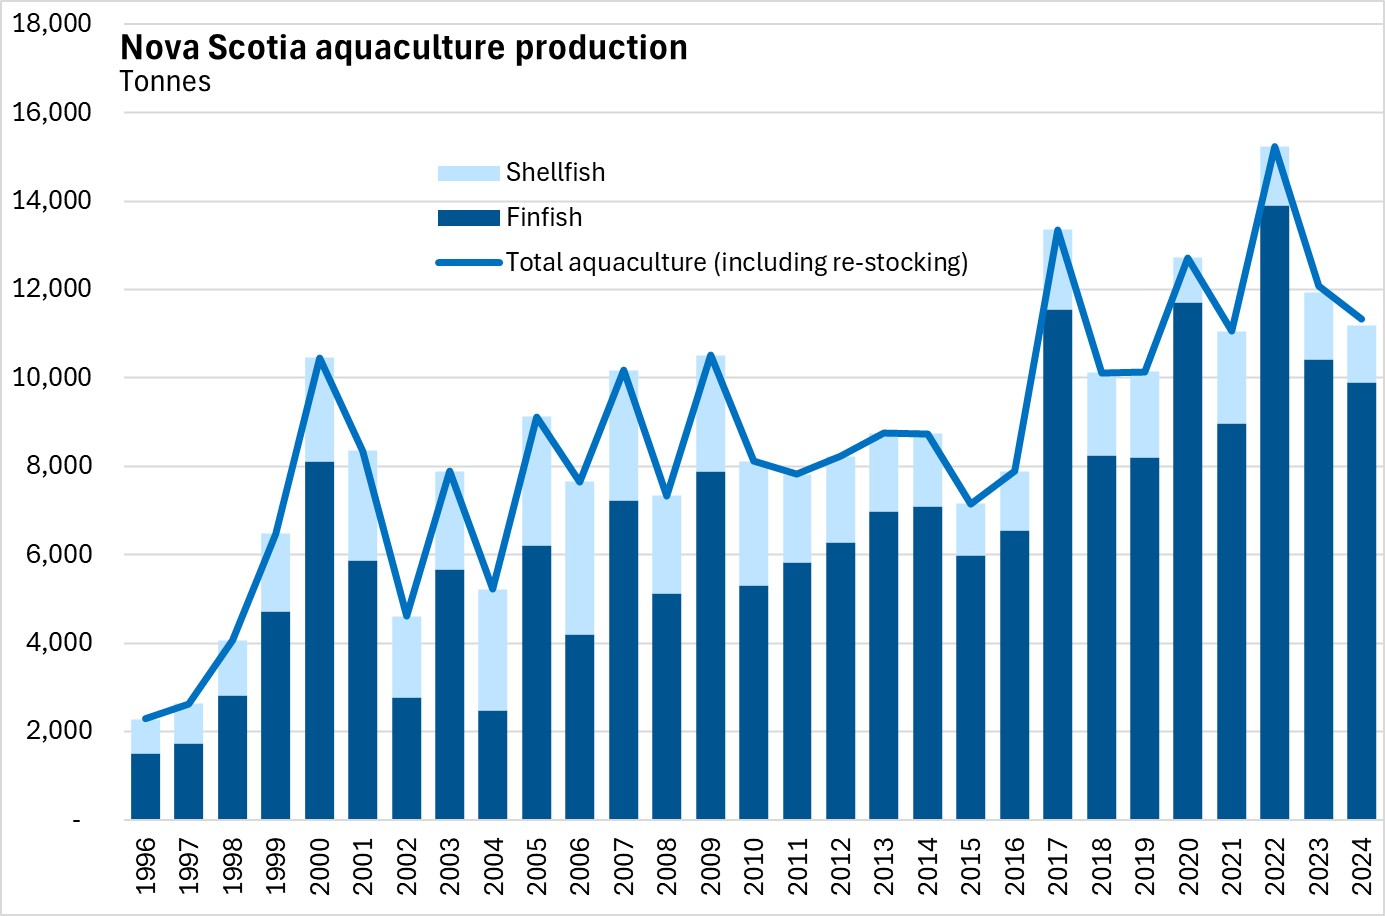
National aquaculture output tonnage increased by 8.0% from 2023 to 2024. Newfoundland and Labrador reported the largest percentage gain in aquaculture production tonnage at +31.3% while Nova Scotia reported the largest decline at -6.3%.
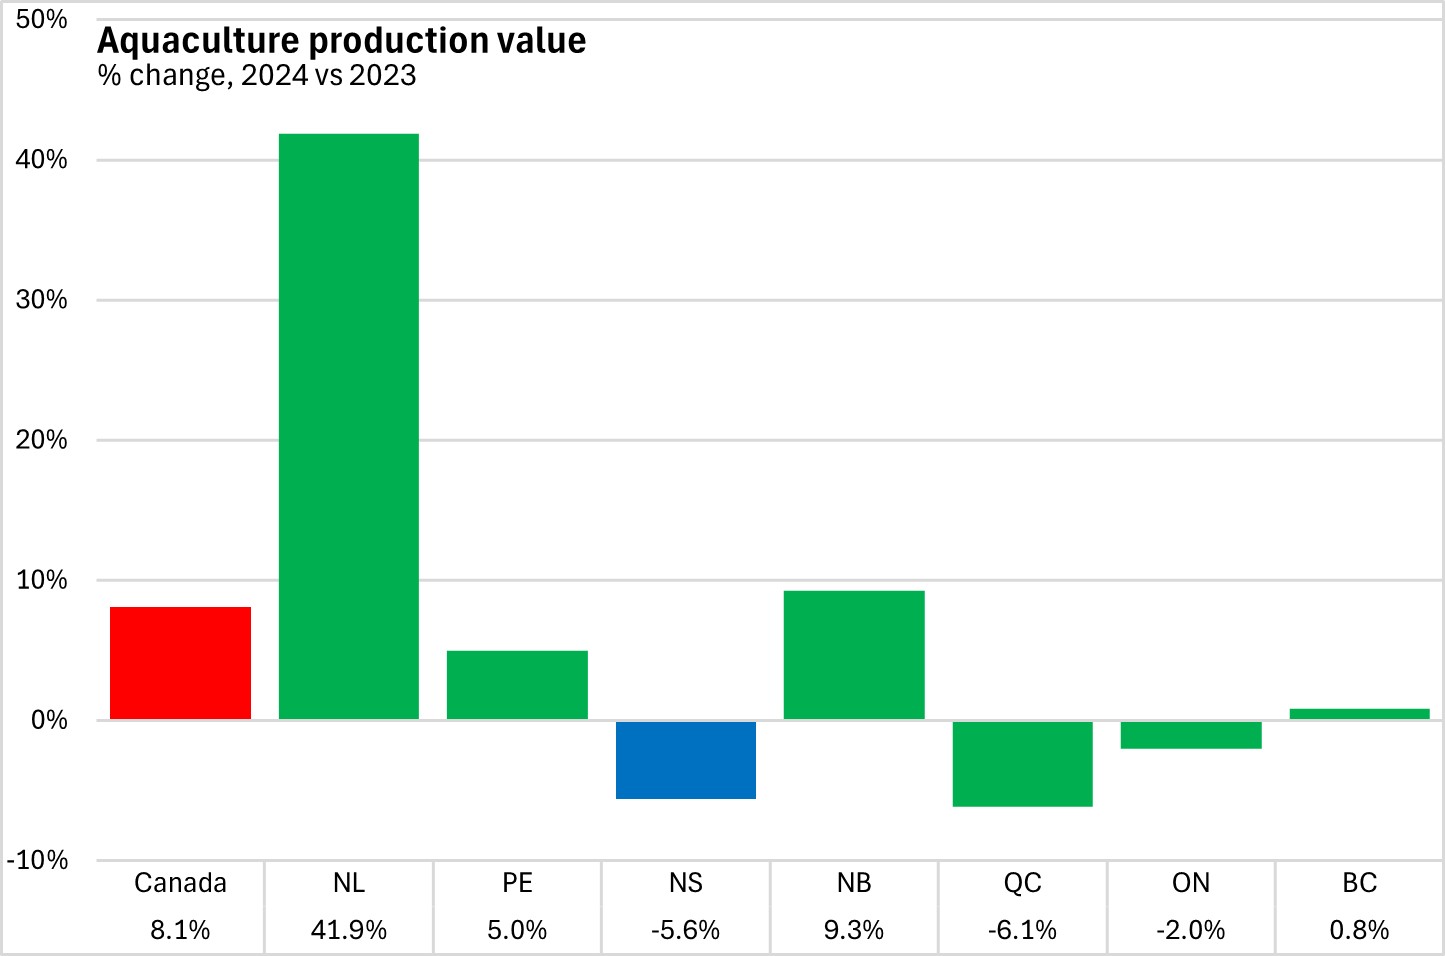
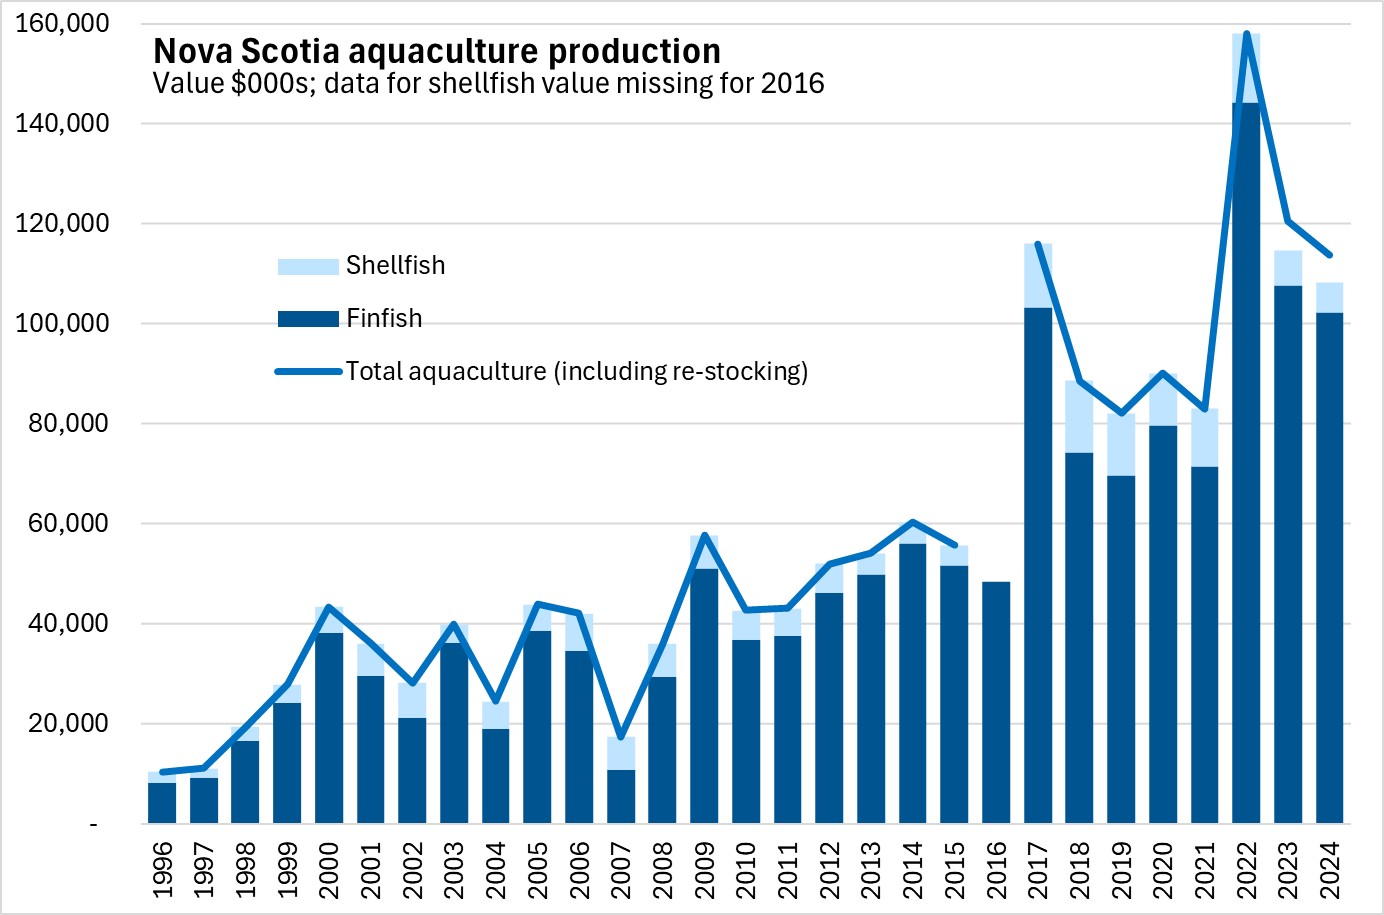
Nova Scotia's aquaculture output value fell by 5.6% to $113.8 million from 2023 to 2024. National aquaculture output value was up (+8.1%) with notable gain in Newfoundland and Labrador and with the most decline in Québec.
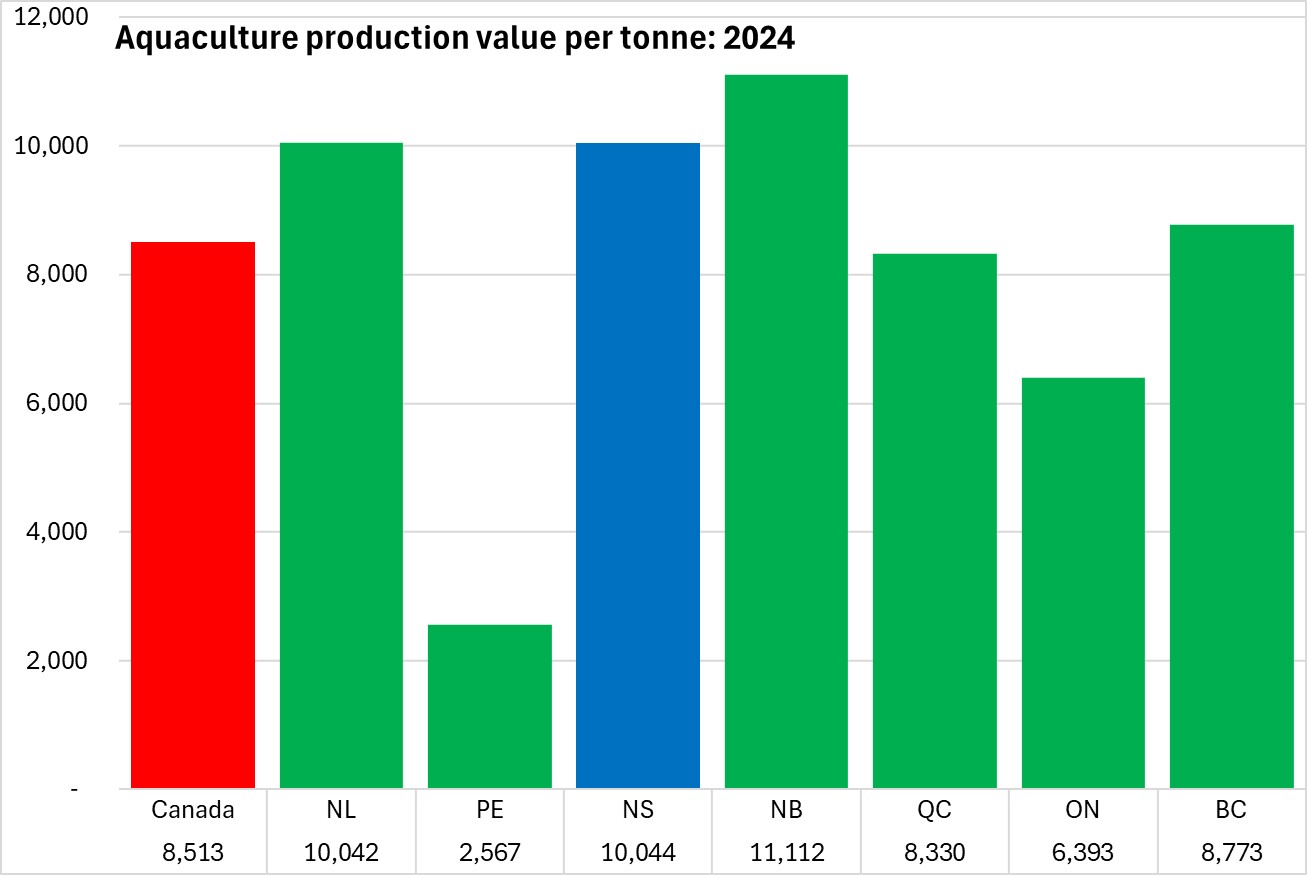
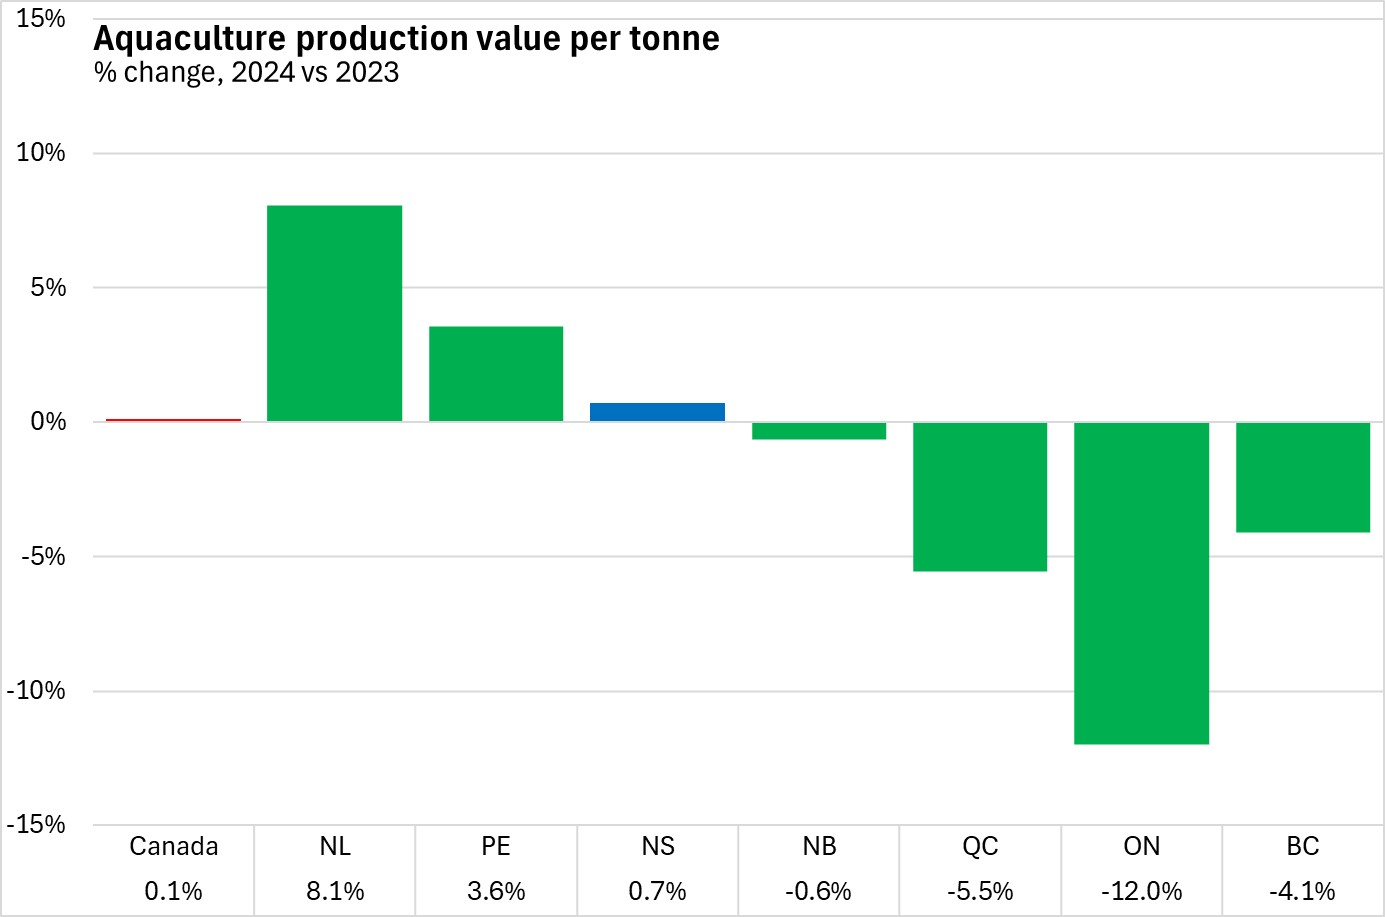
In 2024, the average unit value of Nova Scotia's aquaculture products was above the national average at $10,044 per tonne - the second highest value among provinces after New Brunswick. This was up 0.7% from value per tonne in 2023.
National aquaculture value per tonne was $8,513 (+0.1% from 2023) with the lowest value in Prince Edward Island. Differences across provinces reflects in part differences in the relative amounts of finfish and shellfish produced in each province, with finfish generally having higher unit values.
Nova Scotia's aquaculture output volume as well as production value declined in 2023 and 2024 after a sizeable spike in 2022.
Value Added
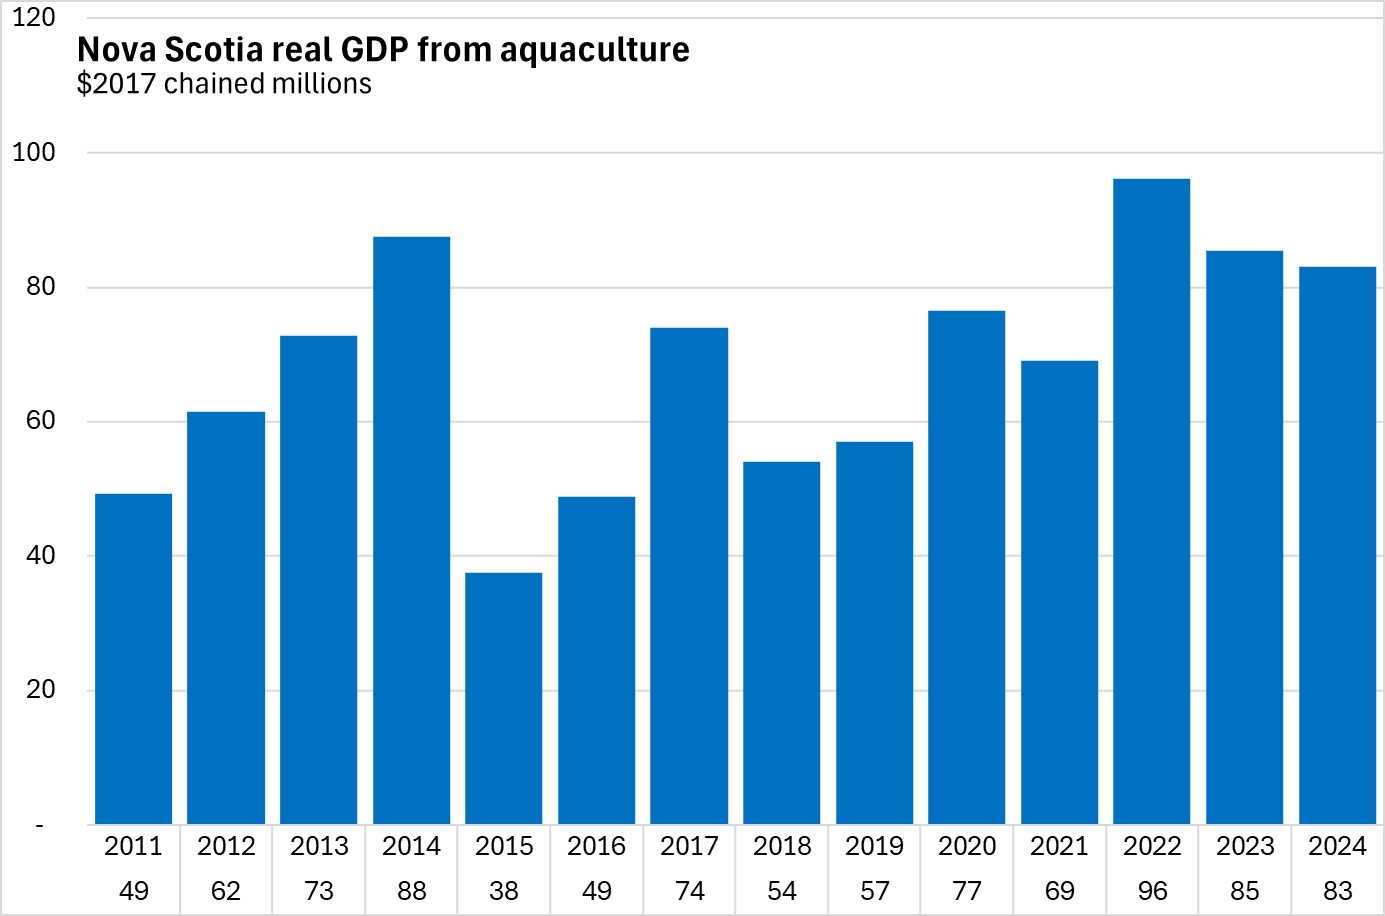
Real GDP in Nova Scotia's aquaculture industry fell by 2.8% in 2024, one of five provinces to report a decline (along with British Columbia, Alberta, Saskatchewan, and Québec).
Aquaculture real GDP was up in: Newfoundland and Labrador, Prince Edward Island, New Brunswick, and Ontario. There was no change to aquaculture real GDP in Manitoba. British Columbia, New Brunswick and Nova Scotia generate the largest amount of real GDP from aquaculture.
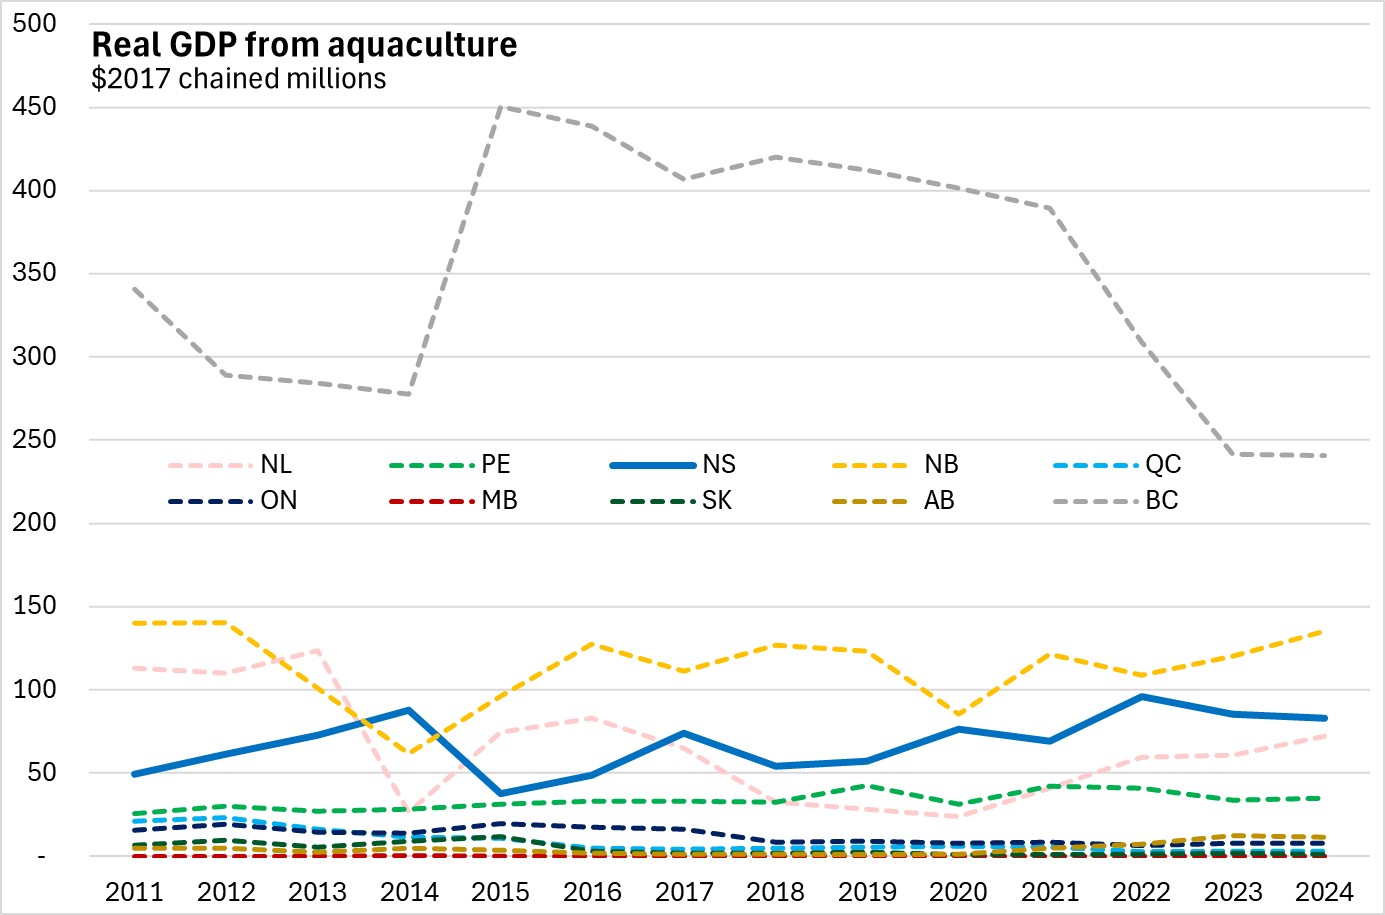
Between 2011 and 2024, Nova Scotia's aquaculture real GDP has grown at an average annual pace of 4.1% per year.
Source: Statistics Canada. Table 32-10-0107-01 Aquaculture, production and value; Table 36-10-0711-01 Gross domestic product (GDP) at basic prices, by industry, provinces and territories (x 1,000,000)
<--- Return to Archive