The Economics and Statistics Division maintains archives of previous publications for accountability purposes, but makes no updates to keep these documents current with the latest data revisions from Statistics Canada. As a result, information in older documents may not be accurate. Please exercise caution when referring to older documents. For the latest information and historical data, please contact the individual listed to the right.
<--- Return to Archive
For additional information relating to this article, please contact:
December 12, 2025CANADIAN INCOME SURVEY: POVERTY, 2023 BASKET REVISION AND 2024 PROVISIONAL Statistics Canada has recently issues two updates to poverty measurements from the Canadian Income Survey.
1. Updating the Market Basket on which the Market Basket Measure is assessed to 2023. There were minor changes to shelter, clothing, food and transporation estimation methods while a new communication services component was added (removing this item from 'other'). Likewise, there were only minor changes to housing tenure and medical expense adjustments. For 2023, Nova Scotia's MBM thresholds were revised down from the 2018 base to the 2023 base with reductions in all community sizes.
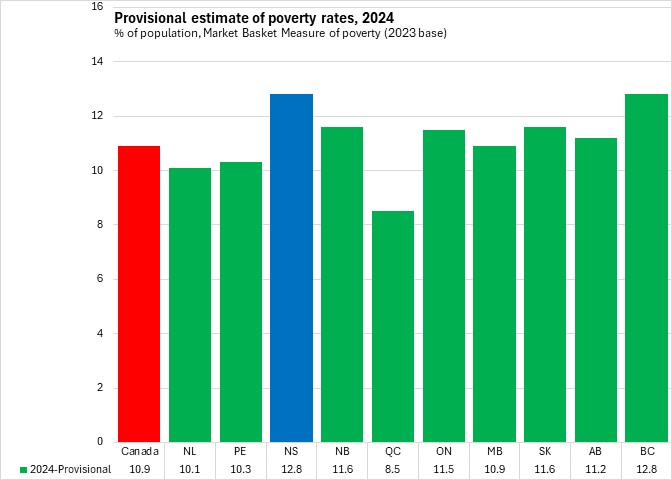
2. Provisional estimates for 2024. This method uses a proxy of disposable income derived from the previous year's sample and updated tax slips from the current year.
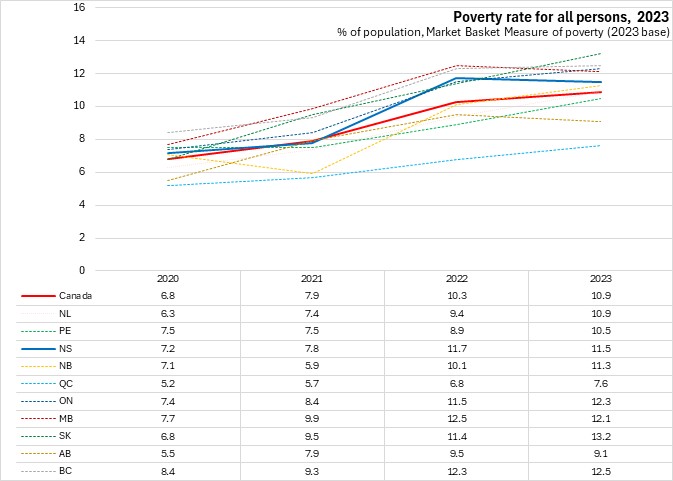
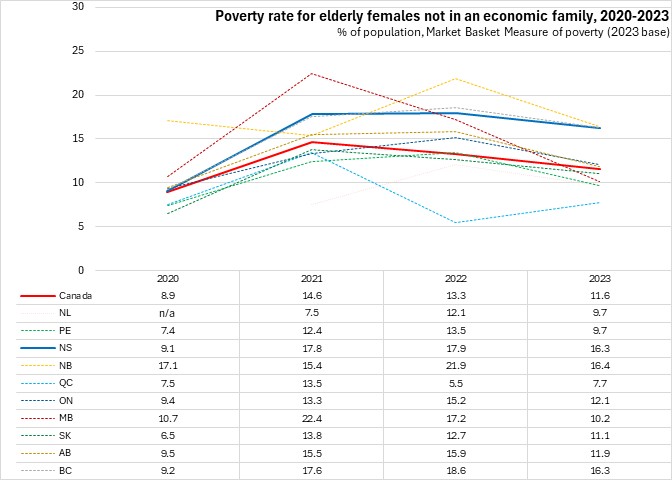
Note that there were significant government income supports during the COVID-19 pandemic which drove a large decline in the poverty rates for 2020 and 2021. These supports were largely withdrawn by 2022 while there was a significant acceleration in inflation that persisted into 2023.
Poverty Rates
The Market Basket Measure (MBM) estimates the share of the population that do not have sufficient income for a reference family to afford the cost of a basket of essential goods and services. The MBM threshold is estimated for specific communities. In Nova Scotia, there are separate thresholds for MBM in Halifax, Cape Breton, communities with populations between 30,000 and 100,000, communities with populations under 30,000 and rural areas. The recent Market Basket update to 2023 provides historical estimates back to 2020. These data are collected through the Canadian Income Survey. Indicators of poverty and income for smaller sub-components of the population may be of limited data quality.
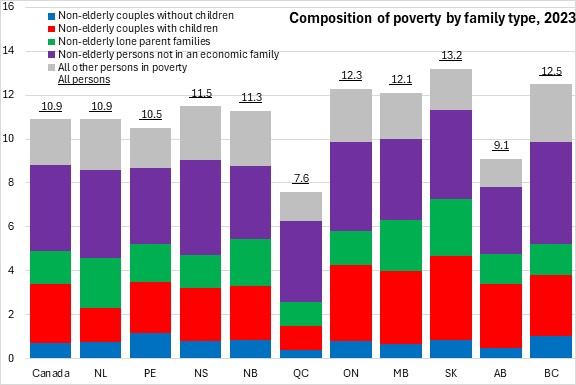
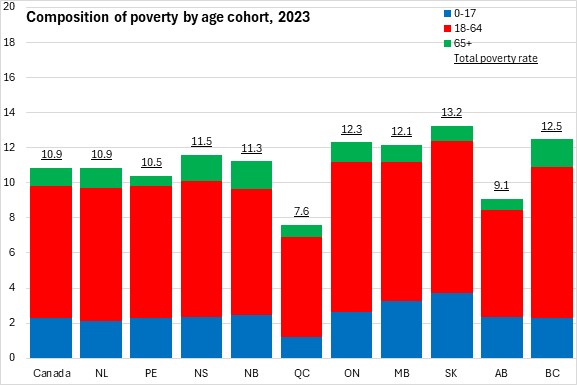
Based on the revised 2023-base market basket, the poverty rate was 11.5% in Nova Scotia in 2023. This was above the national average of 10.9%. Saskatchewan had the highest poverty rate among provinces. The lowest poverty rate was in Québec.
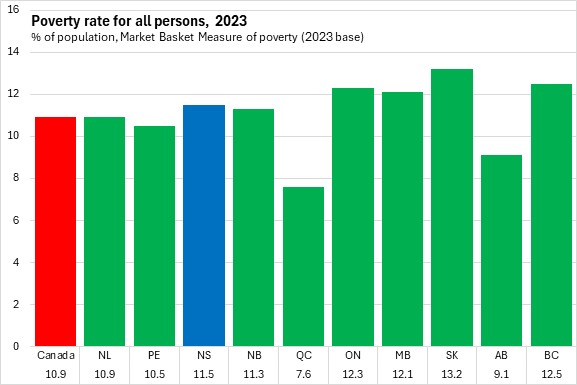
Poverty rates increased in seven provinces from 2022 to 2023 with only Nova Scotia, Manitoba and Alberta reporting declines. Saskatchewan reported the steepest increase in poverty rate from 2022 to 2023.
Provisional estimates for 2024 indicate that the poverty rate was 12.5% in Nova Scotia - tied with British Columbia for highest among provinces. The provisional national poverty rate was 10.9% in 2024 with the lowest rate in Québec. Note that these provisional rates cannot be compared with prior estimates.
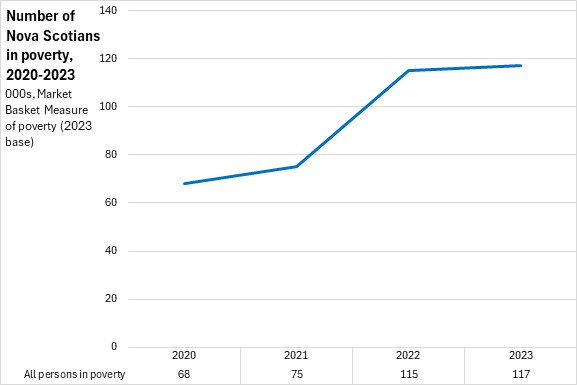
The number of Nova Scotians in poverty rose to 117,000 in 2023 - up 2,000 from the previous year (using the 2023-base for the market basket).
Family structure is a significant correlate for poverty rates. The largest number of families are non-elderly couples with children, followed by elderly couple families, non-elderly persons not in an economic family and other non-elderly families.
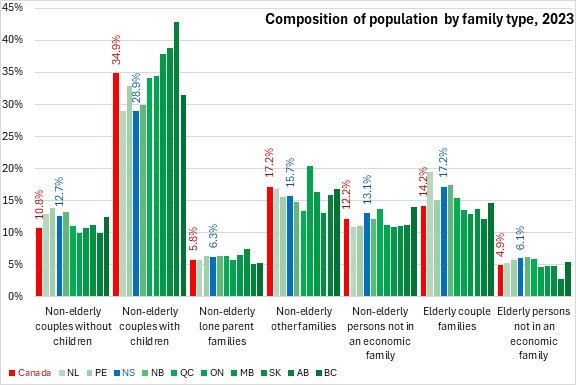
Non-elderly persons not in an economic family are the largest single cohort among those living in poverty in every province.
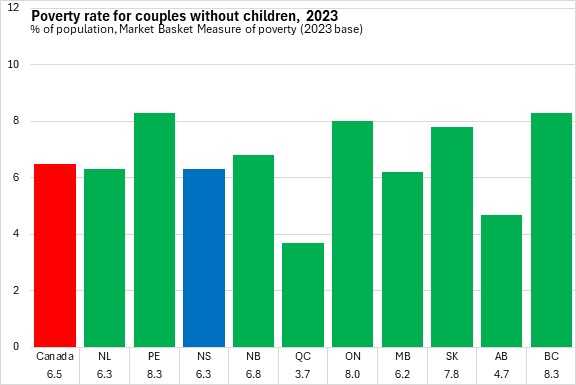
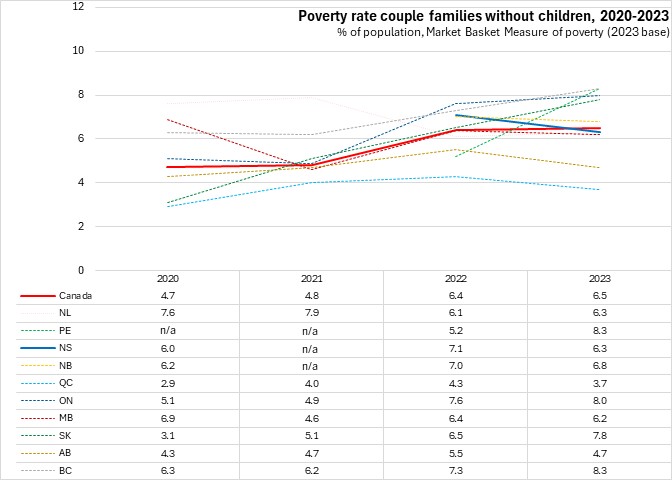
The poverty rate for couple economic families without children was 6.3% in Nova Scotia in 2023, using the 2023-base for the market basket. This was below the national average of 6.5% (highest: Prince Edward Island and British Columbia, lowest: Québec).
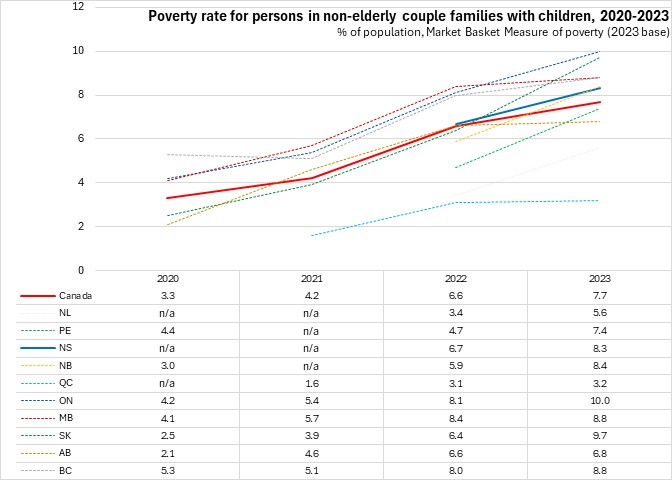
Nova Scotia's poverty rate for couple families with children was down from 2022 to 2023. Five provinces reported rising poverty rates for couple families with children.
In Nova Scotia, 8.3% of couple families with children were below the MBM poverty line (2023 base) in 2023. The national poverty rate for couple families with children was 7.7% (highest: Ontario and Saskatchewan, lowest: Québec).
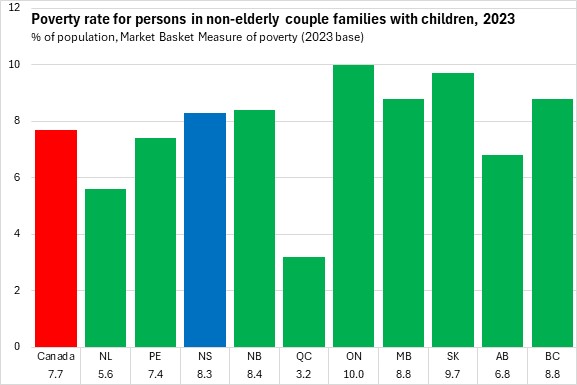
Poverty rates among couple families with children rose in all provinces in 2023 (using the 2023 base for the market basket).
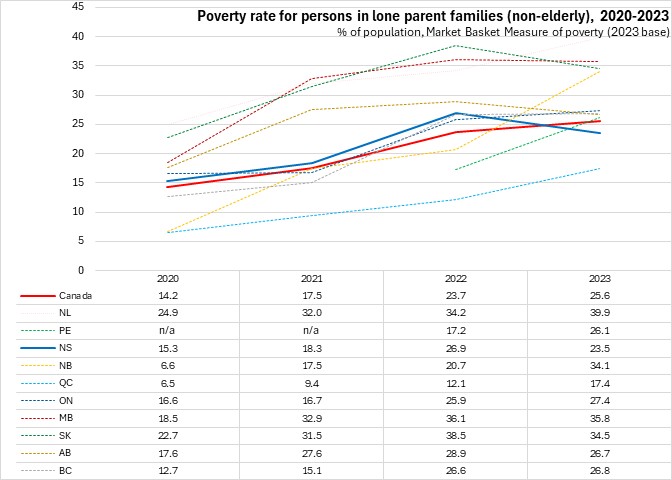
Lone parent families have historically had higher poverty rates than for couple economic families. In Nova Scotia, 23.5% of those in lone parent families lived in poverty, the second lowest poverty rate for lone parents after Québec. The national poverty rate for lone parent families was 25.6% for these families (using the 2023 base for the market basket). Lone parent poverty was highest in Newfoundland and Labrador.
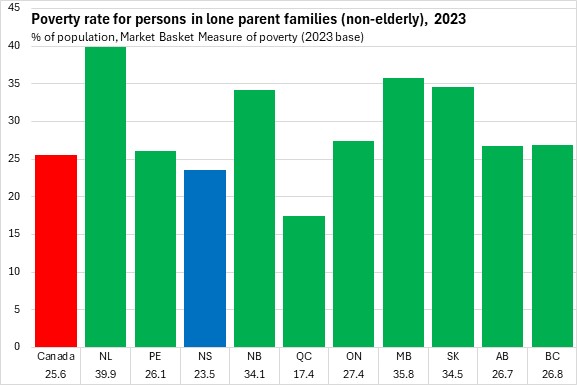
Nova Scotia's poverty rate among lone parent families declined by 3.4 percentage points from 2022 to 2023. Lone parent poverty rates were up for six provinces with declines in Nova Scotia as well as the three prairie provinces.
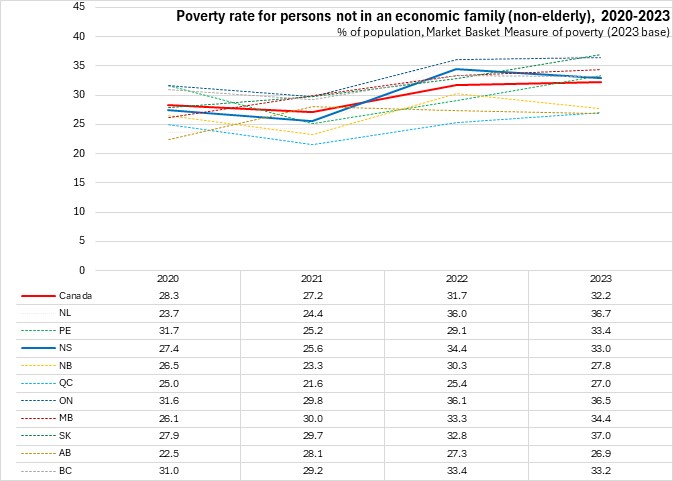
Persons not in economic families report the highest poverty rates. In 2023, 33.0% of Nova Scotians who were not in an economic family lived in poverty (using the 2023 base for the market basket). This is above the national average fo 32.2%. Persons not in economic families reported the highest poverty rates in Saskatchewan, Newfoundland and Labrador and Ontario. The lowest poverty rates among non-elderly persons not in an economic family were in Alberta and Québec.
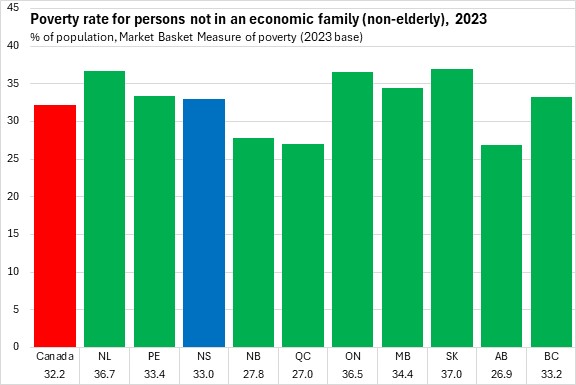
Nova Scotia's poverty rates for persons not in economic families decreased in 2023. Six provinces reported increases in poverty rates for persons not in an economic family from 2022 to 2023.
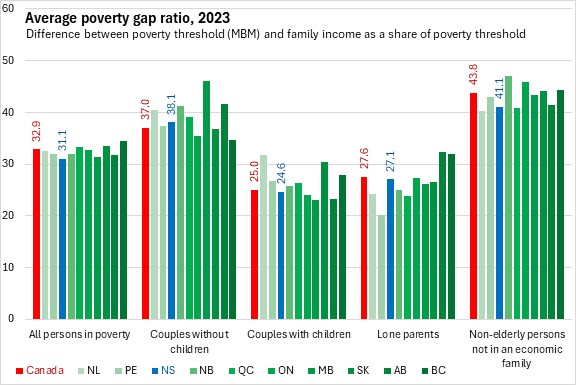
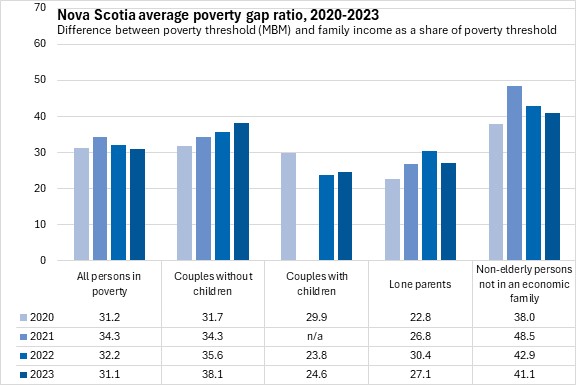
The average poverty gap reports the difference between the MBM threshold and family income, stated as a percentage of the threshold. For all Nova Scotians living in poverty in 2023, the gap was 31.1% of the (2023 base) MBM threshold, which was the smallest gap among provinces. Outside of couples without children Nova Scotia's poverty gap was smaller than the national average for each major family structure. Nova Scotia's poverty gap ratio was smallest for couples with children (24.6%) as well as for lone parent families (27.1%). Non-elderly persons not in an economic family had both the highest poverty rates and poverty gap ratio (41.1%).
Nova Scotia's average poverty gap ratios (2023 base for the market basket) improved in 2023, reflecting gains for lone parents as well as non-elderly persons not in an economic family.
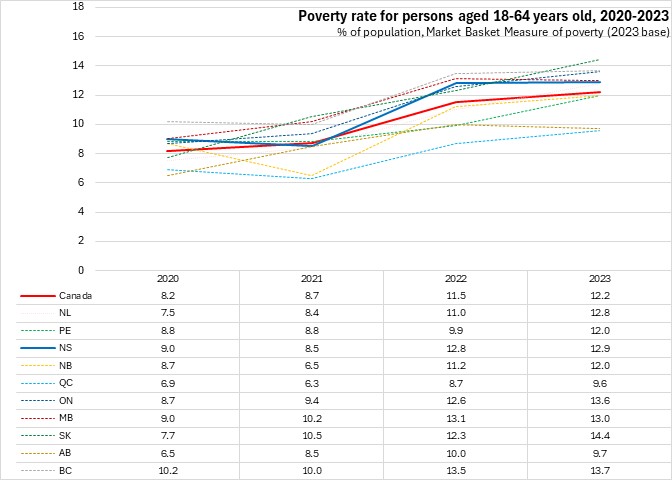
The majority of those living in poverty in Nova Scotia are between the ages of 18 and 64 years old. This is the case across the country, where this age cohort is clearly the largest part of the population.
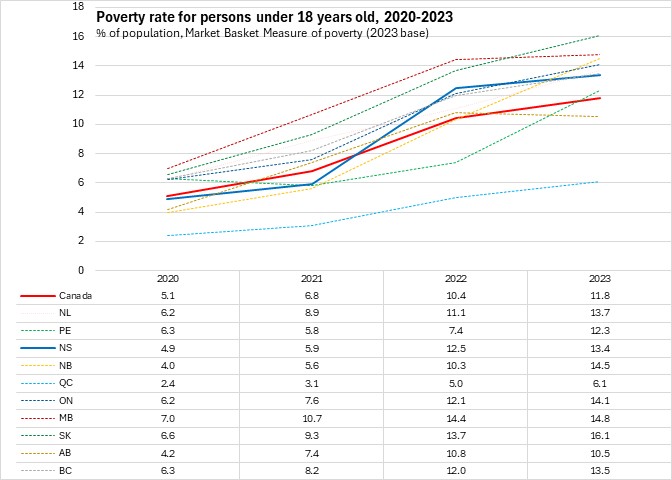
The child poverty rate in Nova Scotia was 13.4% in 2023 (using the 2023 base for the market basket). The national child poverty rate was 11.8% with the highest child poverty in Saskatchewan and the lowest child poverty in Québec.
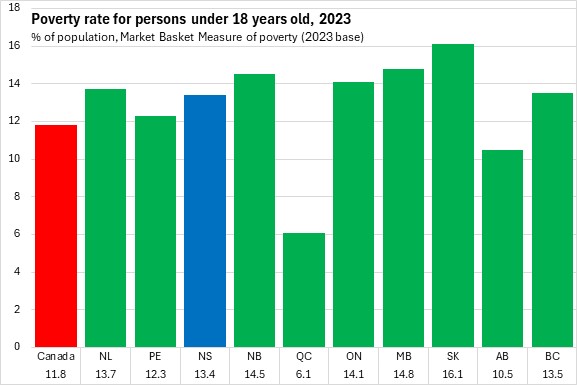
Every province except Manitoba and Alberta reported an increase in child poverty rates in 2023. Prince Edward Island reported the largest rise in the child poverty rate.
The poverty rate for those aged 18-64 was 12.9% in Nova Scotia (using the 2023 base for the market basket). The poverty rates for those aged 18-64 was 12.2% nationally with the lowest rates in Alberta and Québec and the highest rate in Saskatchewan.
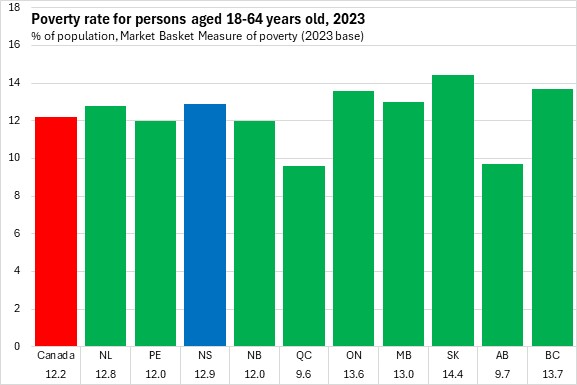
Poverty rates for those aged 18-64 increased in all provinces except Manitoba and Alberta in 2023.
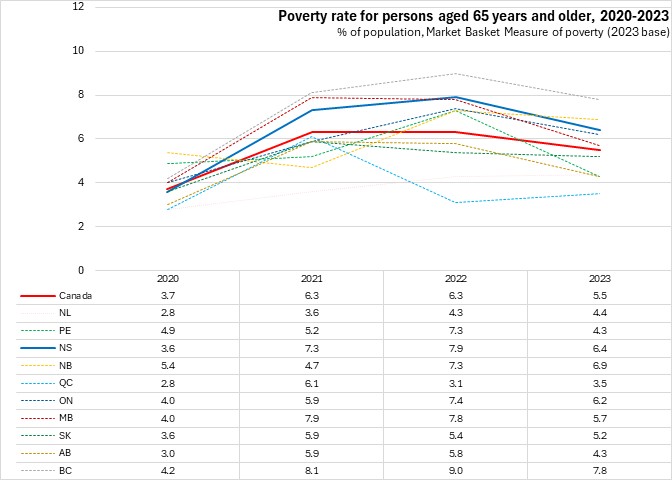
Nova Scotia's poverty rate among seniors was 6.4% - the third highest rate among the provinces for this cohort after British Columbia and New Brunswick. The national seniors poverty rate was 5.5% with the lowest value in Québec.

Seniors' poverty declined in all provinces except Newfoundland and Labrador and Québec in 2023.
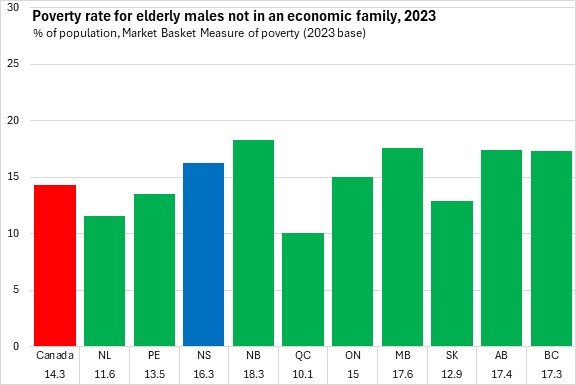
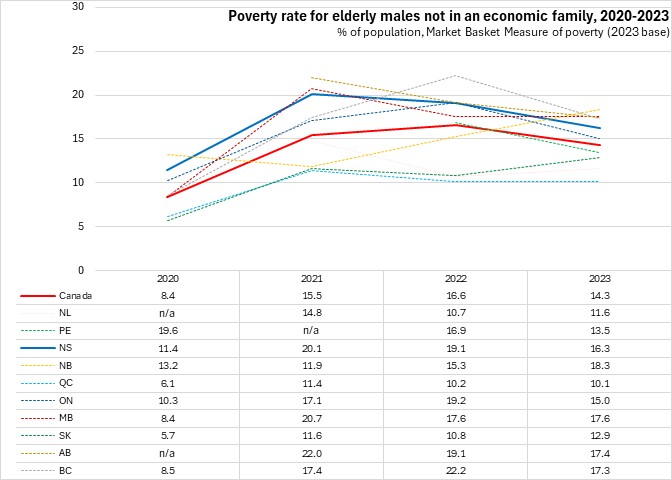
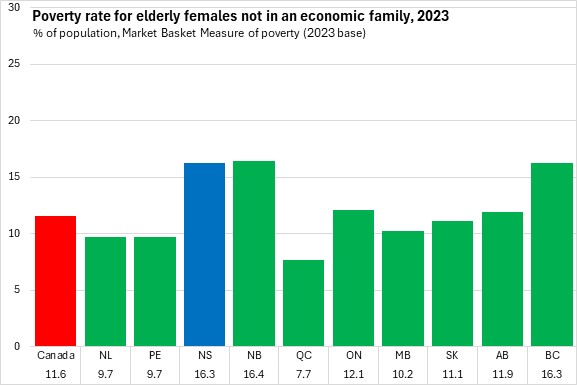
Among the population aged 65 and older, the number of Nova Scotians who live in poverty (2023 base for the market basket) is highly concentrated among elderly persons not in an economic family. Of the 15,000 seniors in poverty in Nova Scotia, 10,000 of them were not in economic families, and of these a disproportionate number were women (7,000).
Nova Scotia's poverty rate for elderly females not in an economic family was the same as for elderly males not in an economic family: 16.3%. Poverty rates among elderly persons not in an economic family declined in 2023 in Nova Scotia.
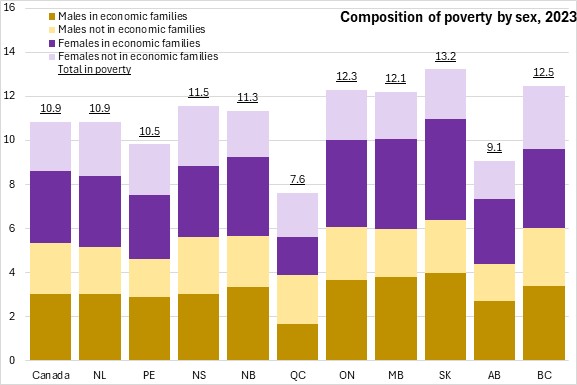
There were more females (61,000) than males (57,000) in poverty in Nova Scotia in 2023. In most provinces, females make up a larger portion of those living in poverty (2023 base for the market basket).
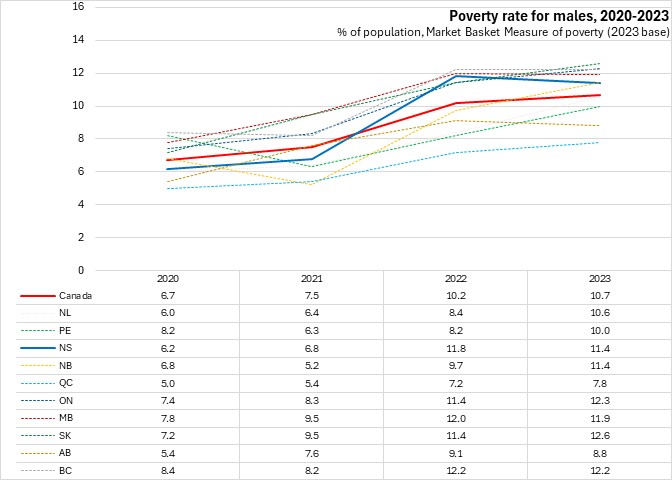
The male poverty rate was 11.4% in Nova Scotia in 2023 (2023 base for the market basket). The male poverty rate was 10.7% nationally with the lowest poverty rate in Québec and the highest rates in Ontario and Saskatchewan.
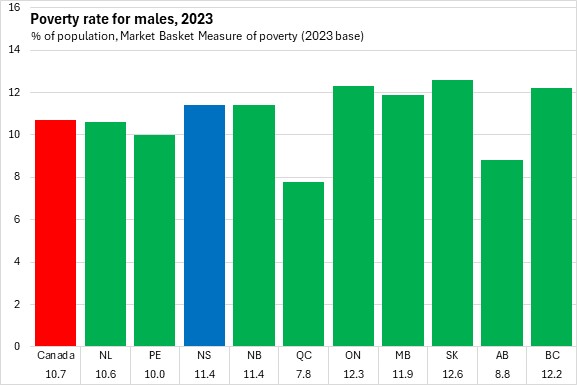
Male poverty rates increased for six provinces in 2023. Nova Scotia's male poverty rate declined in 2023.
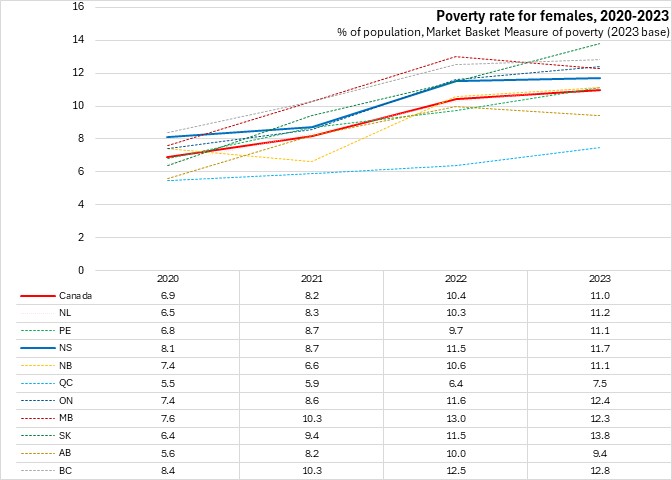
The female poverty rate was 11.7% in Nova Scotia in 2023 (2023 base for the market basket). The national female poverty rate was 11.0% in 2023, with the the lowest female poverty rate in Québec and the highest in Saskatchewan.
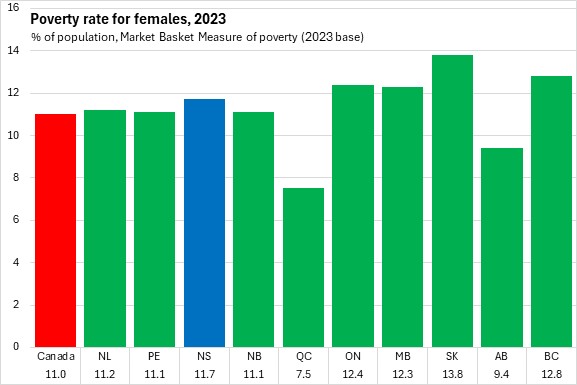
Female poverty rates rose in eight provinces in 2023, including Nova Scotia.
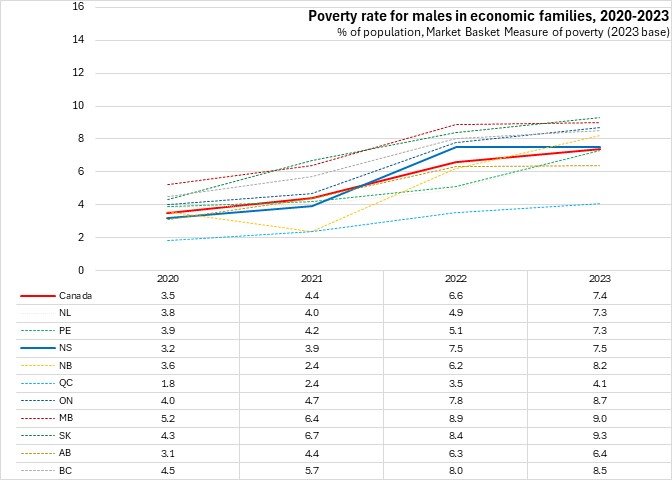
The poverty rate among Nova Scotia males in economic families was 7.5% in 2023 (2023 base for the market basket). Nationally, males in economic families had a poverty rate of 7.4% with the lowest prevalence in Québec and the highest in Saskatchewan.
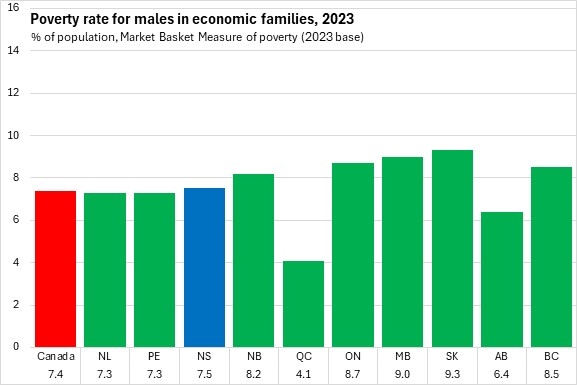
Poverty rates for males in economic families were up in nine provinces in 2023. Nova Scotia was the only exception with no change.
The poverty rate for females in an economic family in Nova Scotia was 7.9% in 2023 (2023 base for the market basket). Nationally, the poverty rate for females in an economic family was also 7.9% (lowest: Québec, highest: Saskatchewan).
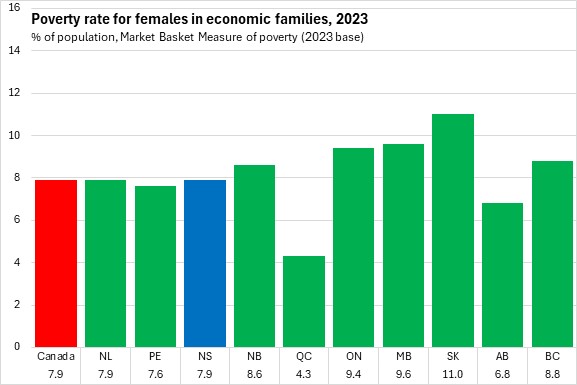
Poverty rates for females in economic families increased in eight provinces (including Nova Scotia) in 2023.

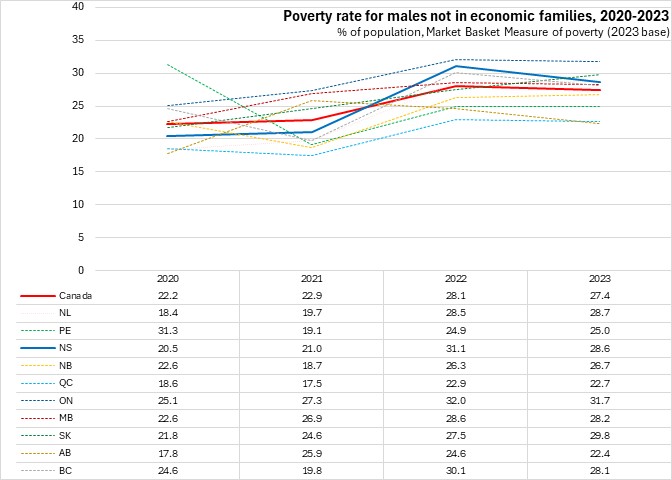
Nova Scotia's poverty rate for males not in an economic family was substantially higher than for males in an economic family at 28.6% in 2023 (2023 base for the market basket). Ontario reported the highest poverty rate for this cohort. Nationally, the poverty rate among males not in an economic family was 27.4% with the lowest poverty rates in Alberta and Québec.
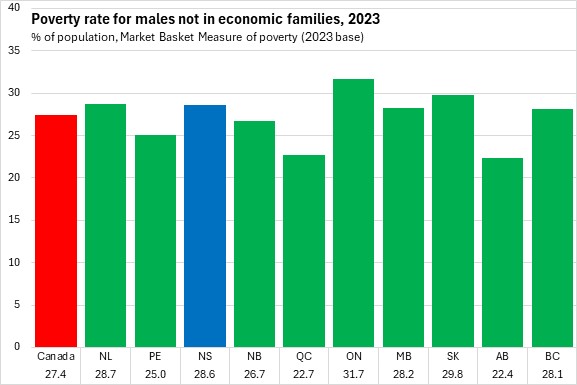
Poverty rates for males not in an economic family decreased in six provinces (including Nova Scotia).
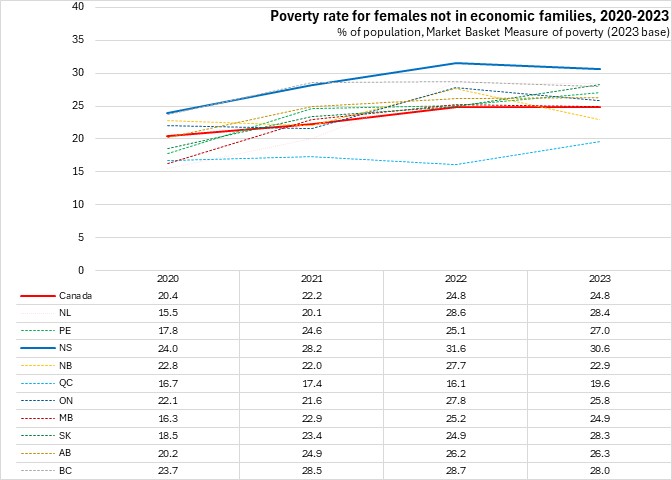
Nova Scotia's poverty rate for females not in an economic family was 30.6% in 2023 - the highest among provinces and substantially higher than for females in an economic family. Nationally, females not in an economic family had a poverty rate of 24.8% with the lowest value in Québec.
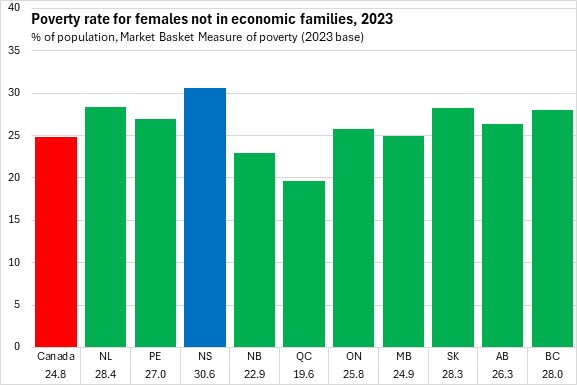
Poverty rates for females not in an economic family decreased in six provinces (including Nova Scotia) in 2023.
Threshold
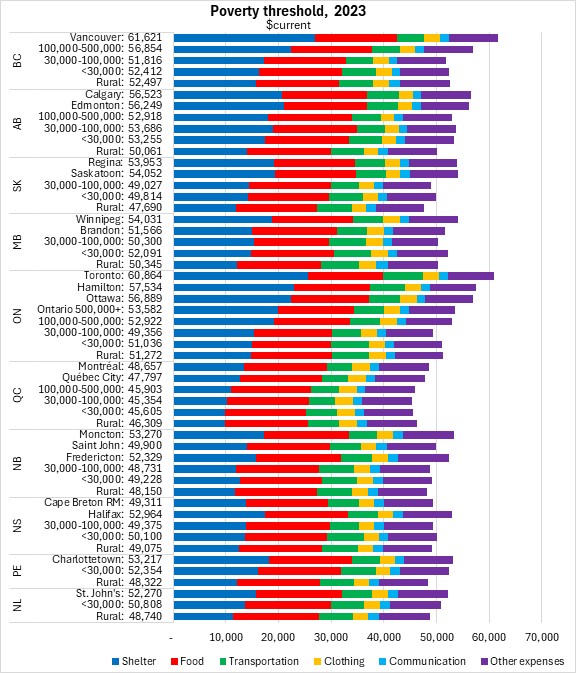
The threshold for the poverty rate varies by province and community size. In Nova Scotia, the income required for a reference family (2 adults, 2 children) to afford a basic standard of living ranged from $49,075 in rural Nova Scotia to $52,964 in Halifax. The highest thresholds were reported in larger cities: Vancouver, Calgary, Edmonton, Toronto and Ottawa. The lowest thresholds were in smaller communities of Québec.
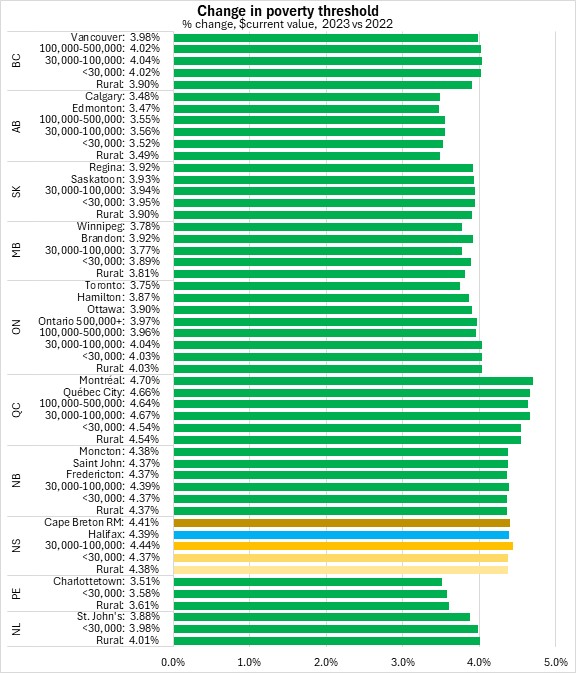
Compared with the 2023 base thresholds from 2022, Nova Scotia's Market Basket Measure threholds increased by between 4.37% and 4.44%. MBM threshold levels grew faster in the Québec, New Brunswick and Nova Scotia.
Notes and definitions
The Canadian Income Survey estimates are based on probability samples and are therefore subject to sampling variability. As a result, estimates will show more variability than trends observed over longer time periods.
The market basket measure (MBM) of poverty is based on the cost of a specific basket of goods and services representing a modest, basic standard of living. It includes the costs of food, clothing, footwear, transportation, shelter, communications and other expenses for a reference family. These costs are compared with the disposable income of families to determine whether or not they fall below the poverty line.
An economic family refers to a group of two or more persons who live in the same dwelling and are related to each other by blood, marriage, common-law union, adoption or a foster relationship. This concept differs from the census family concept used for subprovincial data in the Annual Income Estimates for Census Families and Individuals.
Sources: Statistics Canada, Canadian Income Survey. Table 11-10-0135-01 Low income statistics by age, sex and economic family type; Table 11-10-0136-01 Low income statistics by economic family type; Table 11-10-0093-01 Poverty and low-income statistics by selected demographic characteristics
<--- Return to Archive