The Economics and Statistics Division maintains archives of previous publications for accountability purposes, but makes no updates to keep these documents current with the latest data revisions from Statistics Canada. As a result, information in older documents may not be accurate. Please exercise caution when referring to older documents. For the latest information and historical data, please contact the individual listed to the right.
<--- Return to Archive
For additional information relating to this article, please contact:
January 09, 2026LABOUR MARKET TRENDS, ANNUAL 2025 Note: On January 26, 2026 Statistics Canada revised monthly data to account for new seasonal adjustment factors:
January 26, 2026 LABOUR FORCE SURVEY SEASONAL ADJUSTMENT REVISIONS 2023-2025
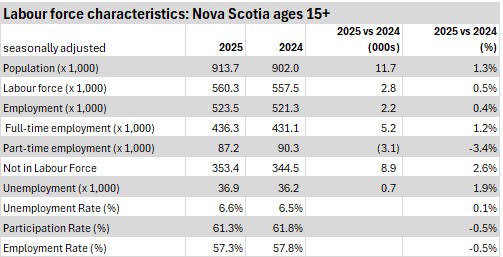
Ages 15+ (2025 vs 2024, annual averages)
Compared with the annual average from 2024, Nova Scotia's population of working age grew by 11,700 (+1.3%) on average in 2025. The labour force increased 0.5% (+2,800) while employment grew 0.4% (+2,200). With a slightly stronger pace of growth in labour force than in employment, Nova Scotia's annual average unemployment rate rose 0.1 percentage points to 6.6%.
Full time employment was up by 5,200 and part time employment was down by 3,100 (including changes of hours within the same position).
There was an increase in the number of persons not in the labour force of 8,900 (+2.6%) while the number of unemployed persons rose 700 (+1.9%).
As labour force grew slower than the population, Nova Scotia's participation rate fell 0.5 percentage points to 61.3% in 2025. A slower pace of growth in employment than population pushed the annual average employment rate down 0.5 percentage points to 57.3% for 2025.
Age and sex cohorts (2025 vs 2024, annual average)
In 2025, the population of females grew slightly faster than the population of males. However, male labour force and employment were up while female labour force and employment were down.
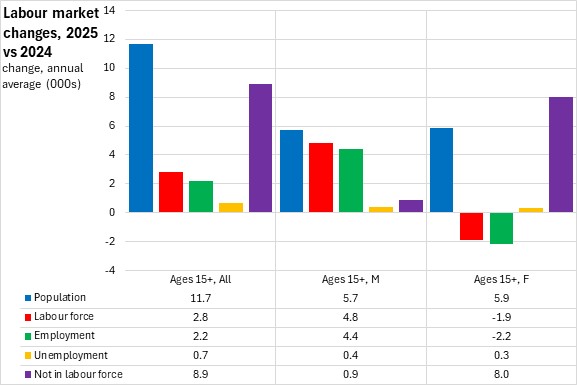
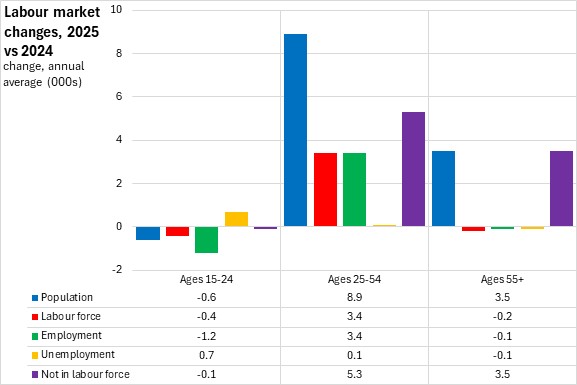
Across broad age cohorts, the largest increases in labour force and employment were reported among the core working age (25-54) - this age cohort also has much larger population than youth (15-24) or older workers (55+).
Core aged workers reported growth in both labour force and employment with a slight increase in unemployment. There was a substantial increase in the number of core aged workers not in the labour force.
Among youth, population, labour force and employment were all down. Youth saw a small rise in the number of unemployed and a marginal decline in the number not in the labour force.
The population of older workers rose in 2025 but there were small declines in labour force, employment and unemployment. The number of older persons not in the labour force (includes retirees) was up in 2025.
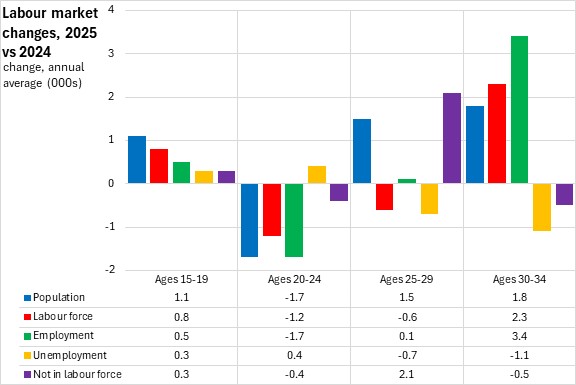
Within specific age cohorts, population, employment and labour force were all up for those aged 15-19. There were notably strong decreases in population, employment and labour force for those aged 20-24. For those aged 25-29, population and employment were up, but there was a contraction in labour force and a substantial rise for the number of persons not in the labour force. Employment was up substantially for those aged 30-34, outpacing gains in labour force and population (resulting in lower numbers in unemployment and not in the labour force).
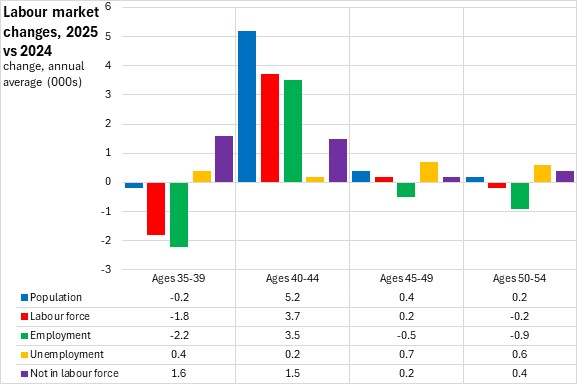
The 35-39 year old age cohort reported labour force and employment declines that outpaced population contraction. For those aged 40-44, population, labour force and employment all increased. For those aged 45-49 and 50-54, there were only small changes in population, labour force and employment, though both cohorts reported higher numbers of unemployed persons in 2025.
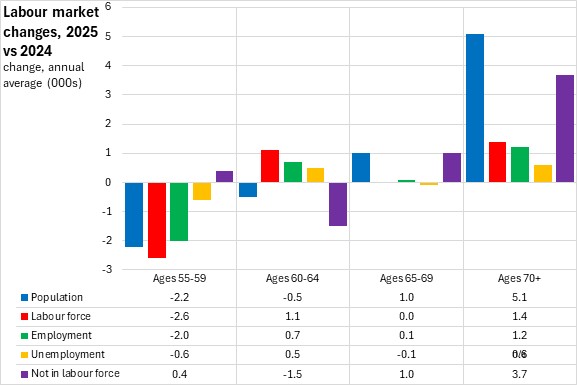
Those aged 55-59 reported a smaller population, with labour force declining faster than employment and a decline in unemployment. Among those aged 60-64 there were increases in labour force and employment despite a population decline. For those aged 65-69, the labour force was stable and employment barely grew even though there was a rising population. Among those aged 70 and over, the population increase was primarily concentrated among those not in the labour force, though there were increases in labour force, employment and unemployment.
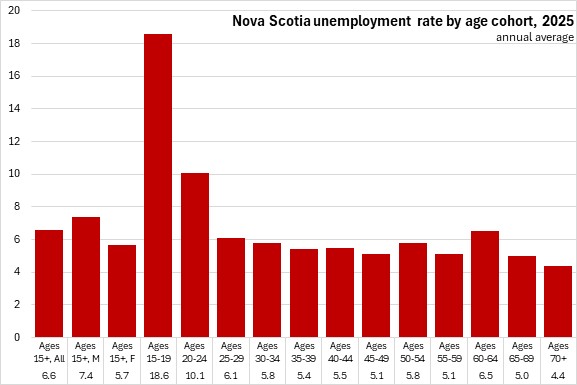
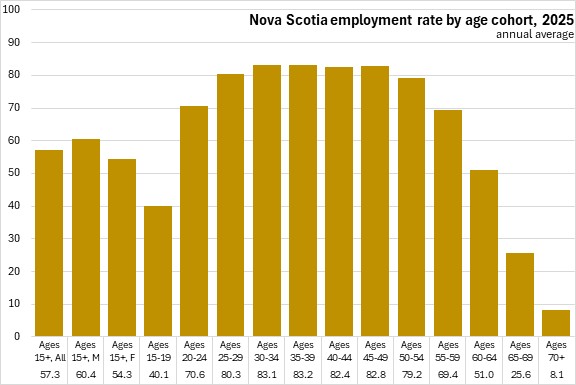
Unemployment rates in 2025 were higher for younger cohorts and lowest for those in the middle of the core working ages and among the oldest workers. Males (aged 15+) had higher unemployment rates compared to females of the same age.
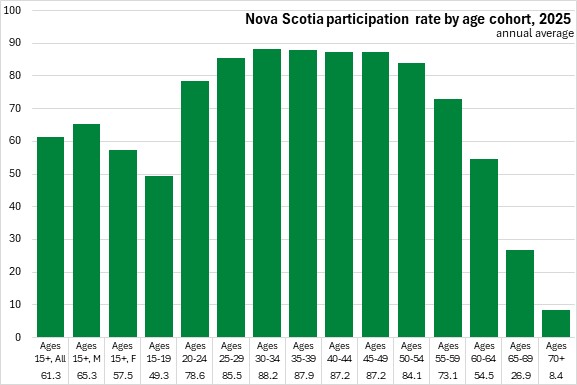
Participation rates were highest for those aged 25-54. Participation rates were slightly lower for those aged 20-24 and 55-59. Participation rates are substantially lower for those over age 60 as well as those under 20. Males had higher participation rates than females.
As with participation rates, employment rates were highest for those aged 25-54. Like participation rates, employment rates were somewhat lower for those aged 20-24 and 55-59, and fall off substantially for those over age 60 and under age 20. As with participation rates, males had higher employment rates than females in 2025.
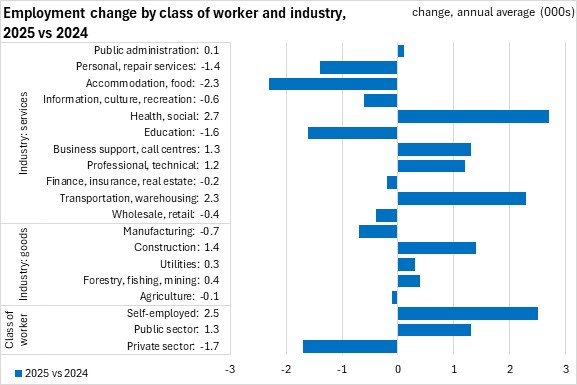
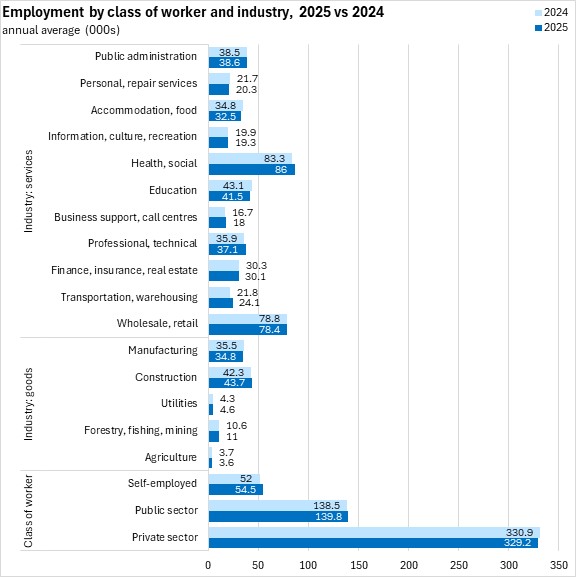
Class of worker and industry (2025 vs 2024, annual average)
Nova Scotia's annual employment increase was primarily due to higher public sector employment (+1,300 or +0.9%) as well as self employment (+2,500 or +4.8%). Private sector employment was down by 1,700 (-0.5%).
Among industries, the rise in annual employment was primarily from gains in health/social/daycare, business support/call centres, professional/technical services, transportation and construction. There were notable employment declines for personal/repair services, accommodation/food services and education.
Wholesale/retail and health/social assistance (including daycares) remain the largest broad industries of employment in Nova Scotia, followed by education, construction, public administration, professional/technical services, manufacturing and accommodation/food services.

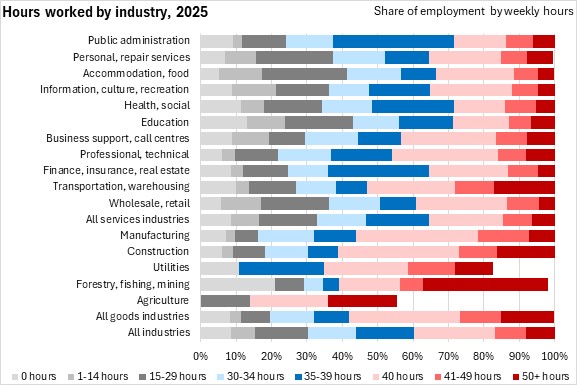
Hours worked (2025 annual average)
A larger portion of workers in services industries had part-time hours (less than 30 hours/week). Workers in goods industries generally reported a higher portion of employment with over 40 hours per week.
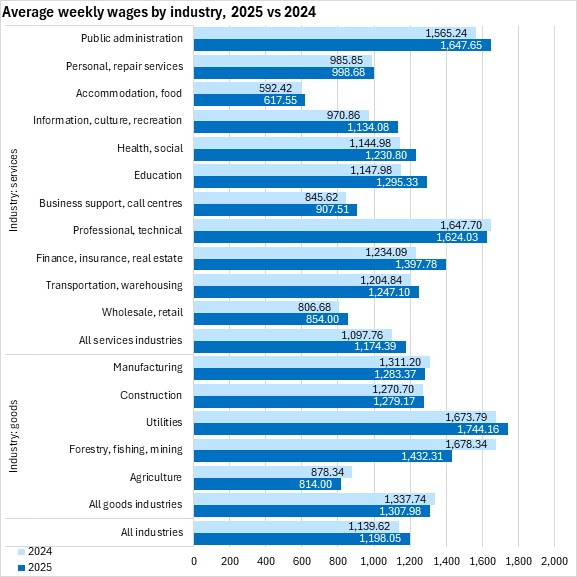
Average weekly wages (2025 vs 2024, annual average)
Nova Scotians' average weekly earnings amounted to $1,198.05 in 2025, up from $1,139.62 in 2024. Average weekly wages were highest in utilities, public administration and professional/technical services. The lowest average weekly earnings were reported in accommodation/food, wholesale/retail and agriculture.
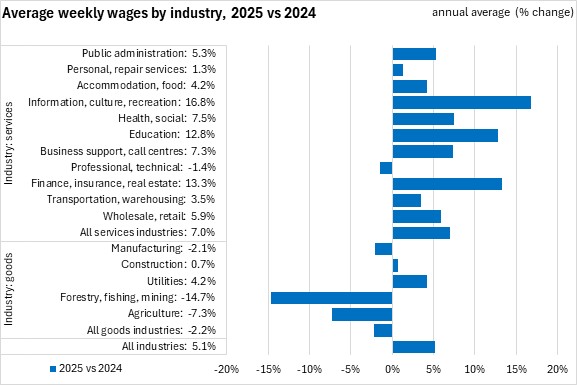
Average weekly earnings were up 5.1% from 2024 to 2025. Average weekly earnings grew fastest for information/culture/recreation, education, finance/insurance/real estate, health/social/daycare and business support/call centres. Agriculture, forestry/fishing/mining, manufacturing and professional/technical services were the only broad industries to report lower average weekly earnings.
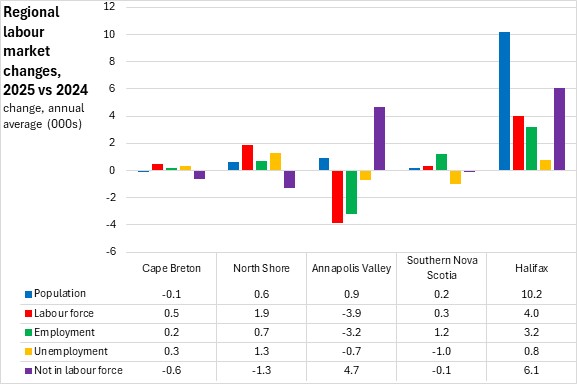
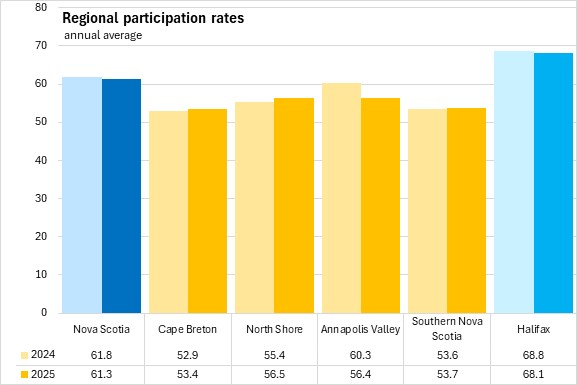
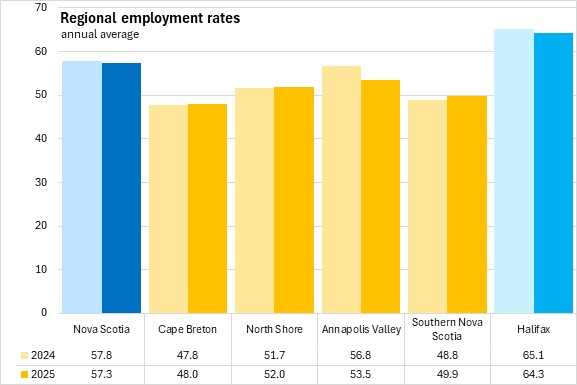
Regions (2025 vs 2024, annual average)
All regions except Cape Breton reported increases in population of working age.
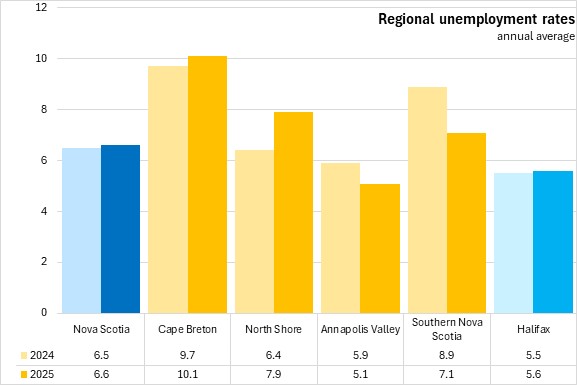
All regions except the Annapolis Valley and Southern Nova Scotia reported higher unemployment rates.
Labour force and employment were each up in every region except the Annapolis Valley, where labour force contracted faster than employment and drove the unemployment rate down. In Cape Breton, the North Shore and Halifax regions, labour force growth outpaced rising employment, driving annual average unemployment rates up. In Southern Nova Scotia, the average annual unemployment rate was down as employment grew faster than the rise in labour force.
Participation rates were down overall in Nova Scotia in 2025. Participation rates rose in Cape Breton, the North Shore and Southern economic regions. Halifax and the Annapolis Valley reported declining participation rates. Halifax reported the highest participation rate in 2025 while Cape Breton reported the lowest.
Employment rates were up for Cape Breton, the North Shore and Southern Nova Scotia. Halifax and the Annapolis Valley reported lower employment rates. Halifax had the highest employment rate in 2025 while Cape Breton had the lowest.
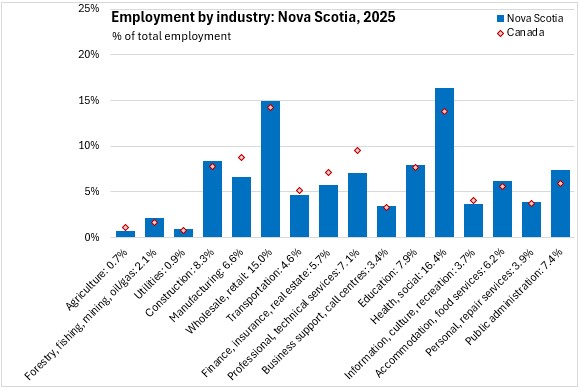
Measured as a share of total employment in 2025, Nova Scotia's employment was relatively more concentrated (compared with the national average) in construction, wholesale/retail, health/social (including daycare), accommodation/food services and public administration. Nova Scotia's employment was disproportionately low (compared to the national average) in manufacturing, transportation, finance/insurance/real estate, professional/technical services and information/culture/recreation.
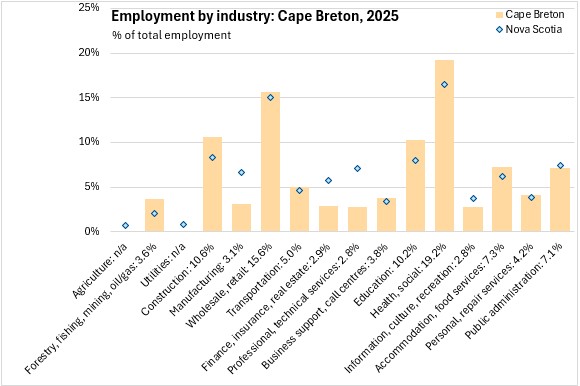
Compared against the provincial distribution of employment by industry, employment in Cape Breton was notably more concentrated in health care and social assistance (including daycare) as well as in construction, education, forestry/fishing/mining and accommodation/food services. Compared with the provincial average, Cape Breton's employment in manufacturing, finance/insurance/real estate and professional/technical services were disproportionately low.
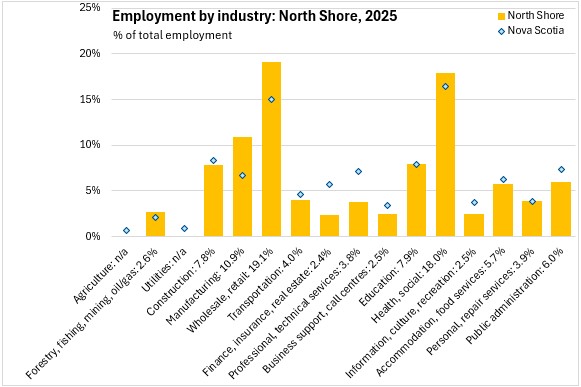
Compared against the provincial distribution of employment by industry, employment in the North Shore economic region was notably more concentrated in health/social (including daycare), wholesale/retail and manufacturing. Compared with the provincial average, the North Shore's employment levels in transportation, finance/insurance/real estate, professional/technical services, information/culture/recreation and public administration were disproportionately low.
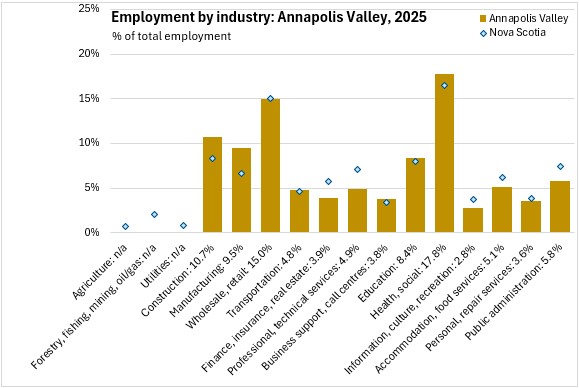
Compared against the provincial distribution of employment by industry, employment in the Annapolis Valley was notably more concentrated in construction, manufacturing and health/social/daycare (data for agricultural industries were unavailable). Compared with the provincial average, the Annapolis Valley's employment is disproportionately low in finance/insurance/real estate, professional/technical services, information/culture/recreation, accommodation/food services and public administration.
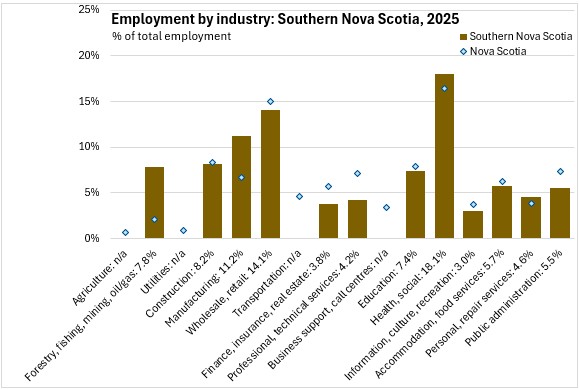
Southern Nova Scotia's employment was notably more concentrated in forestry/fishing/mining and manufacturing. Southern Nova Scotia's employment by industry is disproportionately low compared with the provincial averages for: wholesale/retail, finance/insurance/real estate, professional/technical services, information/culture/recreation and public administration.
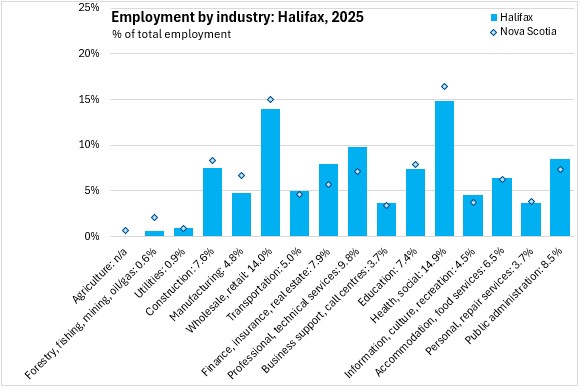
In Halifax, employment by industry was notably more concentrated (compared with the provincial average) in: finance/insurance/real estate, professional/technical services, information/culture/recreation and public administration. Halifax's employment shares for forestry/fishing/mining, manufacturing and health/social/daycare were disproportionately low compared to the provincial averages.
Provinces (2025 vs 2024, annual average)
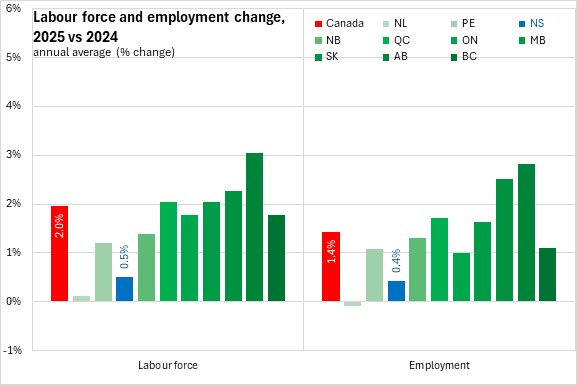
Nova Scotia's labour force increase of 0.5%, which was the second slowest growth among provinces, ahead of Newfoundland and Labrador. National labour force grew 2.0% in 2025 with the fastest gain in Alberta.
Nova Scotia's employment gain of 0.4% was the second weakest among provinces (ahead of Newfoundland and Labrador's employment decline). Nationally, employment was up 1.4% with gains in all provinces except Newfoundland and Labrador.
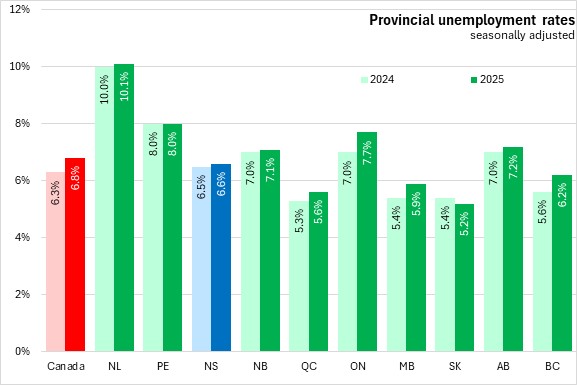
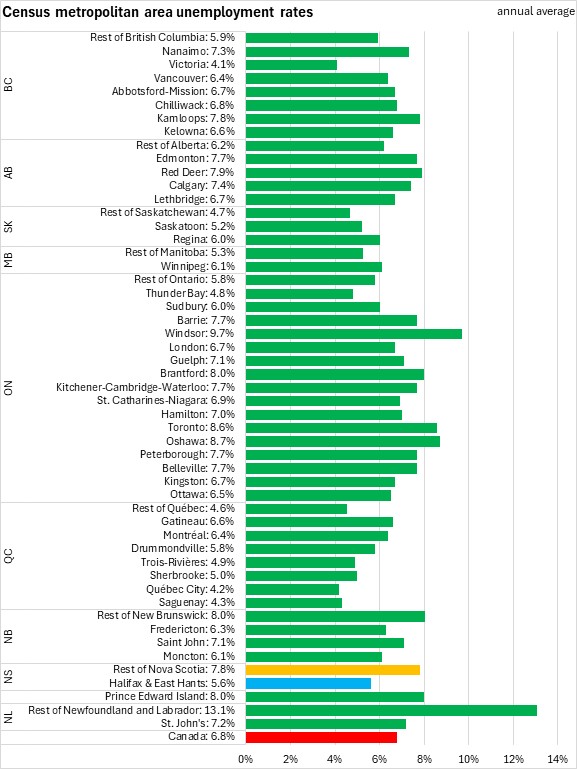
The national unemployment rate averaged 6.8% in 2025, up from 6.3% reported in 2024. Unemployment rates were up for every province except Prince Edward Island (steady) and Saskatchewan (down). Saskatchewan reported the lowest unemployment rate (5.2%). Newfoundland and Labrador had the highest unemployment rate in 2025 (10.1%).
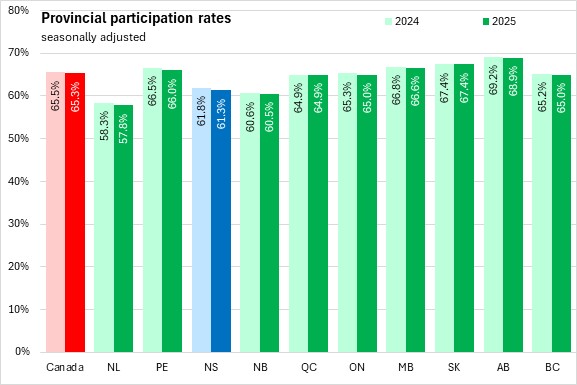
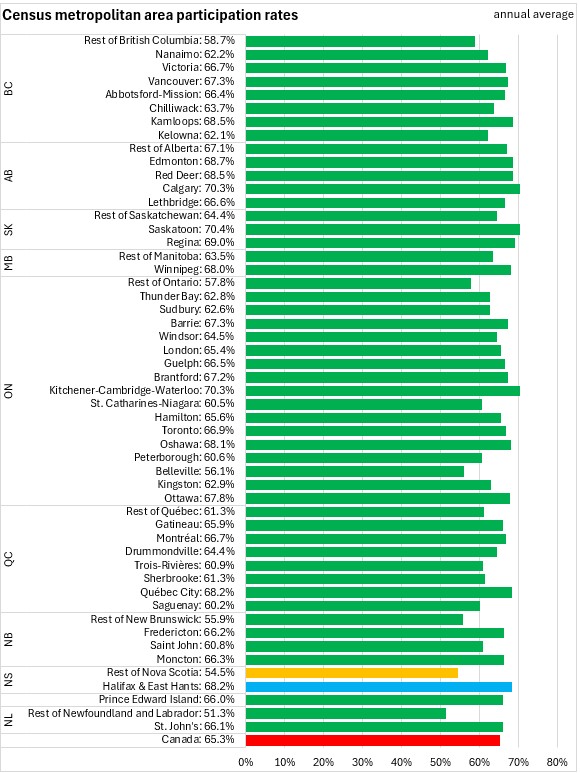
Labour force participation rates were down for all provinces except Québec and Saskatchewan (both stable) from 2024 to 2025. The national participation rate was 65.3%, down from 65.5% in 2024. Nova Scotia's participation rate (61.3%) was third lowest among the provinces in 2025, following Newfoundland and Labrador and New Brunswick. The highest participation rates were in Alberta and Saskatchewan.
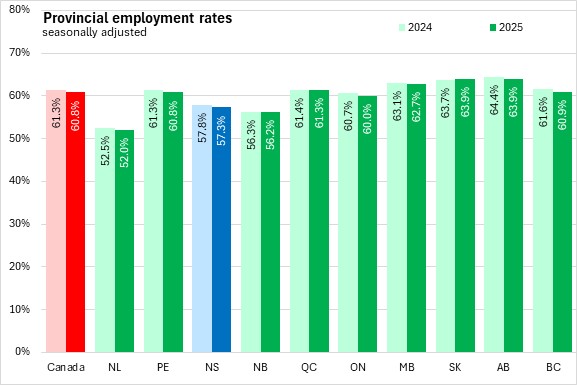
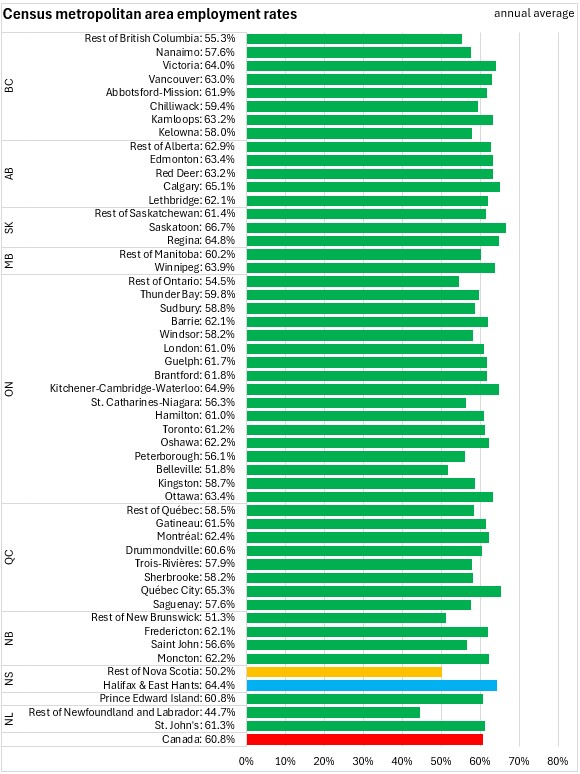
Employment rates increased in just one province from 2024 to 2025: Saskatchewan. The national employment rate fell by 0.5 percentage points to 60.8% in 2025. Alberta and Saskatchewan reported the highest employment rates in 2025; Newfoundland and Labrador reported the lowest.
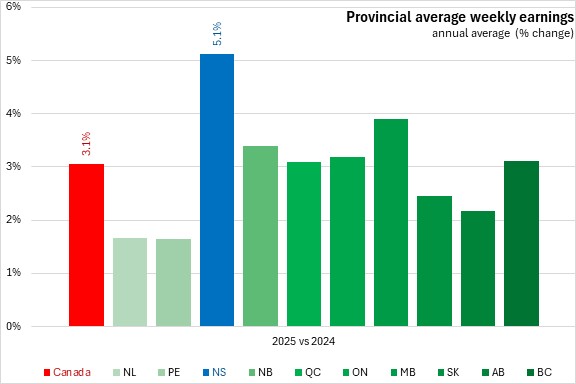
Nova Scotia reported the fastest growth in average weekly wages among provinces in 2025 with a 5.1% gain. The national increase in average weekly earnings was 3.1% with the slowest increases in Newfoundland and Labrador and Prince Edward Island.
Census Metropolitan Areas (2025, annual average)
Note: the Halifax Census Metropolitan Area (CMA) now includes the East Hants Municipal District.
The Halifax and East Hants CMA's unemployment rate averaged 5.6% in 2025. This below the national average and lower than in the rest of Nova Scotia (7.8%). In central and western provinces, unemployment rates in Census Metropolitan Areas were similar to or higher than unemployment rates outside CMAs. In the Atlantic Provinces unemployment rates are typically higher outside CMAs.
The Halifax and East Hants CMA's participation rate was 68.2% on average in 2025 while participation rates were 54.5% across the rest of the province. Only Newfoundland and Labrador outside St. John's reported a lower participation rate than Nova Scotia outside of Halifax.
The Halifax and East Hants CMA reported an employment rate of 64.4% on average in 2025 while the employment rate was 50.2% outside the city. Only Newfoundland and Labrador outside St. John's reported a lower employment rate than Nova Scotia outside of Halifax.
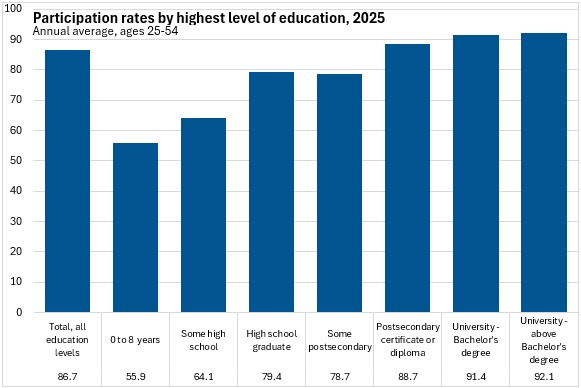
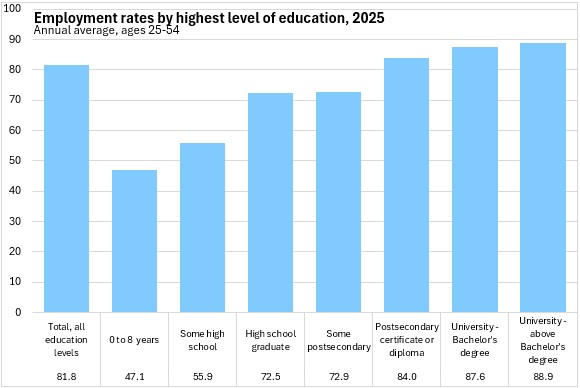
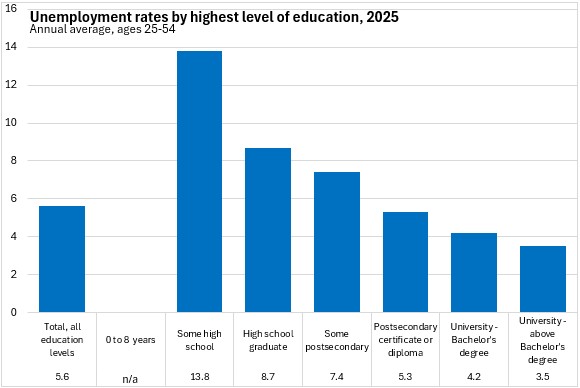
Labour market outcomes by highest level of education completed
Labour force participation rates and employment rates rise for those with higher levels of education. The participation rate of those with 8 or fewer years of schooling (aged 25-54) was only 55.9% while it was 92.1% for those with a university degree beyond the Bachelor's level.
Employment rates in 2025 ranged from a low of 47.1% for those aged 25-54 with 8 or fewer years of schooling up to a high of 88.9% for those with a university degree beyond a Bachelor's level.
Unemployment rates for Nova Scotians with the least amount of education were unavailable, but those with only some high school education reported a markedly higher unemployment rate in 2025 (13.8%) than those with university Bachelor's degrees (4.2%) or those with university degrees above the Bachelor's level (3.5%).
Reasons for labour market outcomes
As part of the Labour Force Survey, Statistics Canada asks respondents about their reasons for conditions such as part-time employment, losing a job or not participating at all in the labour force.
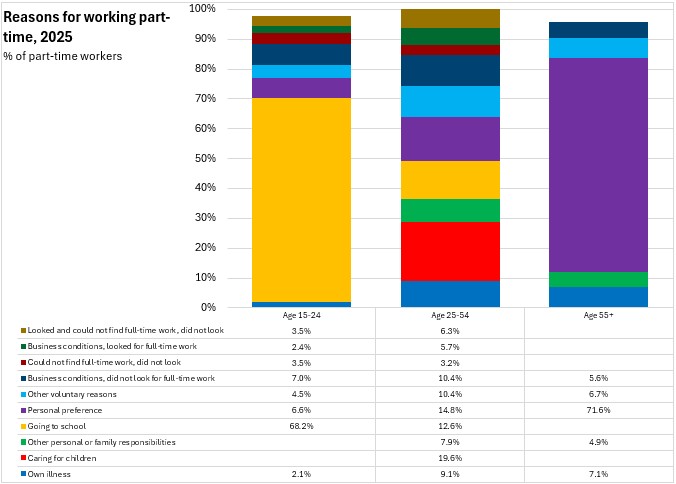
In 2025, there was an average of 87,100 part-time workers, fairly evenly distributed across three age categories: ages 15-24, ages 25-54 and ages 55+. For younger workers, going to school was by far the most common reason for working part time. For older workers, personal preference was the main reason for part-time work. For those aged 25-54, there were numerous reasons for part-time work, including personal preference, caring for children, business conditions, going to school and other voluntary reasons.
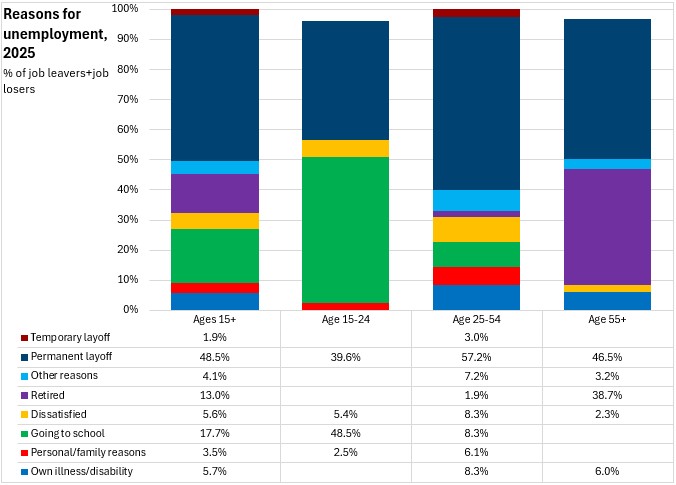
Among those who either left or lost a job in 2025 (68,400 persons), the most common reason for losing a job was permanent layoff. However, for younger workers, going to school was the most common reason for leaving a job in 2025 while for older workers, retirement was the most common reason for leaving a job.
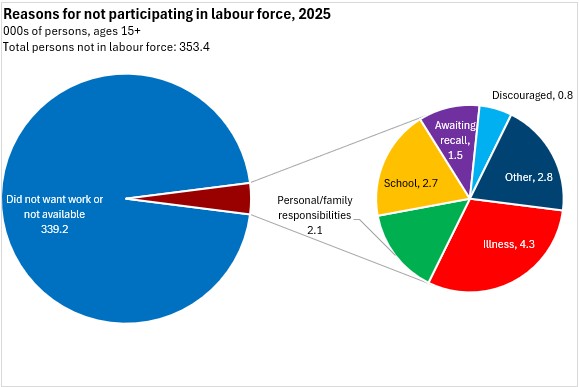
There were 353,400 persons in Nova Scotia who did not participate in the labour force in 2025. Of these, the vast majority (339,200) did not participate in the labour force because they did not want work (for reasons such as retirement) or were not available for work. Of the 14,200 persons that were not in the labour force but wanted work, illness was the most common reason for not participating. School, personal/family responsibility and waiting for recall were the next most commonly-specified reasons for not participating in the labour force, despite wanting work.
Source: Statistics Canada. Table 14-10-0037-01 Actual hours worked by industry, annual; Table 14-10-0064-01 Employee wages by industry, annual; Table 14-10-0327-01 Labour force characteristics by sex and detailed age group, annual; Table 14-10-0385-01 Labour force characteristics, annual; Table 14-10-0393-01 Labour force characteristics, annual; Table 14-10-0023-01 Labour force characteristics by industry, annual (x 1,000); Table 14-10-0027-01 Employment by class of worker, annual (x 1,000); Table 14-10-0396-01 Labour force characteristics by family structure, annual, unadjusted for seasonality; Table 14-10-0029-01 Part-time employment by reason, annual (x 1,000); Table 14-10-0126-01 Reason for leaving job during previous year, annual (x 1,000); Table 14-10-0128-01 Reason for not looking for work, annual (x 1,000); Table 14-10-0020-01 Unemployment rate, participation rate and employment rate by educational attainment, annual; Table 14-10-0392-01 Employment by industry, annual (x 1,000)
<--- Return to Archive