The Economics and Statistics Division maintains archives of previous publications for accountability purposes, but makes no updates to keep these documents current with the latest data revisions from Statistics Canada. As a result, information in older documents may not be accurate. Please exercise caution when referring to older documents. For the latest information and historical data, please contact the individual listed to the right.
<--- Return to Archive
For additional information relating to this article, please contact:
January 29, 2026NOVA SCOTIA INTERNATIONAL GOODS EXPORTS, NOVEMBER 2025 Year-over-year (November 2025 vs November 2024, domestic exports on a customs-basis, unadjusted)
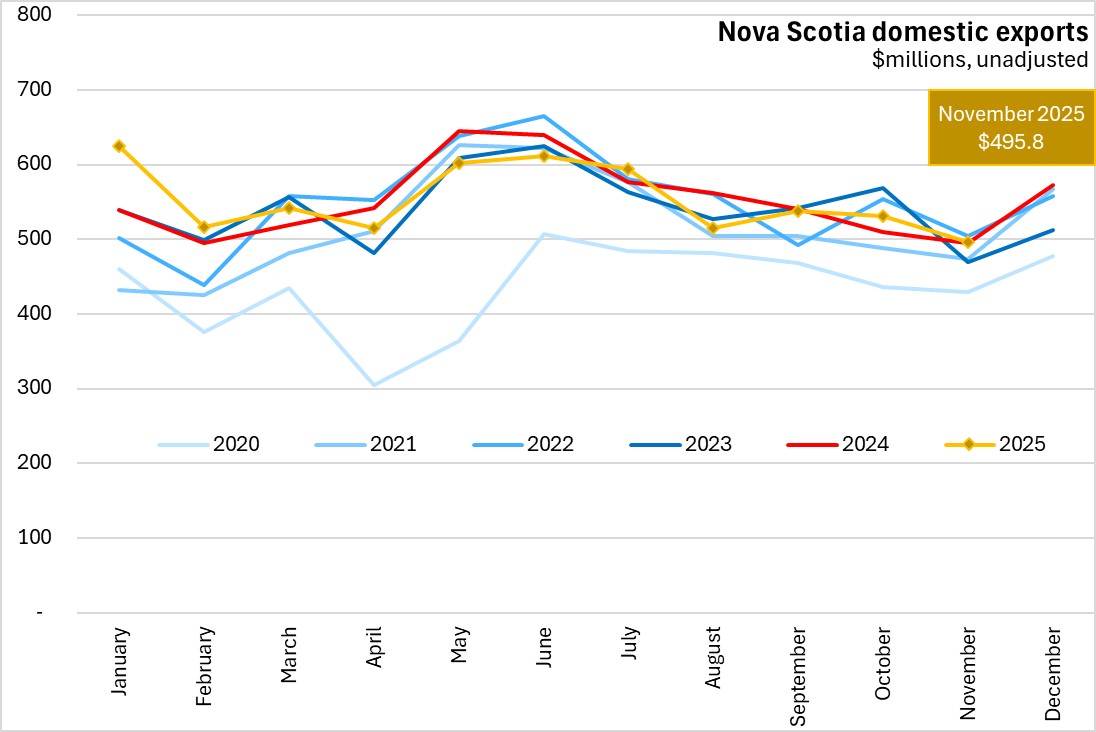
Nova Scotia international goods exports were $495.8 million in November 2025, a growth of 0.2% compared to November 2024.
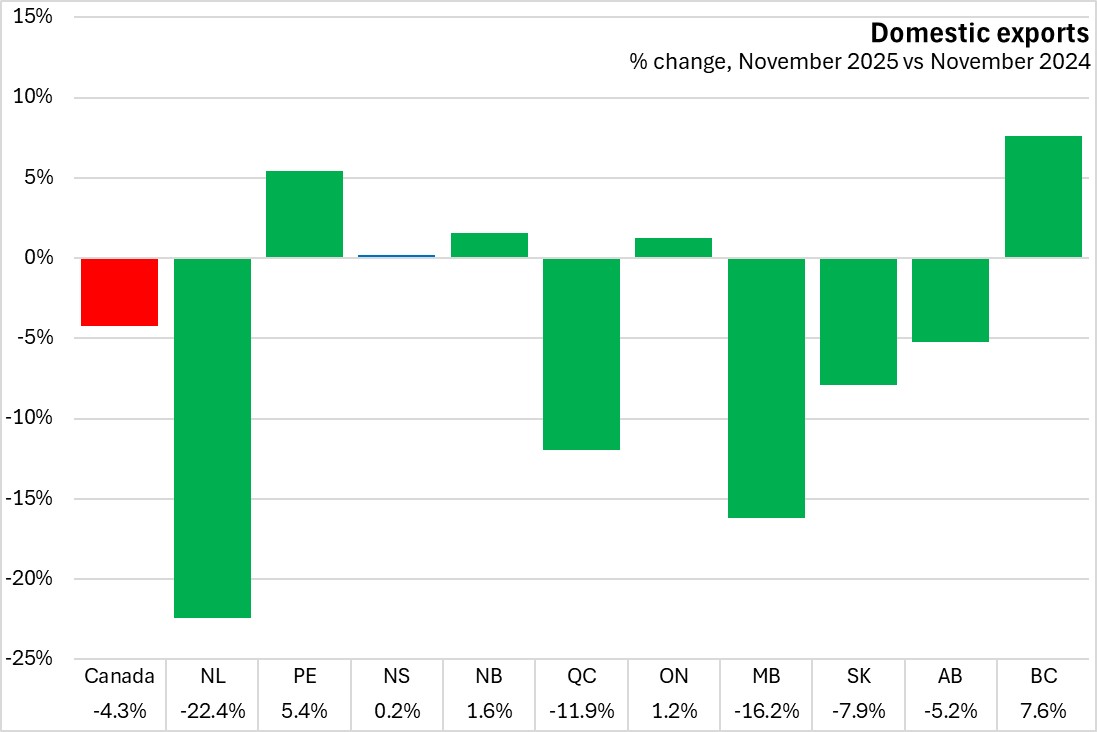
Canada's goods exports were down by 4.3% compared to November 2024. Five provinces reported higher exports year-over-year with British Columbia reporting the largest gain in domestic exports. Newfoundland and Labrador experienced the largest decline in exports.
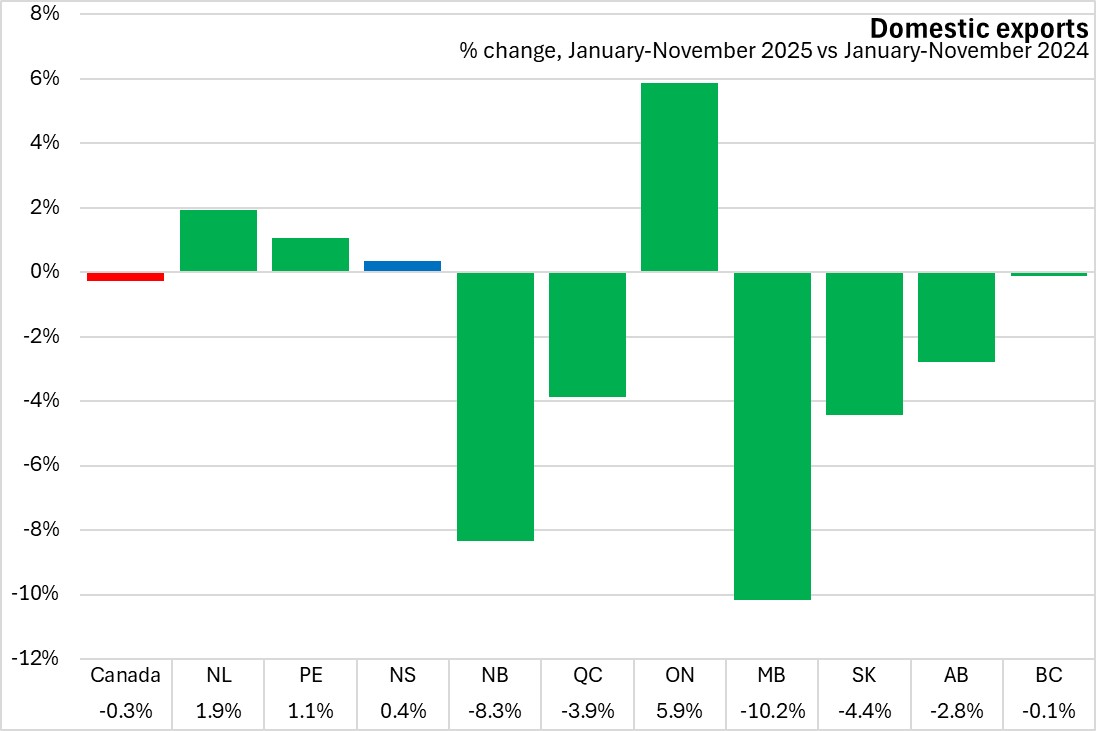
Year-to-date (January-November 2025 vs January-November 2024)
In the first eleven months of 2025 domestic exports rose 0.4% in Nova Scotia compared to the same period in 2024. Canada's exports declined 0.3% for January-November 2025, with six provinces reporting declines led by Manitoba. Ontario reported the largest year-to-date exports growth.
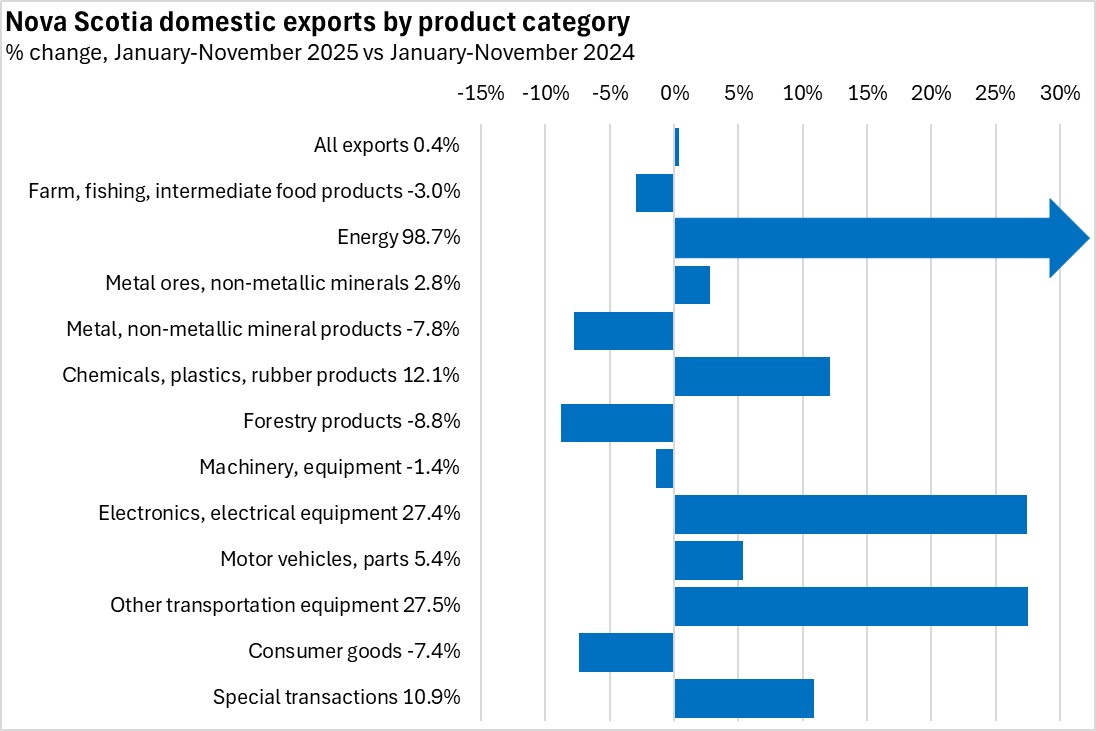
Among broad product categories, the largest categories were farm, fishing and intermediate food products, followed by motor vehicles and parts as well as consumer goods.
Nova Scotia's year-to-date domestic exports grew the most (in value terms) for motor vehicles/parts. The largest decline was among shipments of consumer goods.
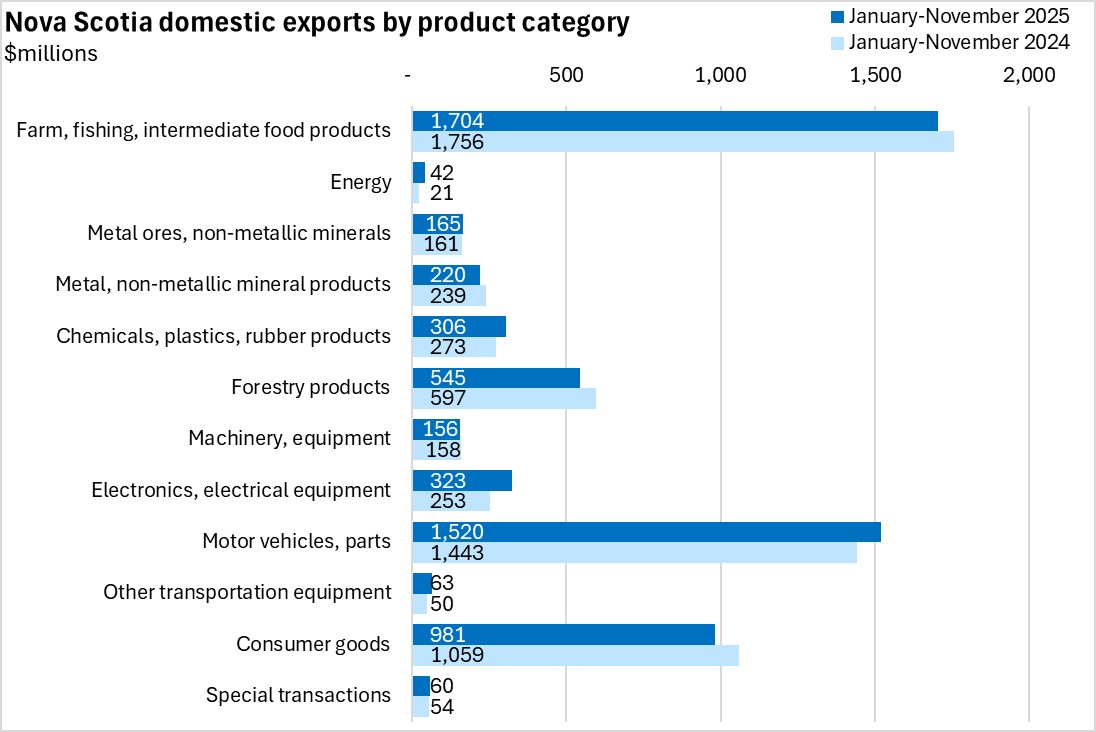
Although energy products reported the largest percentage increase in year-to-date exports, Nova Scotia's energy exports remain a small value.
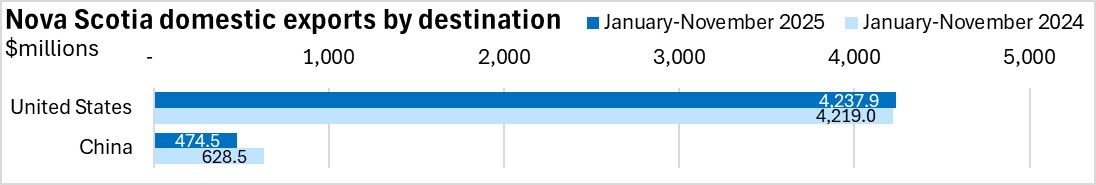
The US is by far Nova Scotia's largest destination for international goods exports. In the first eleven months of 2025, Nova Scotia exports to the United States edged up 0.4% over same period in 2024, rising to $4,237.9 million.
China is Nova Scotia's second largest export destination and exports declined 24.5% to $474.5 million in January-November 2025.
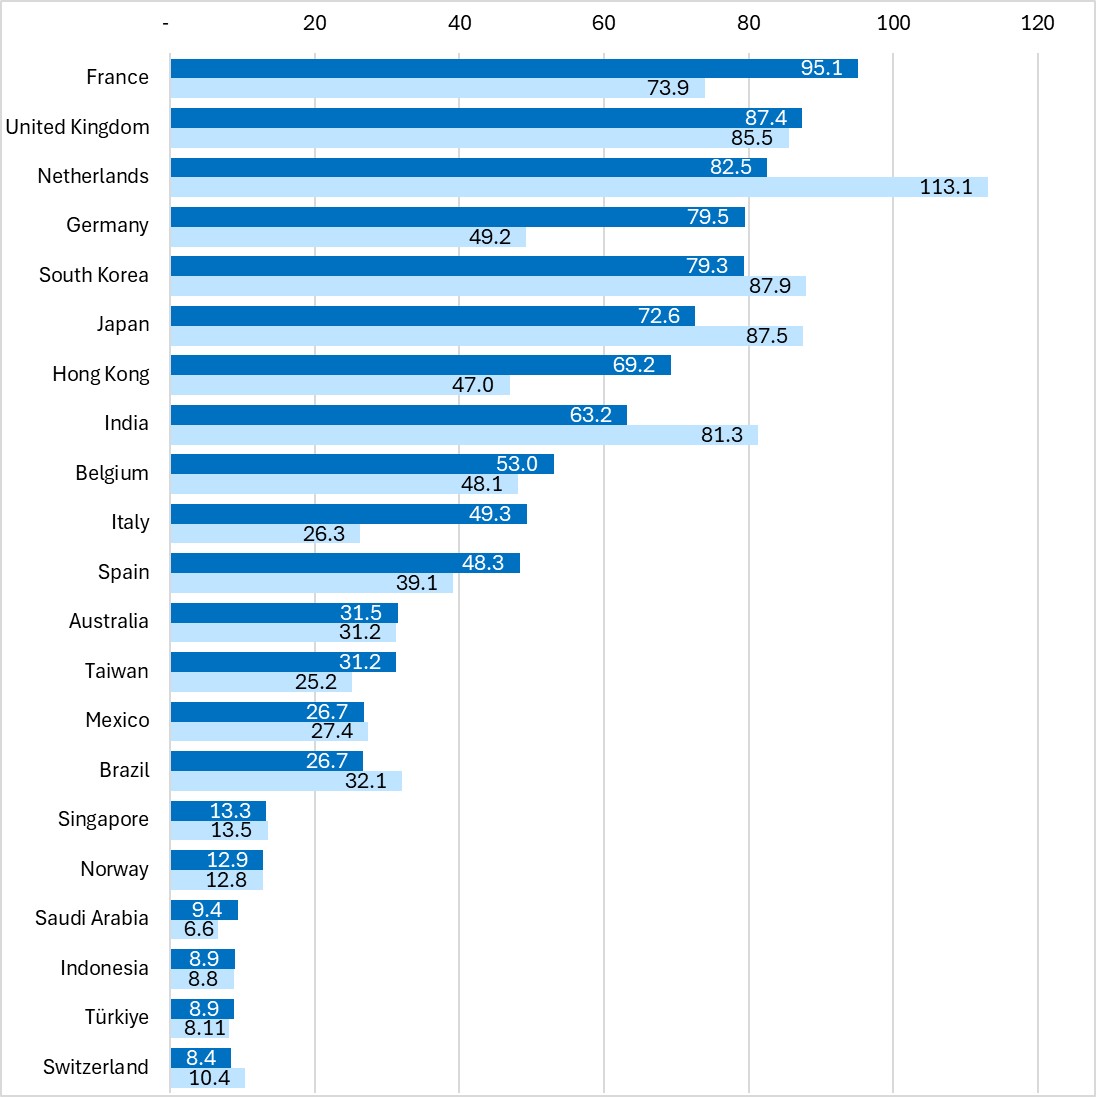
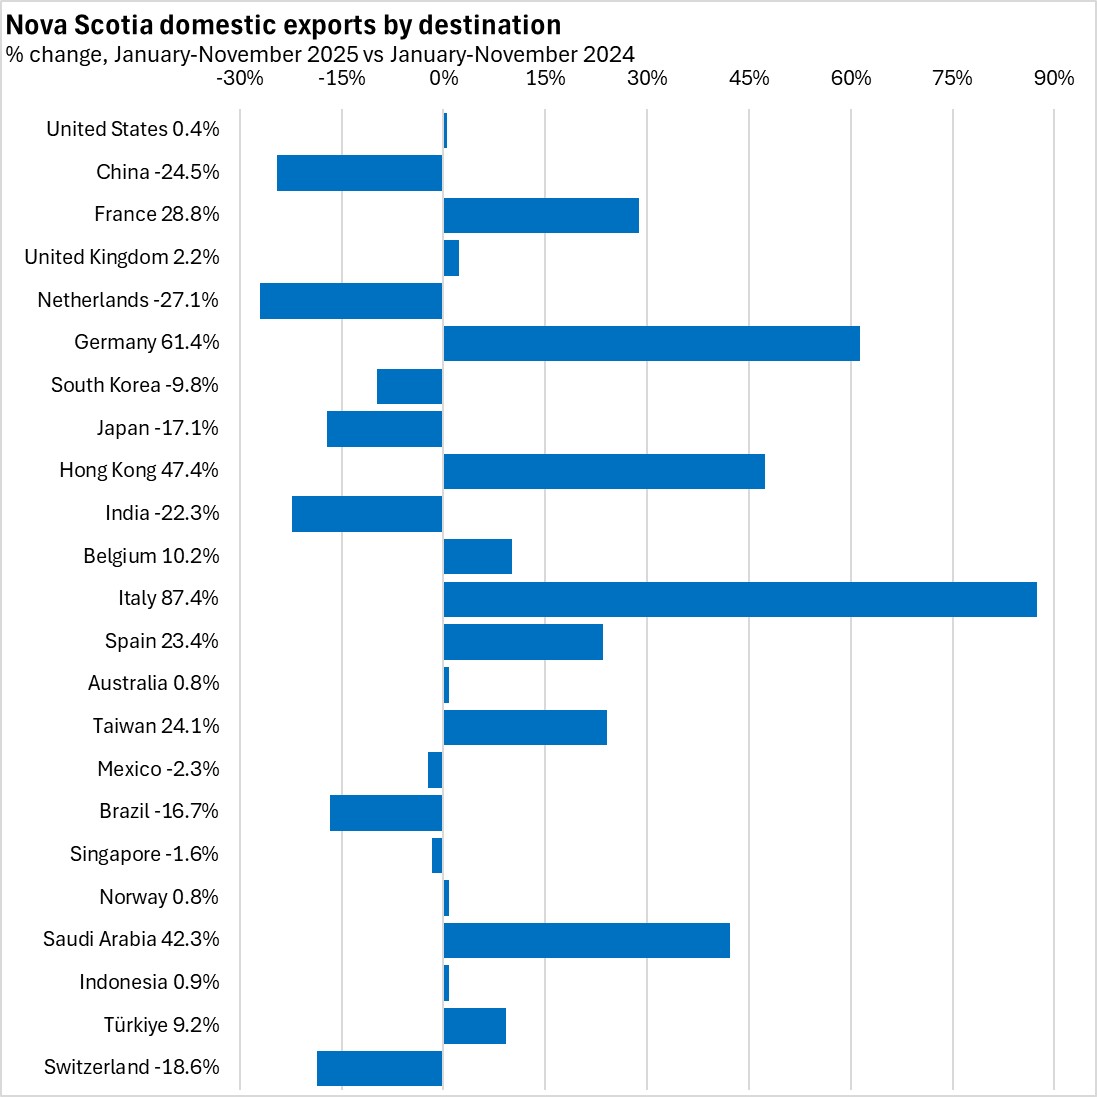
Among the other significant export destinations, year-to-date exports were up most sharply (>20%) to France, Hong Kong, Germany, Spain, Italy, Taiwan and Saudi Arabia. The largest declines (<-20%) in year-to-date exports were to China, India, Netherlands.
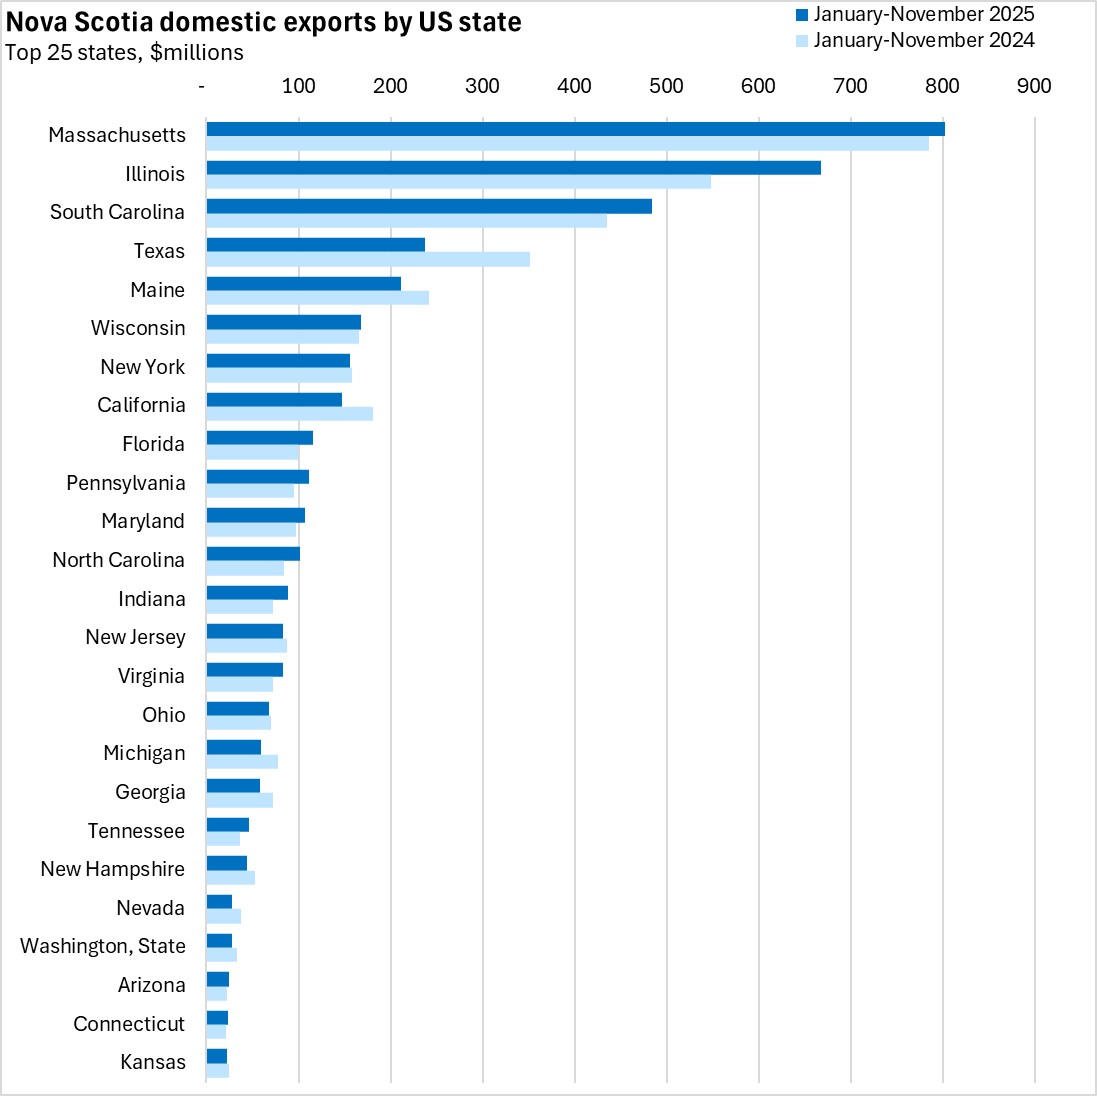
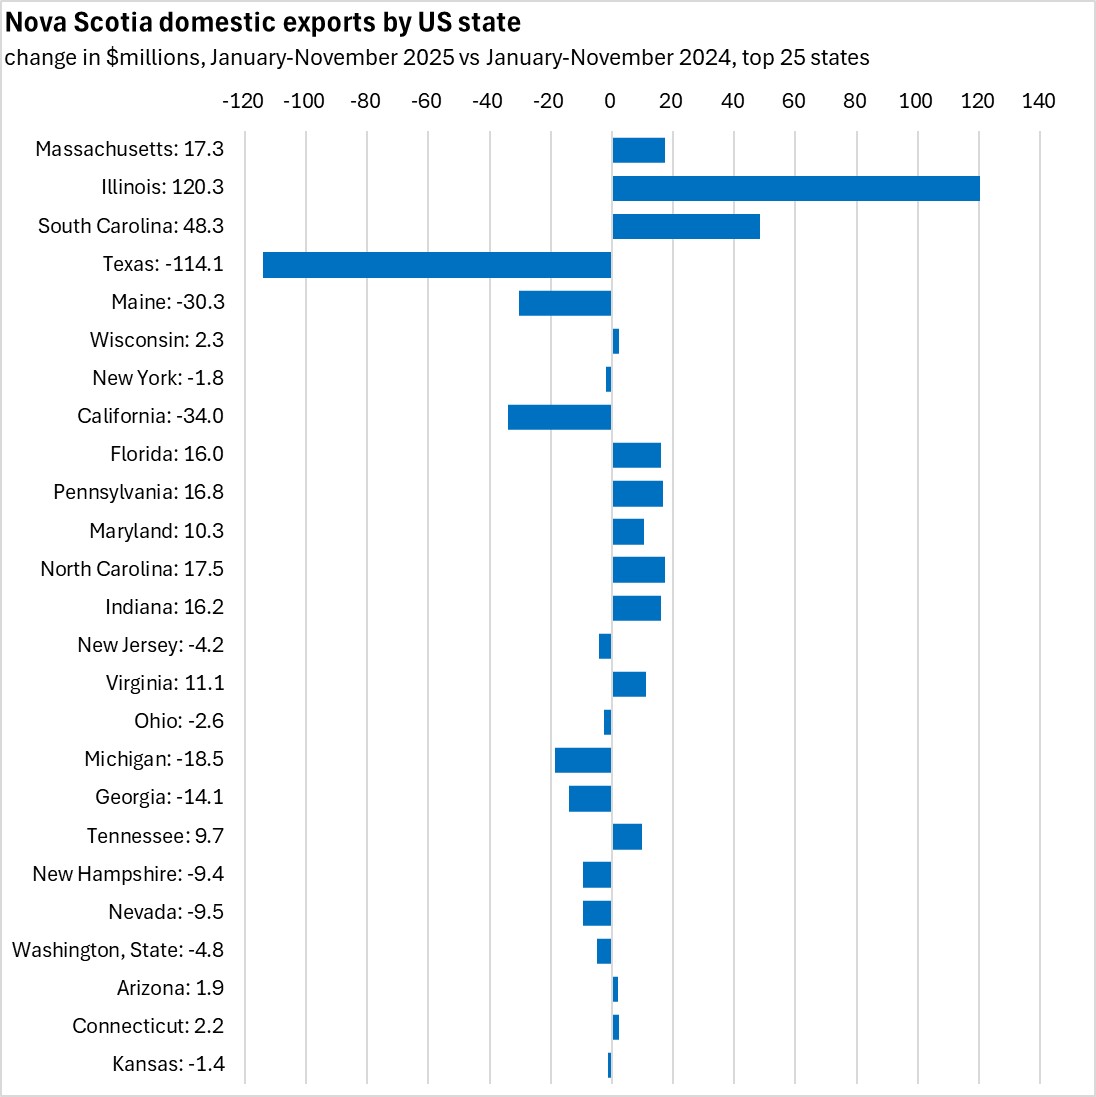
Nova Scotia's exports to the US accounted for 69.7% of exports in January-November 2025. Massachusetts, Illinois and South Carolina each had a larger export value than Nova Scotia's shipments to China in the first eleven months of 2025. Exports were up for six of Nova Scotia's top ten US state destinations; exports were down to Texas, Maine, New York and California. The largest dollar value increases were for Illinois and South Carolina.
Source: Statistics Canada. Table 12-10-0175-01 International merchandise trade by province, commodity, and Principal Trading Partners (x 1,000); Table 12-10-0099-01 Merchandise imports and exports, customs-based, by Harmonized commodity description and coding system (HS) section, Canada, provinces and territories, United States, states (x 1,000)
<--- Return to Archive