The Economics and Statistics Division maintains archives of previous publications for accountability purposes, but makes no updates to keep these documents current with the latest data revisions from Statistics Canada. As a result, information in older documents may not be accurate. Please exercise caution when referring to older documents. For the latest information and historical data, please contact the individual listed to the right.
<--- Return to Archive
For additional information relating to this article, please contact:
January 29, 2026HOUSEHOLD WEALTH, Q3 2025 Household Assets, Liabilities and Net Worth
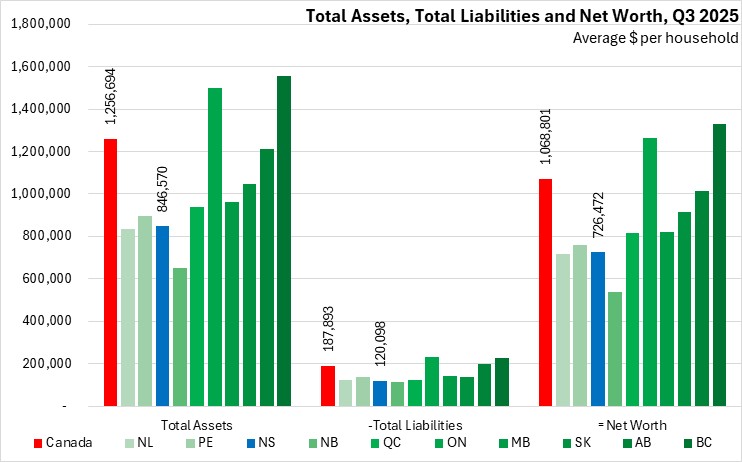
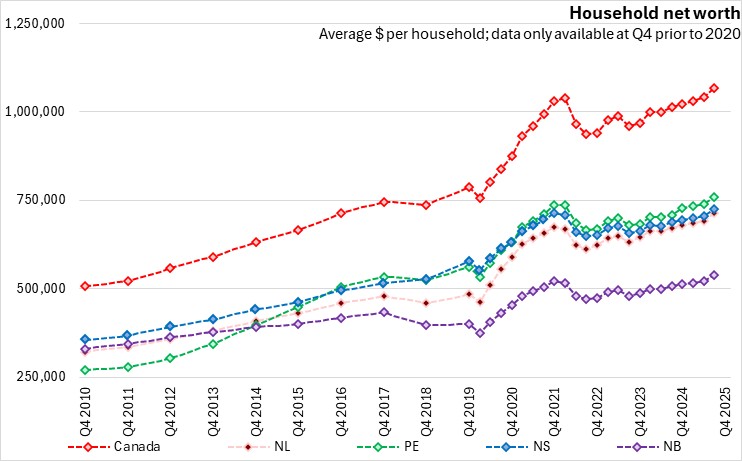
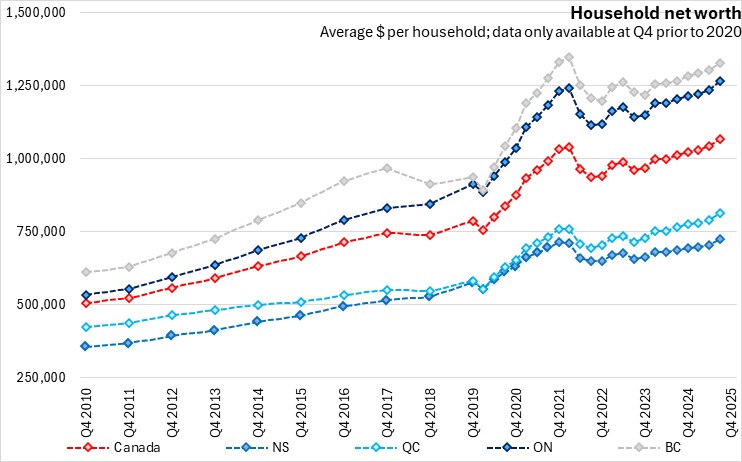
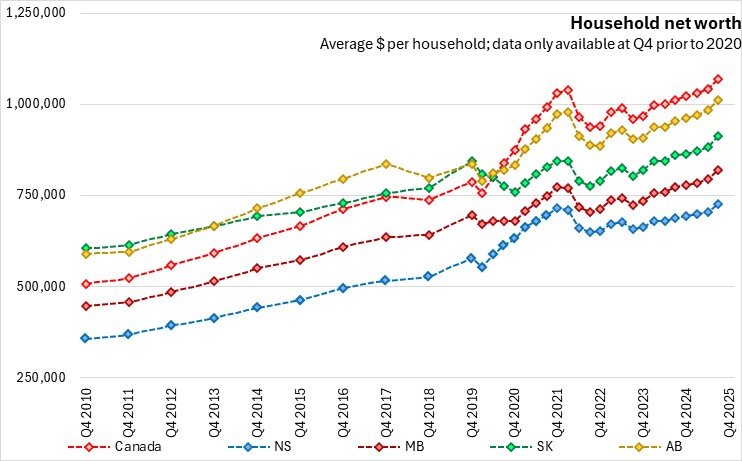
Canada’s average assets were $ 1,256,694 in Q3 2025. Nova Scotia’s assets were well below the national average at $846,570. Nova Scotia's household liabilities were $120,098 per household. As a result, Nova Scotia's net worth came to $726,472 per household, the third lowest among the provinces. British Columbia and Ontario had the highest per household wealth among all provinces while New Brunswick had the lowest net worth per household.
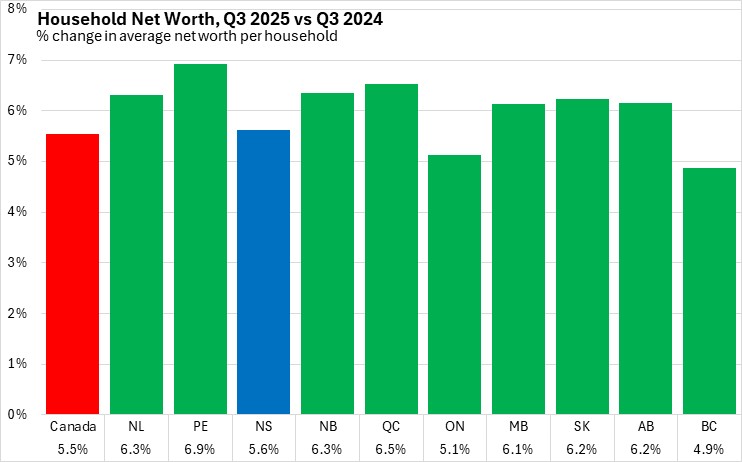
Nova Scotia's net worth increased by 5.6% from Q3 2024 to Q3 2025, faster than the national average (+5.5%). All provinces reported gains over the same quarter the previous year. Prince Edward Island reported the fastest gain in net worth, while British Columbia reported the slowest gain.
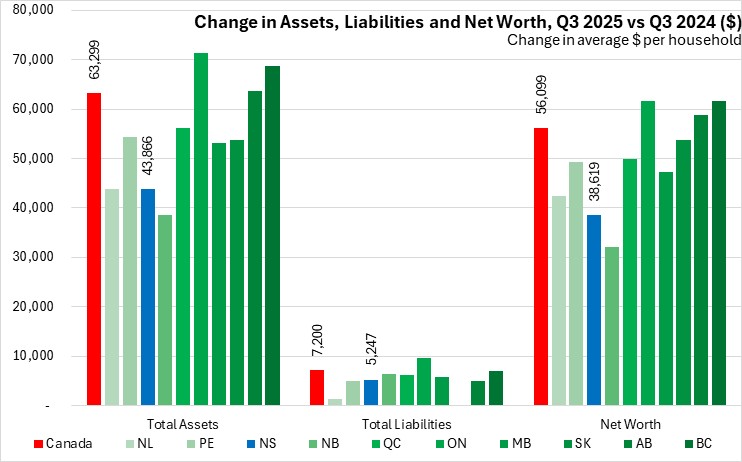
Compared to Q3 2024, national assets per household increased by $63,299 while liabilities increased by $7,200, bringing national net worth up by $56,099. Nova Scotia’s assets increased by $43,866 per household while liabilities grew by $5,247 from Q3 2024 to Q3 2025, increasing Nova Scotia's net worth per household by $38,619, the second-smallest increase among provinces.
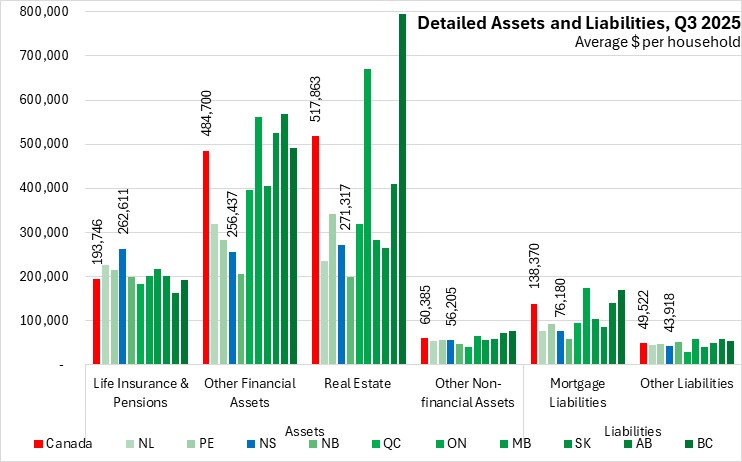
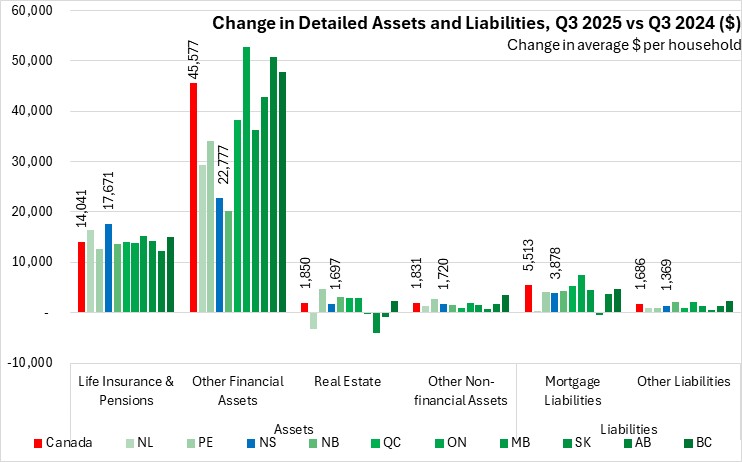
In detailed assets and liabilities Nova Scotians continued to have the highest life insurance and pension assets per household. British Columbia and Ontario had real estate assets far above the national average of $517,863.
The national level for mortgage liabilities in Q3 2025 was $138,370. Nova Scotia mortgage liabilities per household were the third lowest among provinces at $76,180. Other non-mortgage liabilities for Nova Scotia were below national average at $43,918 per household.
Nova Scotia's per household life insurance and pension assets increased by $17,671 from Q3 2024 to Q3 2025, the fastest gain among provinces. Nova Scotia’s other financial assets increased by $22,777 over this period. National life insurance/pension assets were up $14,041 per household with gains in all provinces, while other national financial assets were up by $45,577 per household with gains in all provinces (led by Ontario).
Nova Scotia’s real estate asset values increased by $1,697 per household from Q3 2024 to Q3 2025. Nationally, average real estate assets per household rose by $1,850 per household with increases in six of ten provinces, led by Prince Edward Island. Saskatchewan saw the largest decline in real estate assets.
Nova Scotia's mortgage liabilities rose by $3,878. The national average mortgage liability per household increased by $1,831. Nova Scotia's other liabilities increased by $1,369 while the national average over the four quarters increased by $1,686.
Household net worth grew in all provinces from Q2 to Q3 2025.
Source: Statistics Canada. Table 36-10-0661-01 Distributions of household economic accounts, wealth, Canada, regions and provinces, quarterly (x 1,000,000)
<--- Return to Archive