The Economics and Statistics Division maintains archives of previous publications for accountability purposes, but makes no updates to keep these documents current with the latest data revisions from Statistics Canada. As a result, information in older documents may not be accurate. Please exercise caution when referring to older documents. For the latest information and historical data, please contact the individual listed to the right.
<--- Return to Archive
For additional information relating to this article, please contact:
January 29, 2026HOUSEHOLD INCOME AND CONSUMPTION, Q3 2025 Household Income and Outlay
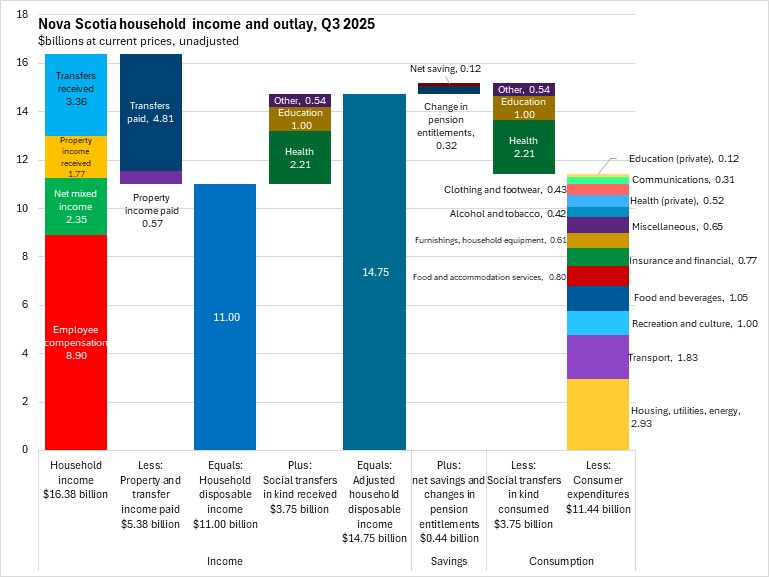
In addition to compensation of employees, household income also includes net mixed income (generated from unincorporated businesses), property income received (generated as the result of ownership of assets) and current transfers received (generally from government).
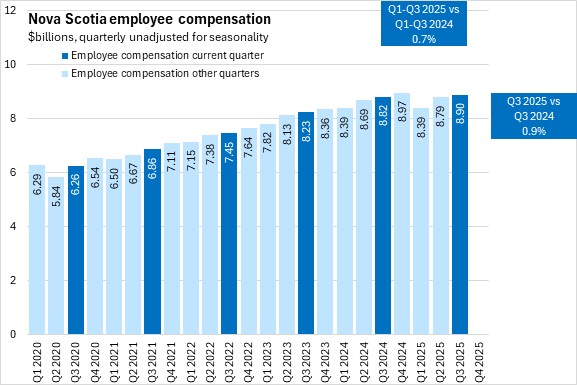
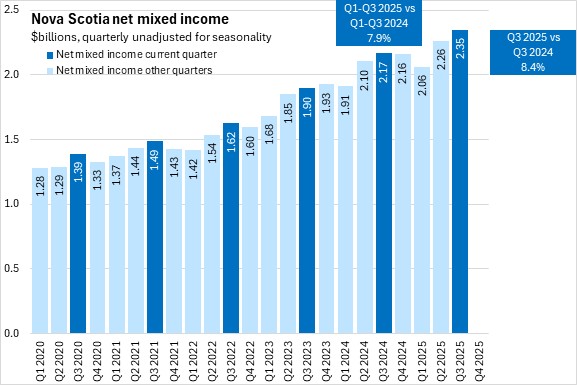
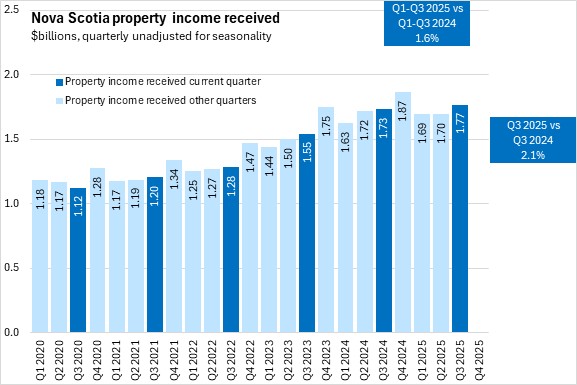
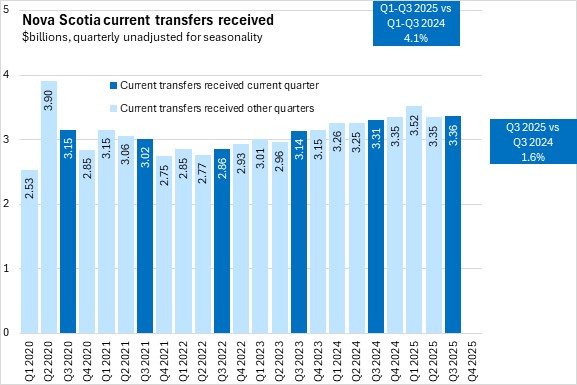
Nova Scotians received $16.38 billion in household income in Q3 2025, including $8.90 billion in employee compensation, $2.35 billion in net mixed income from unincorporated business ownership, $1.77 billion in property income receipts and $3.36 billion in current transfers received.
After paying current transfers (including income taxes) of $4.81 billion and property income of $0.57 billion, Nova Scotia disposable income was $11.00 billion in Q3 2025. Including the $3.75 billion value of social transfers in kind received from governments or non-profits in the form of services provided for households, Nova Scotia had adjusted disposable income of $14.75 billion.
The consumption of social transfers in kind matches the value of social transfers received ($3.75 billion), while households spent $11.44 billion on consumer expenditures. The value of household final consumption expenditures and social transfers in kind was greater than the adjusted household disposable income, with the excess coming from negative net savings of $0.12 billion in household savings and a $0.32 billion change in pension entitlements.
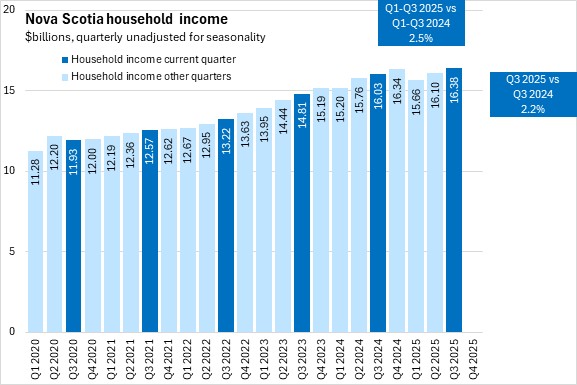
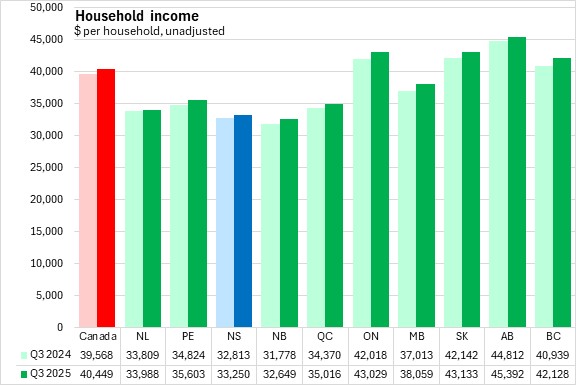
Household income
Note: prior values of household income and consumption have been revised back to 2021 to align with macroeconomic accounts benchmarks. Of note, there were larger upward revisions to 2024 levels for employee compensation (+2.9%) and property income receipts (+2.0%) while revisions to net mixed income (+0.5%) and current transfer receipts (-0.7%) were smaller.
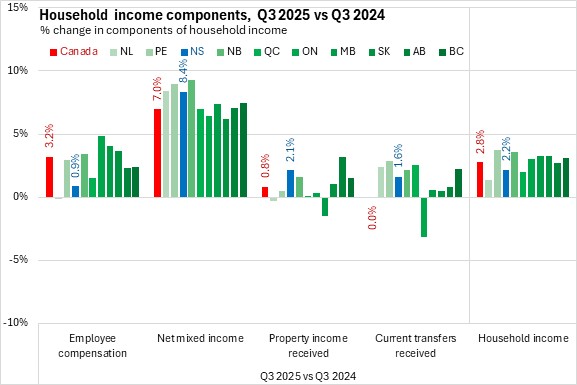
Nova Scotia's overall household income growth from Q3 2024 to Q3 2025 was 2.2%, which was below the national growth of 2.8%. All provinces reported rising household income year-over-year, with the fastest increase in Prince Edward Island and the slowest gain in Newfoundland and Labrador.
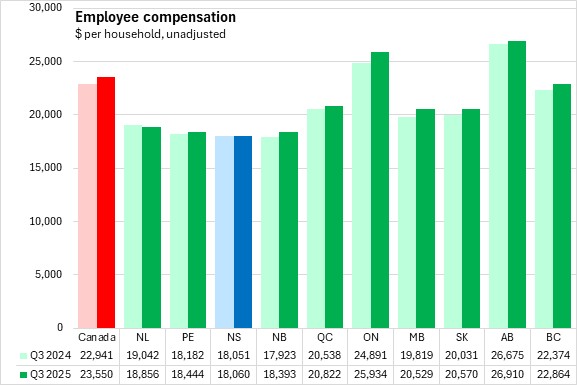
Nova Scotia's rising household income reflected employee compensation growth of 0.9%. Nationally, employee compensation was up 3.2% year-over-year with gains in all provinces except Newfoundland and Labrador. Ontario had the fastest year-over-year rise in employee compensation.
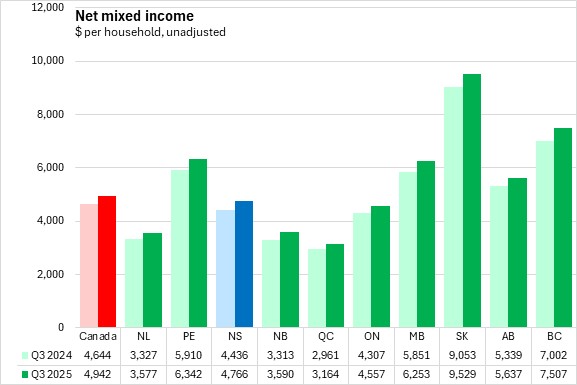
Nova Scotia's net mixed income from unincorporated businesses grew 8.4% from Q3 2024 to Q3 2025, faster than the national average pace of 7.0%. New Brunswick reported the fastest growth in net mixed income (slowest: Saskatchewan).
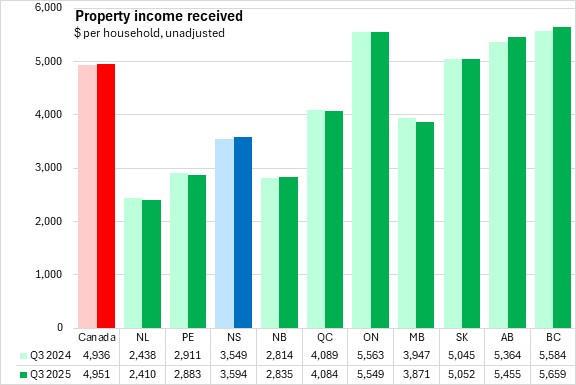
Nova Scotia's property income receipts grew 2.1% while national property income receipts were up 0.8%. All provinces except Newfoundland and Labrador and Manitoba reported increases in property income receipts from Q3 2024 to Q3 2025. Alberta reported the strongest gain in property income receipts over this period.
Current transfers received were up 1.6% in Nova Scotia from Q3 2024 to Q3 2025. Transfers were little changed nationally despite increases in all provinces except Ontario (fastest: Prince Edward Island).
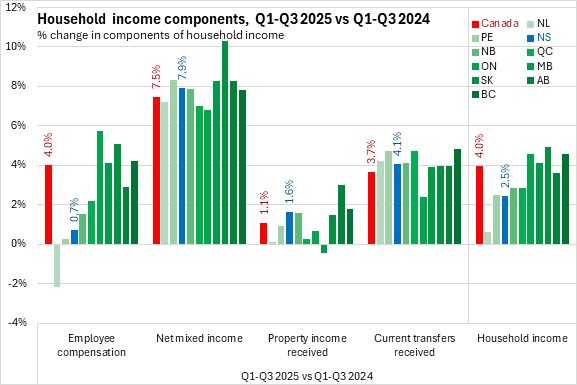
Through the first three quarters of 2025, Nova Scotia's household income was up 2.5% compared with the same period in 2024. This was slower than the national pace of growth (4.0%). Saskatchewan had the fastest year-to-date growth in household income (slowest: Newfoundland and Labrador).
Nova Scotia's employee compensation grew 0.7% year-to-date, well behind the national pace of 4.0%. Employee compensation was up in all provinces except Newfoundland and Labrador (fastest: Ontario).
Net mixed income was up 7.9% in Nova Scotia comparing Q1-Q3 2025 with the same period in 2024. National net mixed income was up 7.5% with gains in all provinces. Saskatchewan reported the fastest growth in net mixed income, but this province has historically more volatile changes in net mixed income. Ontario reported the slowest growth in net mixed income.
Property income receipts were up 1.6% year-to-date in Nova Scotia, outpacing the national gain of 1.1%. Property income receipts were up in all provinces except Manitoba (fastest gain: Alberta).
Current transfer receipts were up 4.1% year-to-date in Nova Scotia. Nationally, current transfer income was up 3.7% year-to-date with the fastest gains in Prince Edward Island, Québec and British Columbia.
In Q3 2025, Nova Scotia's household income was $33,250 per household or 82.2% of the national average ($40,449). The highest income per household was in Alberta and lowest in New Brunswick (followed by Nova Scotia).
Nova Scotia's employee compensation $18,060 per household, amounting to 76.7% of the national average per household ($23,550) in Q3 2025. This was the lowest employee compensation per household among provinces. Alberta reported the highest employee compensation per household.
Nova Scotia's net mixed income generated by unincorporated businesses amounted to $4,766 per household, which was 96.4% of the national average per household of $4,942. Across Canada, the highest values of net mixed income per household were in Saskatchewan (though net mixed income is more volatile in this province). Québec reported the lowest net mixed income per household.
Nova Scotia property income received in Q3 2025 was $3,594 per household, which was 72.6% of the national average ($4,951 per household). The highest property income values were in British Columbia, Alberta, and Ontario. The lowest property income per household was in Newfoundland and Labrador.
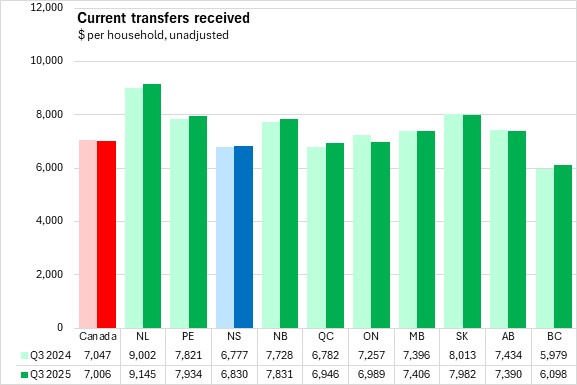
Current transfers received in Nova Scotia were $6,830 per household in Q3 2025. Current transfers received in Nova Scotia were 97.5% of the national average per household ($7,006). Transfers per household were highest in Newfoundland and Labrador and lowest in British Columbia.
Household Consumer Expenditures
Note: as with household income, consumer expenditures have been historically revised for 2021-2024 to align with macroeconomic accounts. Both consumer expenditures (+2.9%) and social transfers in kind (-9.7%) had significant revisions in 2024.
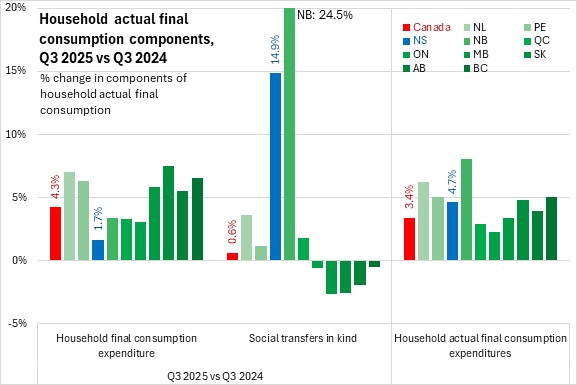
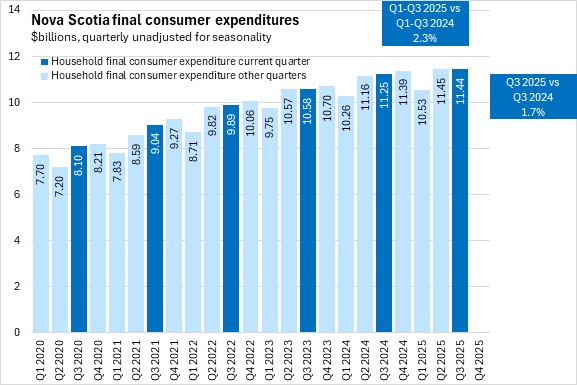
Comparing Q3 2025 with Q3 2024, Nova Scotia's household consumer expenditures increased by 1.7%, the slowest increase among provinces. Across Canada year-over-year household consumer expenditures were up 4.3% with the strongest gain in Saskatchewan.
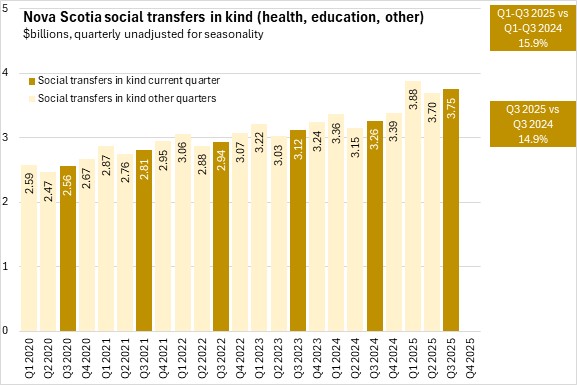
Social transfers in kind refer to services that are provided for the benefit of households but are paid for by governments and non-profits. These are primarily health and education expenditures, which add to private expenditures made on these services. Social transfers in kind increased by 14.9% in Nova Scotia from Q3 2024 to Q3 2025, behind only New Brunswick for fastest growth among provinces. Social transfers in kind were up in Québec and the Atlantic provinces while they were down for Ontario and the four Western provinces. Nationally, social transfers in kind rose 0.6%.
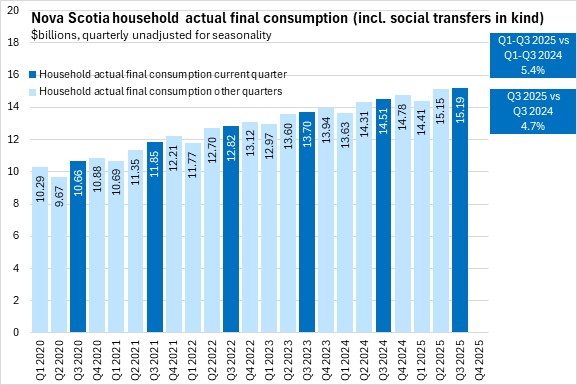
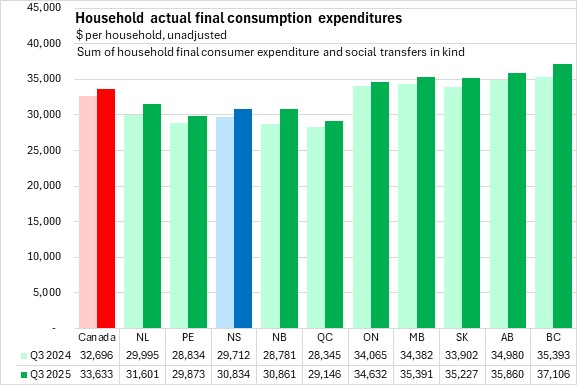
The sum of household final consumer expenditures and social transfers in kind is termed 'household actual final consumption expenditures', which reflects the benefits to households from both private expenditures as well as services provided by governments and non-profits. Combining these two components led to year-over-year household actual final consumption growth of 4.7% for Nova Scotia, which outpaced the national gain of 3.4%. All provinces reported increasing household actual final consumption expenditures from Q3 2024 to Q3 2025, with New Brunswick reporting faster growth due to social transfers in kind. Ontario reported the slowest growth due to the largest decline in social transfers in kind.
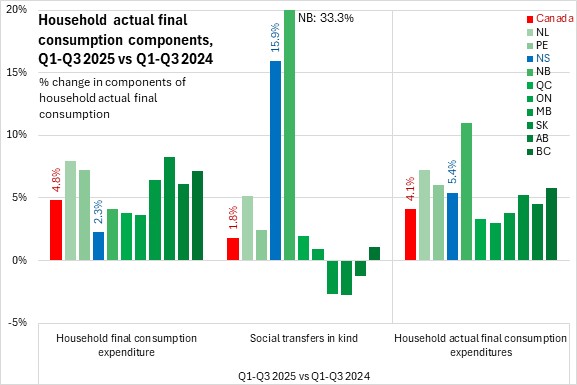
Through the first three quarters of the year, Nova Scotia's household final consumption expenditures were up 2.3% - the slowest growth among provinces. National household final consumption expenditures were up 4.8% with the fastest growth in Saskatchewan.
Nova Scotia's social transfers in kind were up 15.9% year-to-date, the second largest year-to-date gain after New Brunswick. National social transfers in kind rose 1.8% year-to-date with declines in all three prairie provinces.
Overall, Nova Scotia's household actual final consumption expenditures (combining households' market final consumption expenditures with social transfers in kind) were up 5.4% - outpacing the 4.1% national average. All provinces reported growth in household final consumption expenditures, led by New Brunswick (slowest: Ontario).
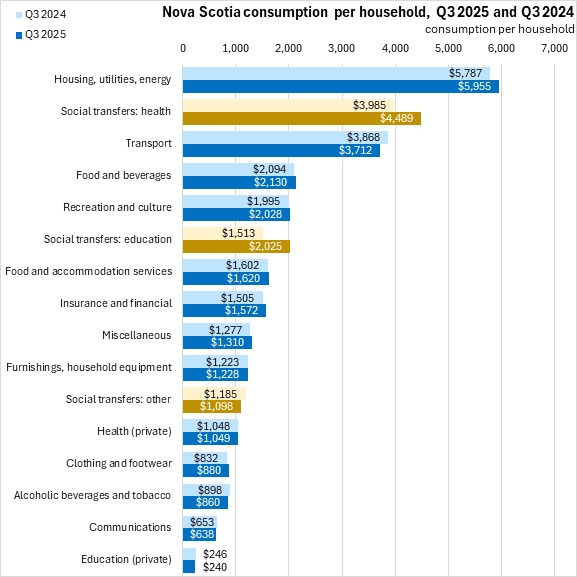
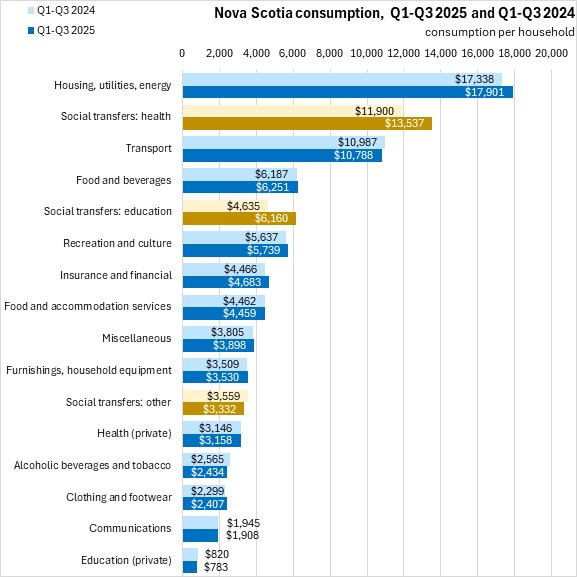
Among the categories of actual final consumption expenditures, housing/utilities/energy made up the largest category of household consumer expenditures, followed by social transfers in kind for health care, transportation, food/beverages, recreation/culture and social transfers in kind for education.
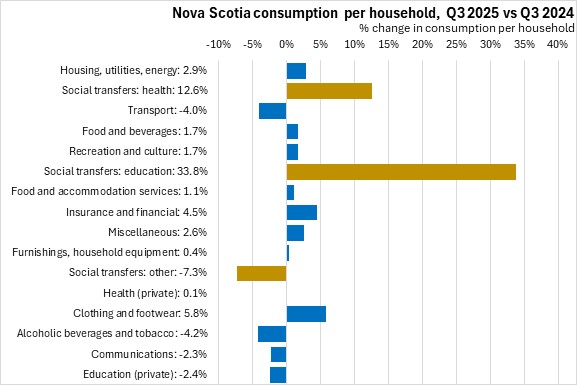
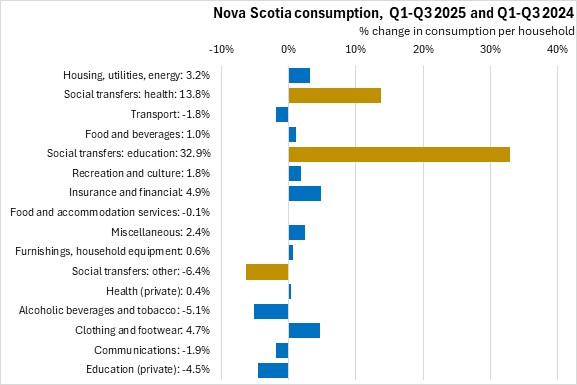
From Q3 2024 to Q3 2025, growth in per household spending was fastest in social transfers for education as well as social transfers for health. Clothing and footwear had the fastest household consumer expenditure growth. Expenditures were down for transportation, other social transfers in kind, alcoholic beverages/tobacco, private (market-provided) education services and communications.
Through the first three quarters of 2025, housing/energy/utilities, social transfers for health and transportation were the largest categories of household expenditure.
Year-to-date household expenditures for health and education social transfers grew faster than for other categories. Expenditures were down for private (market-provided) education services, communications, alcoholic beverages/tobacco products, transportation and other social transfers in kind.
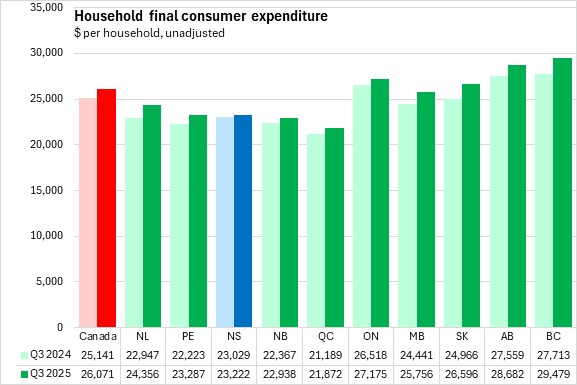
Nova Scotia's final consumer expenditures (paid for private by households) amounted $23,222 per household in Q3 2025; 89.1% of the national average per household. Across Canada, final consumer expenditures per household were $26,071 with the highest values in British Columbia and Alberta and the lowest value in Québec.
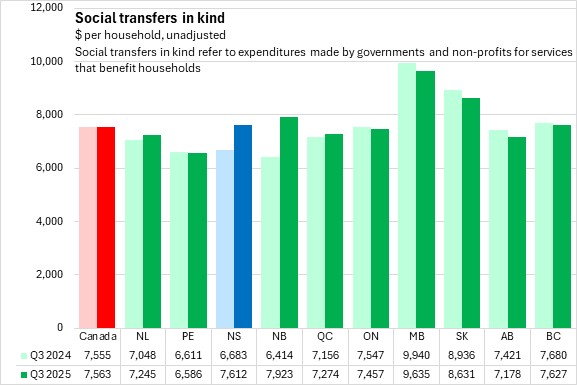
In Q3 2025, Nova Scotian households received $7,612 per household worth of social transfers in kind (100.6% of the national average per household of $7,563). Across Canada, social transfers in kind were highest in Manitoba and lowest in Prince Edward Island.
Nova Scotia's household actual final consumption expenditures in Q3 2025 were $30,834 per household (91.7% of the national average per household). National household actual final consumption expenditures were $33,633 per household with the highest value in British Columbia. The lowest household actual final consumption expenditures were in Québec.
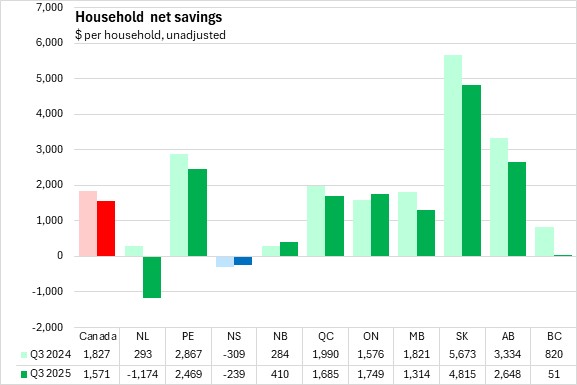
In Q3 2025, Nova Scotia's net savings per household were -$239, improving from the net savings of -$309 per household in Q3 2024. National net savings fell to $1,571 per household with negative net savings in Newfoundland and Labrador and Nova Scotia. Saskatchewan reported the largest positive net savings.
Source: Statistics Canada. Table 36-10-0663-01 Distributions of household economic accounts, income, consumption and saving, Canada, provinces and territories, quarterly (x 1,000,000)
<--- Return to Archive