The Economics and Statistics Division maintains archives of previous publications for accountability purposes, but makes no updates to keep these documents current with the latest data revisions from Statistics Canada. As a result, information in older documents may not be accurate. Please exercise caution when referring to older documents. For the latest information and historical data, please contact the individual listed to the right.
<--- Return to Archive
For additional information relating to this article, please contact:
February 23, 2026US PERSONAL INCOME AND OUTLAY, DECEMBER AND ANNUAL 2025 Month over month (December 2025 vs November 2025, seasonally adjusted annualized rates)
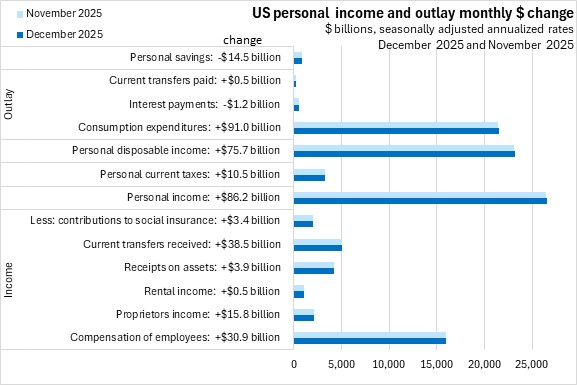
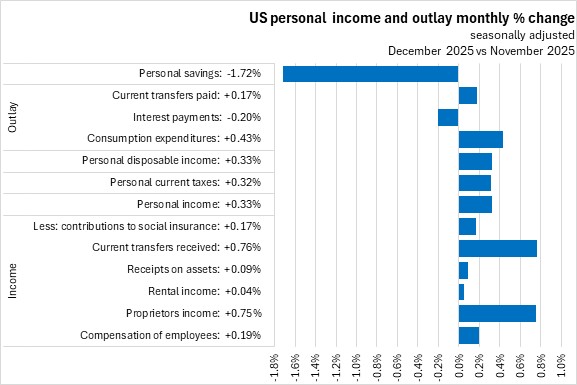
US personal income increased by $86.2 billion (+0.33%) from November to December. Employee compensation was up $30.9 billion (+0.19%). Personal disposable income was up $75.7 billion (+0.33%) while personal consumption expenditures (PCE) increased by $91.0 billion (+0.43%). US personal savings continued to decrease by falling $14.5 billion (-1.72%).
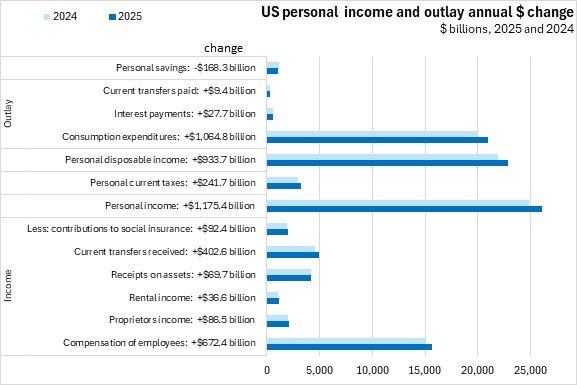
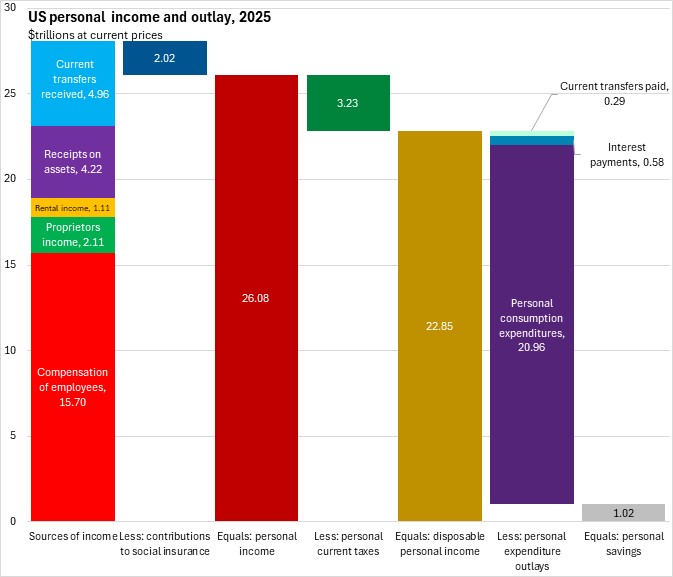
US personal income is calculated as the sum of employee compensation ($15.97 trillion), proprietors' income ($2.12 trillion), rental income ($1.11 trillion), receipts on assets ($4.25 trillion) and current transfers received ($5.11 trillion), less contributions to social insurance programs ($2.05 trillion). Personal income ($26.51 trillion) less personal current taxes ($3.32 trillion) equals disposable income ($23.19 trillion).
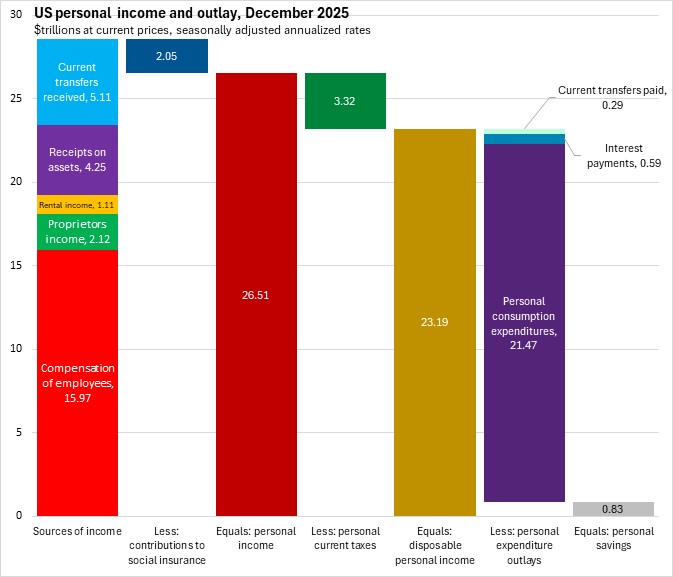
The outlay of US personal disposable income consists of personal consumption expenditures ($21.47 trillion), interest payments ($0.59 trillion) and current transfers paid ($0.29 trillion) with personal savings ($0.83 trillion) accounting for the remaining amount.
Trends
Both US personal income and consumer expenditures have each reported seven consecutive months of gains. However, consumer spending growth has outpaced personal income growth in each of the last seven months, resulting in steady declines for personal savings.
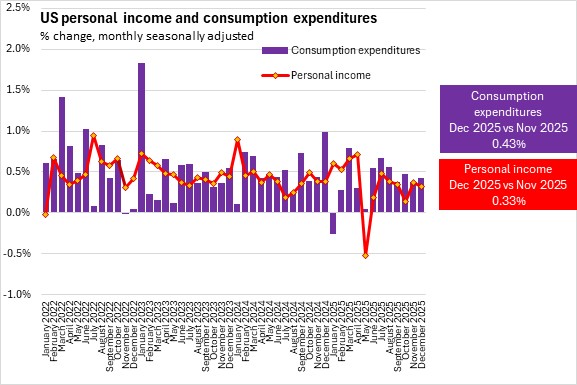
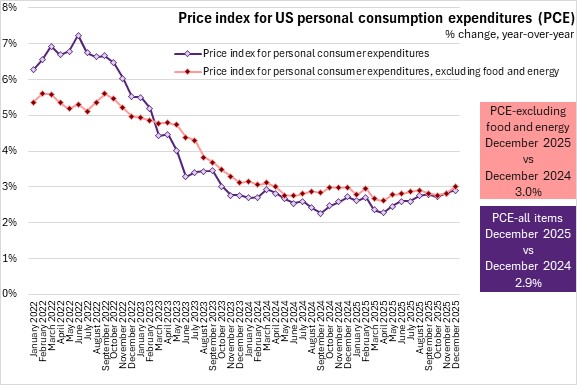
Growth in the price index for personal consumption expenditures (all items) was 2.9% year-over-year in December. Year-over-year growth in the price index for all items excluding food and energy was 3.0%. Inflation for all items excluding food and energy has outpaced all items PCE inflation in every month since February 2023.
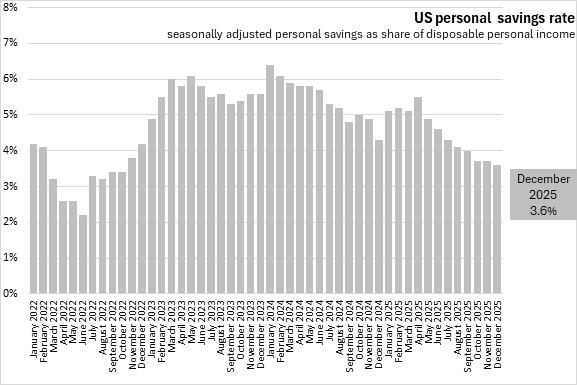
The US personal savings rate contracted to 3.6% of disposable personal income in December, the seventh decline in the last eight months.
Annual (2025 vs 2024)
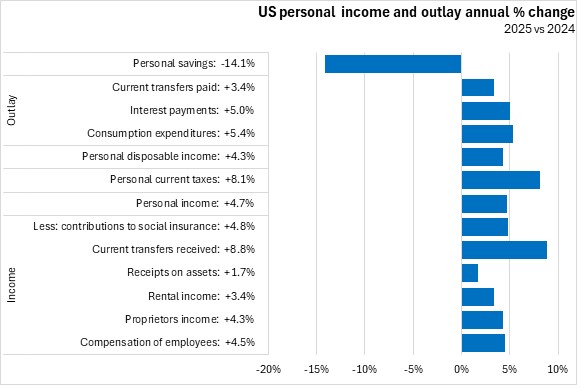
In 2025, US personal income increased by 4.7% over its value in 2024. There were gains from all income sources led by growth in current transfers received (+8.8%). Personal consumption expenditures grew by 5.4%. Personal savings declined 14.1%.
U.S. Bureau of Economic Analysis, "Table 2.6. Personal Income and Its Disposition, Monthly"; Data retrieved Federal Bank of St Louis
<--- Return to Archive