The Economics and Statistics Division maintains archives of previous publications for accountability purposes, but makes no updates to keep these documents current with the latest data revisions from Statistics Canada. As a result, information in older documents may not be accurate. Please exercise caution when referring to older documents. For the latest information and historical data, please contact the individual listed to the right.
<--- Return to Archive
For additional information relating to this article, please contact:
March 09, 2026VISITOR TRAVEL SURVEY, Q3 2025 Year-over-year (Q3 2025 vs Q3 2024)
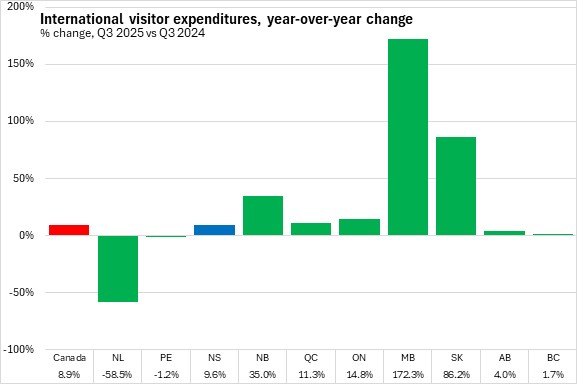
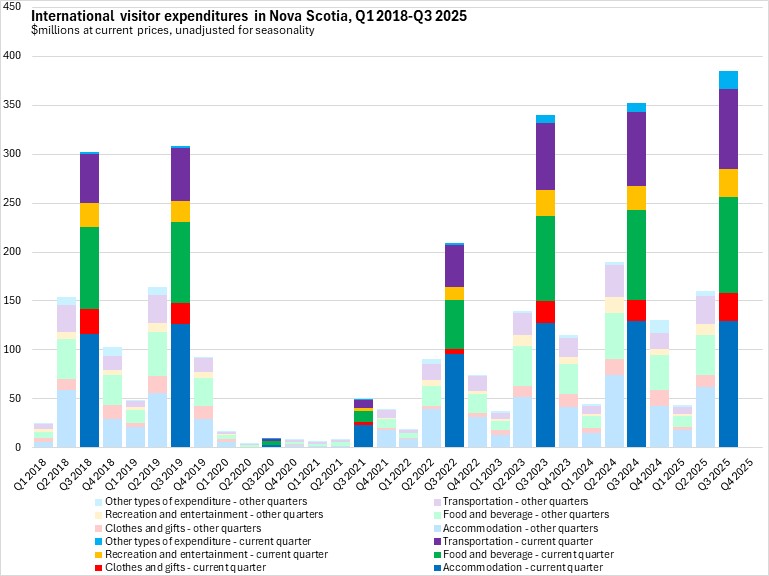
International visitors to Nova Scotia spent $385.4 million in Q3 2025. Expenditures by visitors from the US were the majority, accounting for 68.5% of total visitor spending in Nova Scotia. International visitor expenditures were up 9.6% from the same period in 2024. Across Canada, international visitor expenditures were up 8.9% with gains in all provinces except Newfoundland and Labrador and Prince Edward Island. Manitoba and Saskatchewan reported the largest gains in international visitor expenditures.
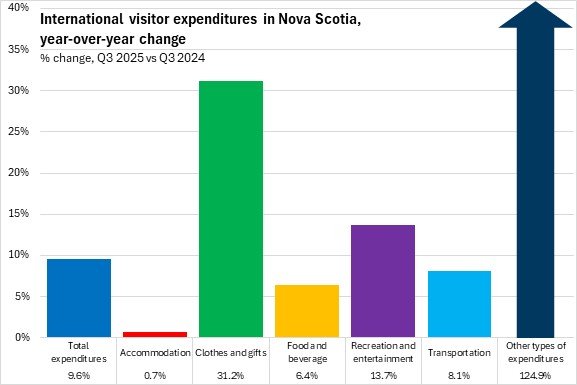
Other types of expenditures reported the largest percentage gain in Nova Scotia's international visitor expenditures, followed by clothes and gifts. Gains were slower for international visitor spending on Nova Scotia accommodations in Q3 2025 compared to Q3 2024.
Year-to-date (Q1-Q3 2025 vs Q1-Q3 2024)
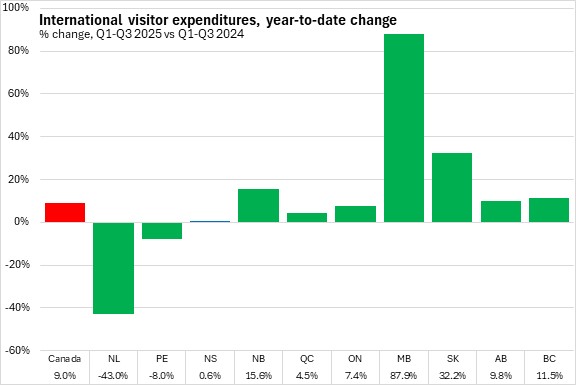
International visitor expenditures in Nova Scotia edged up 0.6% in the first three quarters of the year compared to the same period in 2024. Nationally, visitor expenditure increased 9.0% with gains in all provinces except Newfoundland and Labrador and Prince Edward Island. Manitoba had the largest gain in international visitor expenditures.
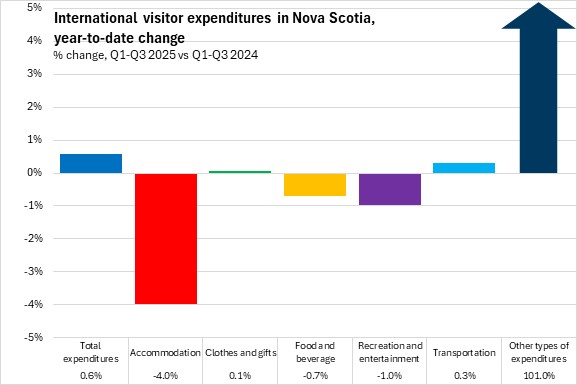
Other types of expenditures reported the only substantial gain in Q1-Q3 2025 compared to Q1-Q3 2024 along with small rises in clothes/gifts and transportation. Year-to-date international expenditures were down for accommodations, food/beverage and recreation/entertainment.
Note: during the pandemic, Visitor Travel Survey collections were suspended from March 2020 to Q1 2023. Data were modelled using Frontier Counts estimates until the Visitor Travel Survey resumed in Q3 2023. Comparison with modelled data should be interpreted with caution due to the different methods used.
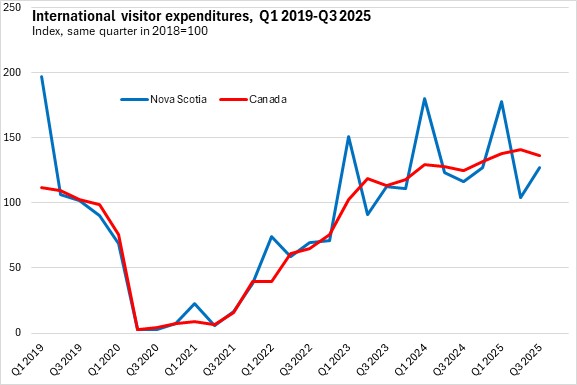
International travel expenditures have largely recovered to pre-pandemic levels in the last year, though some of this recovery includes the effects of rising prices. After a peak in the first quarter of 2024, international expenditures started to decline in Nova Scotia, before again rising in Q1 2025. In Q2 and Q3 2025, Nova Scotia's trend in international visitor expenditures fell below the national average. Canada's international expenditures continued trending up, but at a slower pace.
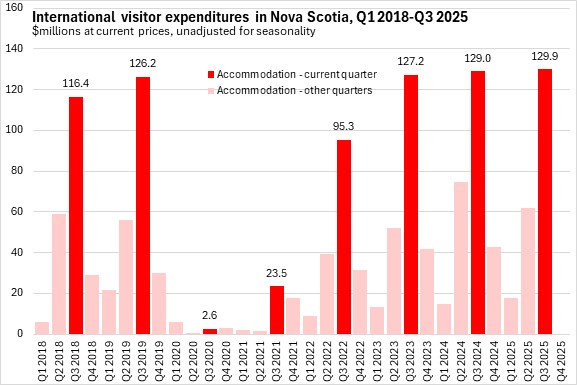
In unadjusted results by quarter, Nova Scotia's accommodations expenditures by international visitors were above previous levels for Q3.
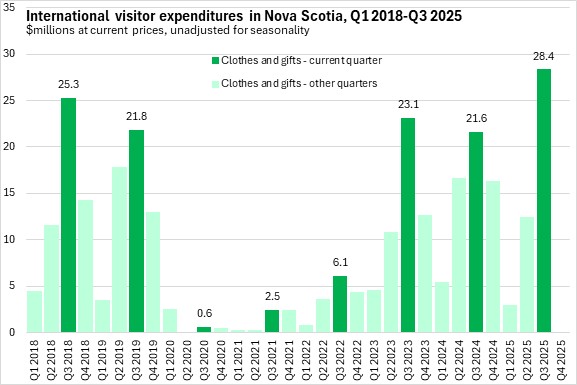
Clothing and gift spending by international visitors to Nova Scotia were substantially higher than previous Q3 results.
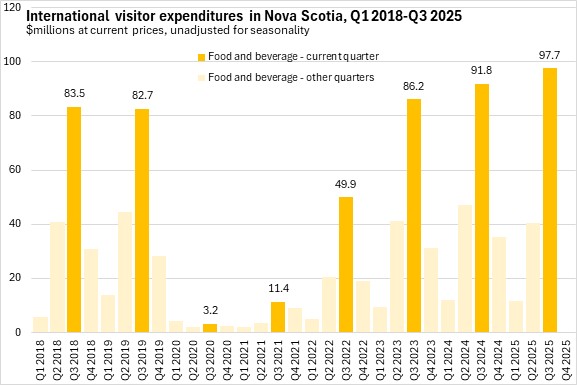
Food and beverage spending in Nova Scotia by international visitors continued to rise at a steady pace in Q3 2025.
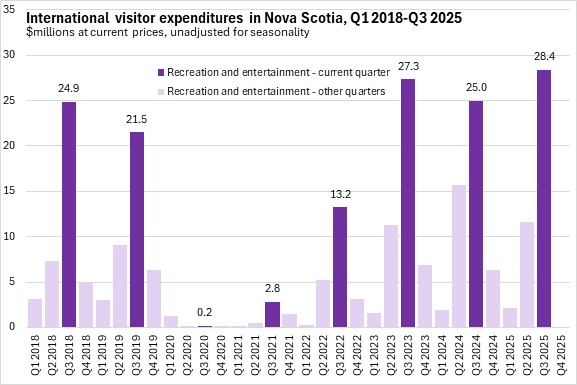
Recreation and entertainment spending in Nova Scotia by international visitors rebounded from a Q3 decline in 2024.
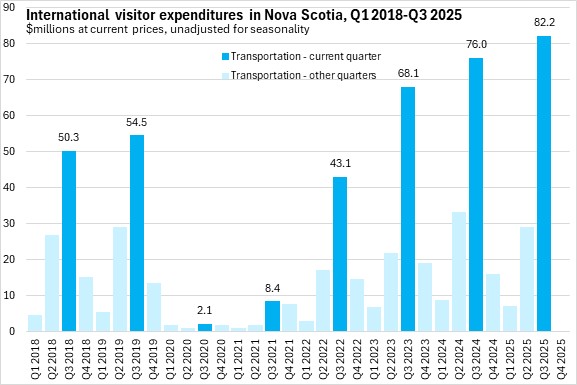
Expenditures on transportation (including higher fuel prices) continued year-over-year growth in Q3 2025.
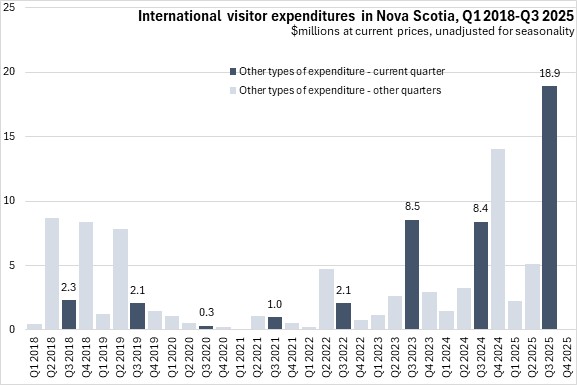
Other international visitor spending in Nova Scotia was more than double Q3 levels from 2023 and 2024.
Overall international visitor expenditures exceeded pre-pandemic levels.
Notes: Statistics Canada’s Visitor Travel Survey (VTS) provides quarterly statistics on United States and overseas visitors to Canada, their characteristics of travel and their spending levels. From the first quarter of 2018 to the first quarter of 2020, spending data were derived from a Small Area Estimation model. Collection activity related to the VTS was suspended in March 2020 because of the COVID-19 pandemic; estimates from the second quarter of 2020 to the first quarter of 2023 were produced using a model based on historical 2019 VTS estimates combined with alternate data and adjusted with Frontier Counts results. As of April 2023, VTS collection partially resumed, with the Air Exit Survey (AES) restarting in five major Canadian airports. The non-air component of VTS (visitors arriving by modes of transportation other than air) uses modelled data based on historical VTS estimates while the air component is based on estimates obtained from AES survey results.
The Frontier Counts program at Statistics Canada receives administrative data from the Canada Border Services Agency (CBSA) on all international arrivals into the country, consisting of both non-resident visitors to Canada and Canadian residents returning from abroad.
Source: Statistics Canada. Table 24-10-0066-01 Visits, nights and spending for visitors to Canada by geography of visit, residency and mode of transport (x 1,000)
<--- Return to Archive