The Economics and Statistics Division maintains archives of previous publications for accountability purposes, but makes no updates to keep these documents current with the latest data revisions from Statistics Canada. As a result, information in older documents may not be accurate. Please exercise caution when referring to older documents. For the latest information and historical data, please contact the individual listed to the right.
<--- Return to Archive
For additional information relating to this article, please contact:
March 13, 2026INFRASTRUCTURE ECONOMIC ACCOUNTS, [PRELIMINARY] 2025 Statistics Canada has released preliminary infrastructure economic accounts for 2025. These data report the stock of infrastructure, which is diminished by estimated depreciation and increased by investment in new capital. The data are reported for both public and private owners of infrastructure as well as by the type of asset and public service function it performs (categorized in the broad Classification of Functions of Government). Except where public and private infrastructure are explicitly reported, this analysis focuses primarily on infrastructure by function performed, which includes both public and private infrastructure.
At the end of 2025, Nova Scotia's infrastructure net capital stock was $26.2 billion or $23,934 per person - the second lowest per capita stock of infrastructure after Prince Edward Island. Nationally, infrastructure net capital stock was $1,433 billion or $34,410 per person. Newfoundland and Labrador had the highest per capita infrastructure stock at the end of 2025.
Public infrastructure assets make up 64.8% of infrastructure in Nova Scotia - the second lowest public share among provinces (only ahead of Alberta).
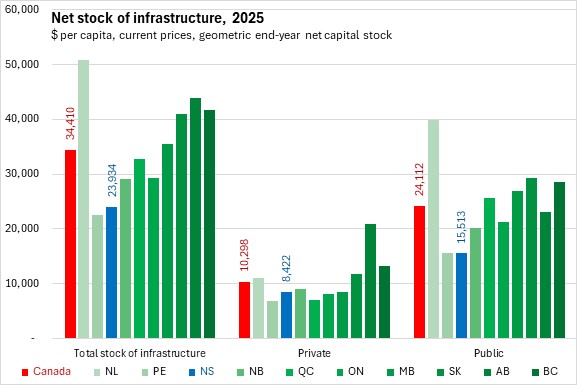
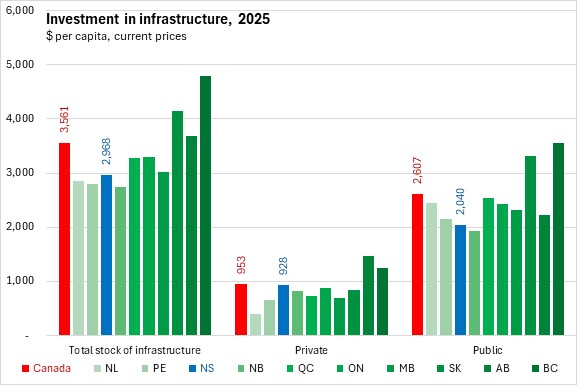
In 2025, a total of $3.245 billion in investments in infrastructure were made in Nova Scotia ($2,968 per capita). Nationally, investment in infrastructure was $3,561 per capita. British Columbia reported the highest per capita investments in infrastructure while New Brunswick reported the least investments. Investment in public infrastructure accounted for 68.7% of Nova Scotia's investment in infrastructure in 2025, the second lowest public share after Alberta.
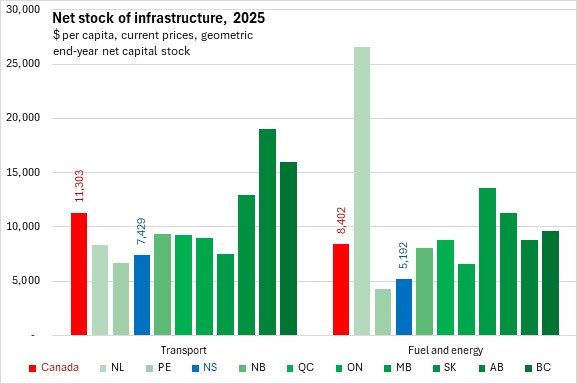
Across Canada, transportation infrastructure (roads, bridges, canals, rails, ports, airports, pipelines) accounts for the largest portion of the stock of infrastructure: $11,303 per capita. Nova Scotia had less transportation infrastructure per capita at $7,429 in 2025 (second lowest after Prince Edward Island).
Fuel and energy infrastructure (primarily power generation and transmission) accounts for the next largest category of infrastructure by function. Nationally, there was $8,402 in fuel and energy infrastructure per capita with the largest amount in Newfoundland and Labrador. Nova Scotia's fuel and energy infrastructure capital stock was $5,192 per capita - the second lowest among provinces after Prince Edward Island.
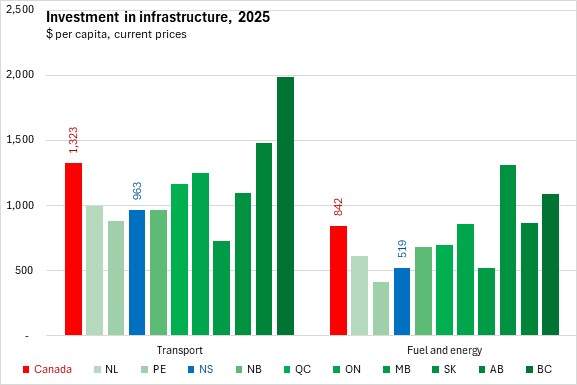
Nova Scotia's 2025 investment in new transportation infrastructure amounted to $963 per capita - below the national average of $1,323 per capita. The highest investments in transport infrastructure were in British Columbia. The lowest investments in transport in 2025 were in Manitoba.
Nova Scotia had $519 per capita in investment in fuel and energy infrastructure. Nationally, investment in fuel and energy infrastructure was $842 per capita with the highest investment in Saskatchewan and the lowest in Prince Edward Island (followed by Nova Scotia).
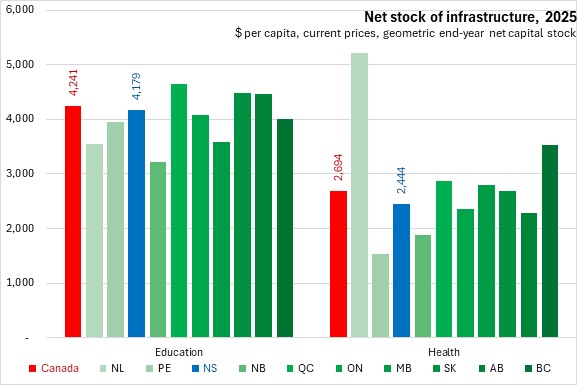
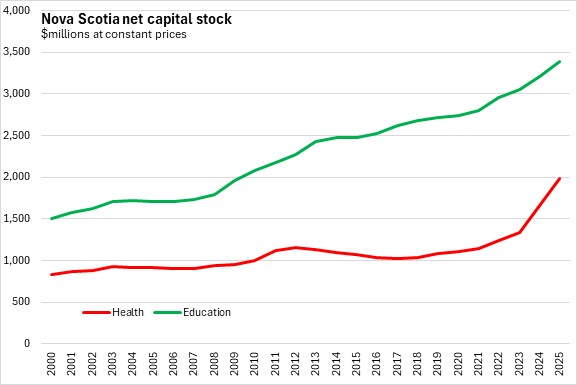
Education (primarily schools, universities, colleges) and health care (hospitals, nursing/residential care buildings) were the next two largest categories of infrastructure by function.
Nova Scotia's education infrastructure amounted to $4,179 per capita in 2025, just below the national average of $4,241 per capita. Education infrastructure per capita was highest in Québec and lowest in New Brunswick.
Health infrastructure in Nova Scotia was $2,444, which was below the national average. Nationally, there was $2,694 per capita in health infrastructure, with the highest amounts in Newfoundland and Labrador and British Columbia.
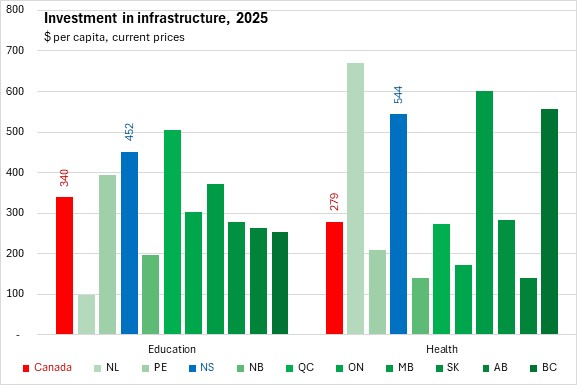
Nova Scotia's investment in education infrastructure was the second highest among provinces in 2025 at $452 per capita. Across Canada, there were $340 per capita worth of investments made in education infrastructure in 2025. The highest per capita investments in education infrastructure were in Québec. Newfoundland and Labrador had the lowest per capita investments in education infrastructure.
Nova Scotia's investment in health infrastructure was $544 per capita, which was higher than the national average of $279 per capita. There were notably higher health infrastructure investments in Newfoundland and Labrador, Manitoba, British Columbia and Nova Scotia. The lowest amounts of per capita health infrastructure investments were reported in New Brunswick and Alberta.
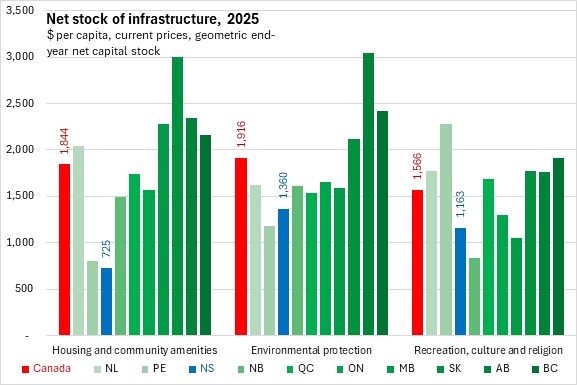
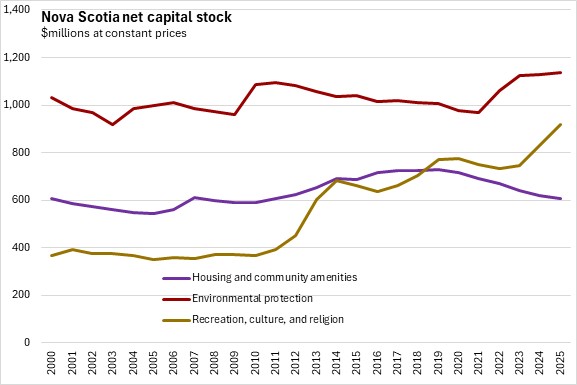
The next three largest categories of infrastructure capital stock by function were: environmental protection (primarily wastewater collection and treatment), housing and community amenities (primarily water infrastructure), and recreation/culture/religion (mostly sport/recreation facilities - both indoor and outdoor).
Nova Scotia has the lowest per capita stock of housing and community amenities (ie: water) at $725. Saskatchewan had the highest housing/community per capita stock.
Nova Scotia has the second lowest per capita stock in environmental protection infrastructure (ie: wastewater) at $1,360, ahead of Prince Edward Island. Alberta had the highest per capita stock in environmental/wastewater infrastructure
Nova Scotia's recreation infrastructure amounted to $1,163 per capita in 2025, the third lowest among provinces (ahead of New Brunswick and Manitoba). National average recreational capital stock was $1,566 per capita in 2025. Prince Edward Island reported the highest per capita recreational capital stock.
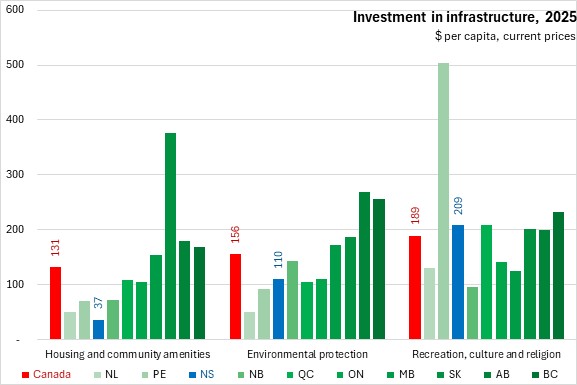
Nova Scotia's per capita investment in housing/water infrastructure ($37 per capita) was the lowest among provinces. National average investments were $131 per capita in 2025 with the highest investment in Saskatchewan.
Nova Scotia's investment in environmental/wastewater infrastructure ($110 per capita) was below the national average of $156 per capita. Alberta reported the largest investments in environmental/wastewater assets per capita while Newfoundland and Labrador reported the lowest.
Nova Scotia's investment in recreation infrastructure was $209 per capita in 2025. National average investment in recreational infrastructure was $189 per capita. Prince Edward Island reported the largest per capita investments in recreation infrastructure while New Brunswick reported the lowest.
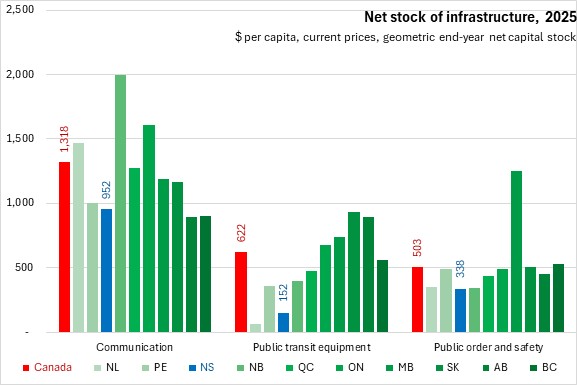
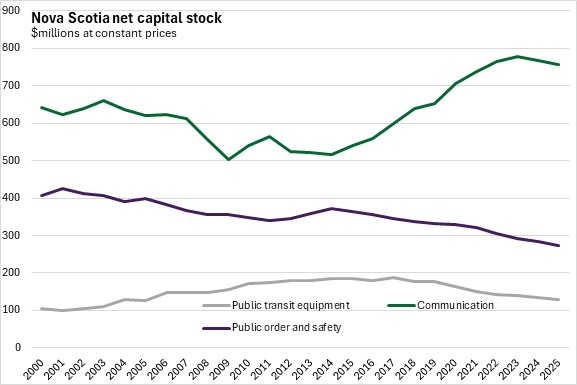
Infrastructure for communications (cables, structures), public transit (buses, rolling rail stock) and public order/safety buildings had the smallest value of per capita stocks as reported by public service function.
Nova Scotia reported communications infrastructure stock of $952 per capita. National communications infrastructure per capita was $1,318 with the highest amount in New Brunswick (lowest: British Columbia).
Nova Scotia's public transit equipment stock was $152 per capita in 2025 - second lowest among provinces ahead of Newfoundland and Labrador. The Atlantic provinces had lower per capita values of public transit infrastructure than central and western provinces. Nationally, there was $622 in public transit infrastructure per capita. The highest amounts were in Alberta and Saskatchewan.
Nova Scotia had $338 per capita in public order and safety infrastructure in 2025 - the lowest stock among provinces. The national average was $503 per capita. The highest public order and safety infrastructure per capita was in Manitoba (by a wide margin).
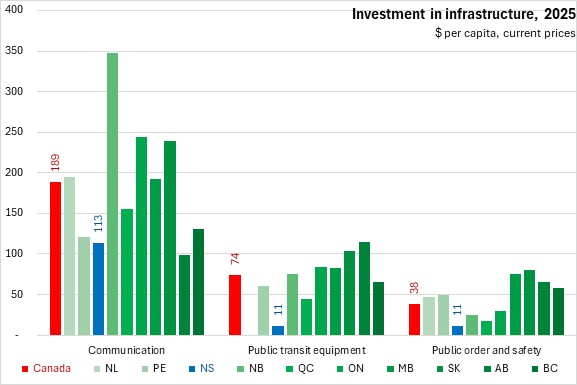
Nova Scotia reported the second lowest investments per capita in communications ($113 per capita, only ahead of Alberta). Nova Scotia had the lowest reported public transit investment ($11 per capita with no results for Newfoundland and Labrador). Nova Scotia had the lowest investments in public order and safety ($11 per capita) in 2025.
Communications investment was highest in New Brunswick and lowest in Alberta. Public transit investments per capita were highest in Alberta and Saskatchewan. Public order and safety investments per capita were highest in Saskatchewan.
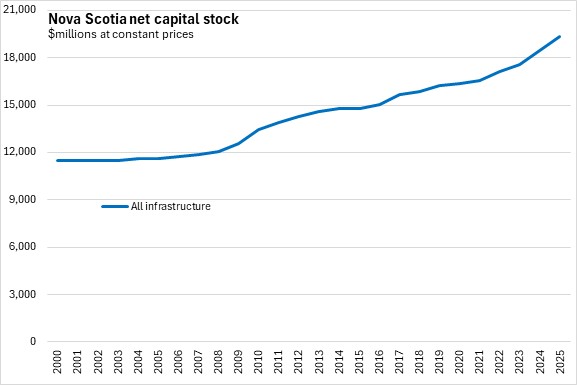
When measured at constant prices, the stock of Nova Scotia infrastructure assets remained largely stable from 2000 to 2008. Since then, there has been mostly steady increases in the stock of infrastructure in Nova Scotia.
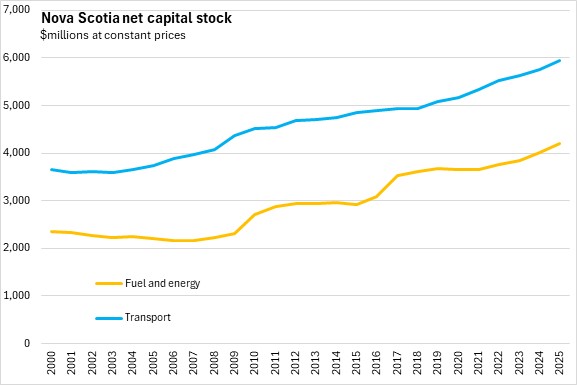
Transportation infrastructure in Nova Scotia has been rising steadily, with accelerated growth since 2019. Fuel and energy infrastructure exhibits periods of faster increases (2009-2010, 2015-2017 and 2021-2025), typically followed by periods with a stable stock of infrastructure.
Nova Scotia's education infrastructure has risen substantially since 2008. Health infrastructure stock declined from 2012 to 2017 (including depreciation), but has been rising since 2018, with a sharper acceleration in the last two years.
Nova Scotia's housing (ie: water) infrastructure has been declining since 2019. Environmental (ie: wastewater) infrastructure values trended down from 2011 to 2021, but have been growing since then. Recreation infrastructure increased substantially from 2010 to 2014 and again from 2016 to 2020, with growth resuming in 2023.
Communications infrastructure trended down in most years from 2003 to 2015 (except 2010 and 2011). There were substantial increases in Nova Scotia's communications infrastructure stock from 2015 to 2023, followed by declines in 2024 and 2025.
Nova Scotia's public transit equipment stock declined (in real terms) from 2017 to 2025.
The stock of Nova Scotia's public order and safety building infrastructure has generally trended down since 2014.
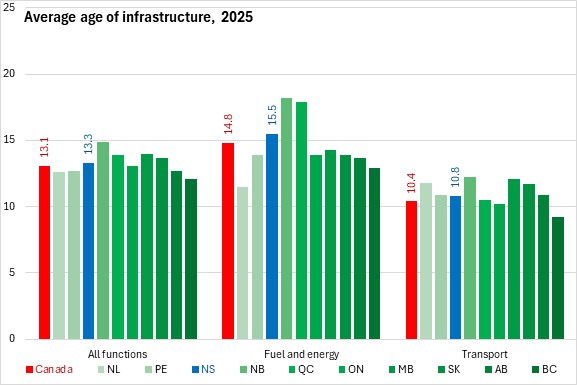
Infrastructure can also be measured by the "average age" of the assets used in public service functions. The average age of all infrastructure in Nova Scotia was 13.3 years in 2025, above the national average of 13.1 years. The oldest infrastructure in Canada was reported in New Brunswick while the newest was reported in British Columbia.
Nova Scotia's fuel and energy infrastructure (mostly electric power generation and transmission) had an average age of 15.5 years in 2025, which was above the national average age of 14.8 years. The oldest fuel and energy infrastructure was in New Brunswick and the newest in Newfoundland and Labrador.
Nova Scotia's transport infrastructure had an average age of 10.8 years in 2025, above the national average of 10.4 years. New Brunswick had the oldest transport infrastructure while British Columbia had the newest.
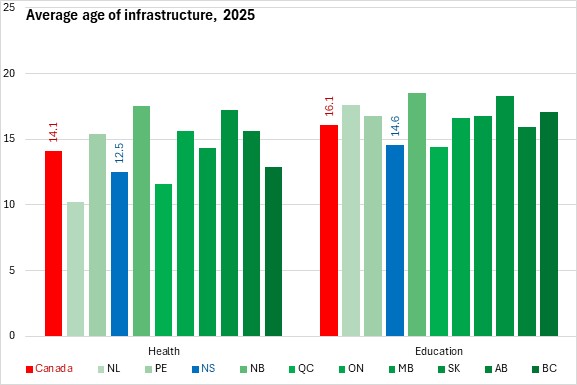
Nova Scotia's health infrastructure (hospitals, nursing/residential care facilities) had an average age of 12.5 years, which was below the national average of 14.1 years. New Brunswick and Saskatchewan had the oldest health infrastructure while Newfoundland and Labrador and Québec had the newest (followed by Nova Scotia).
Nova Scotia's education infrastructure (schools, colleges, universities) had an average age of 14.6 years in 2025, which was the second newest among provinces (Québec had the newest). New Brunswick and Saskatchewan had the oldest education infrastructure in 2025.
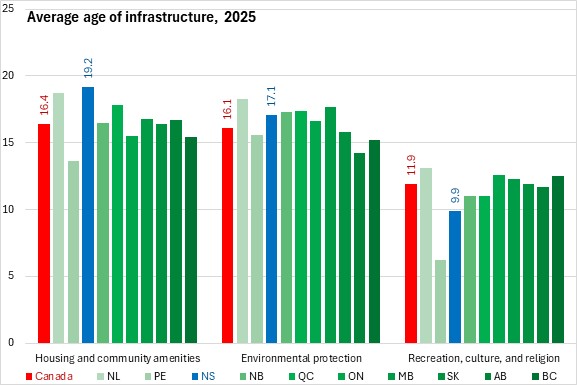
Nova Scotia's housing/water infrastructure (19.2 years) was the oldest among provinces. Prince Edward Island reported the newest infrastructure for housing/water.
The age of Nova Scotia's environmental/wastewater (17.1 years) infrastructure assets was above the national average. Manitoba and Newfoundland and Labrador had the oldest environmental/wastewater assets while Alberta had the newest.
Nova Scotia's recreational facilities had an average age of 9.9 years - newer than all provinces except Prince Edward Island. The oldest recreation assets were in Newfoundland and Labrador.
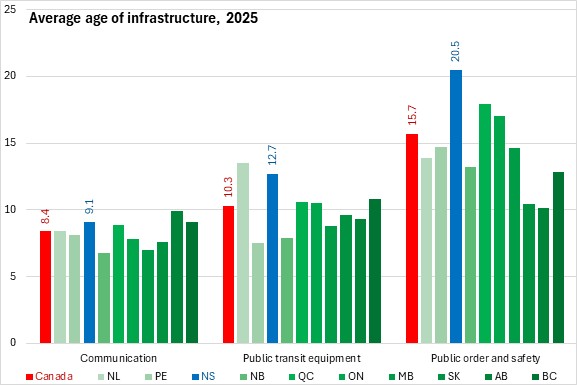
Nova Scotia's infrastructure for public order and safety (20.5 years) was the oldest among provinces. Nova Scotia's public transit equipment (12.7 years) was the second oldest among provinces after Newfoundland and Labrador. Nova Scotia's communications infrastructure had an average age of 9.1 years - tied with British Columbia for second oldest after Alberta.
Nationally, public transit equipment had an average age of 10.3 years with the newest infrastructure in Prince Edward Island. Communications infrastructure had an average age of 8.4 years across Canada with the newest infrastructure in New Brunswick. Public order and safety building infrastructure had an average age of 15.7 years across Canada, with the newest infrastructure in Alberta.
Economic impacts
Statistics Canada estimates the economic impacts associated with infrastructure investments over time. These impacts are measured in terms of jobs (headcount, not person-years), compensation of employees and value added in nominal terms. Note that compensation of employees is a component of value added.
Economic impacts are divided into direct impacts generated within the industry undertaking the investment and indirect impacts generated in industries that supply the directly-affected industry. The total economic impact is the sum of direct and indirect economic impact.
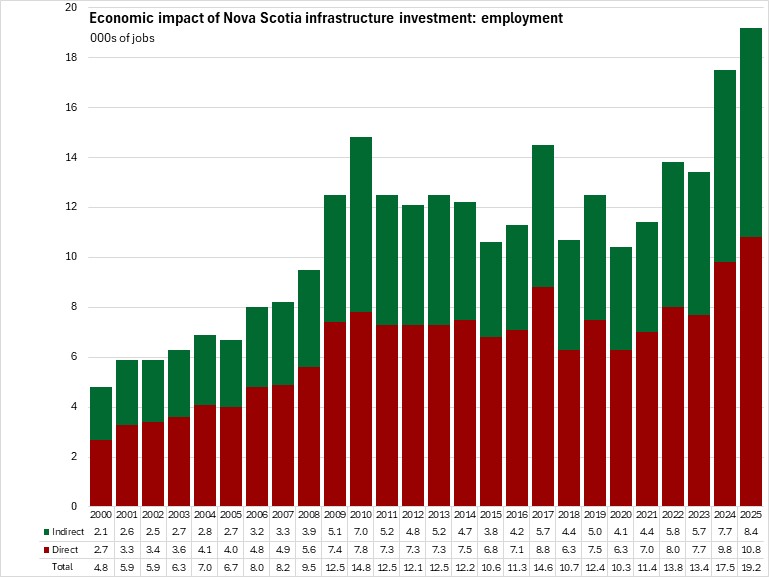
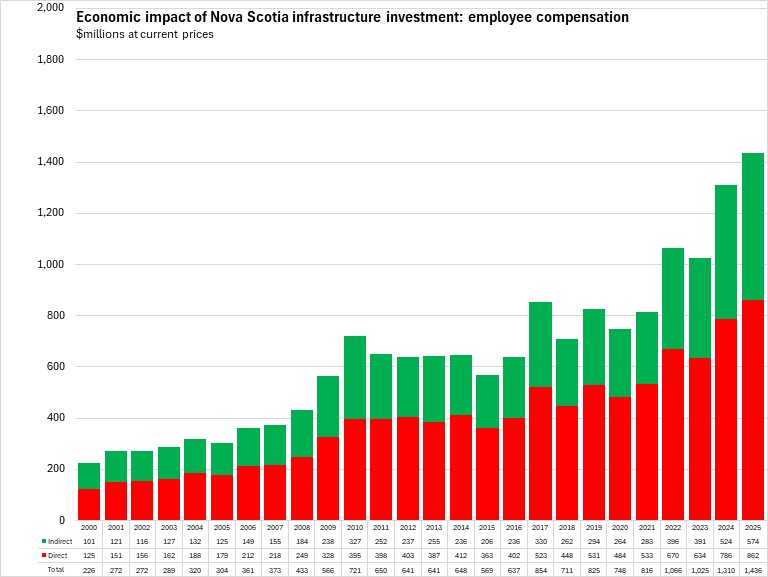
In 2025, Nova Scotia's investment in infrastructure amounted to $3.245 billion. This generated direct employment of 10,800 jobs as well as a further 8,400 in indirect employment among supplier industries for a total impact of 19,200. This total employment impact was up from 17,500 estimated for 2024. Employment impacts of infrastructure investments have almost doubled since 2020.
The total employment impacts of Nova Scotia's infrastructure investment in 2025 generated $862 million in direct employee compensation and a further $574 million in indirect employee compensation for a total impact of $1,436 million in employee compensation.
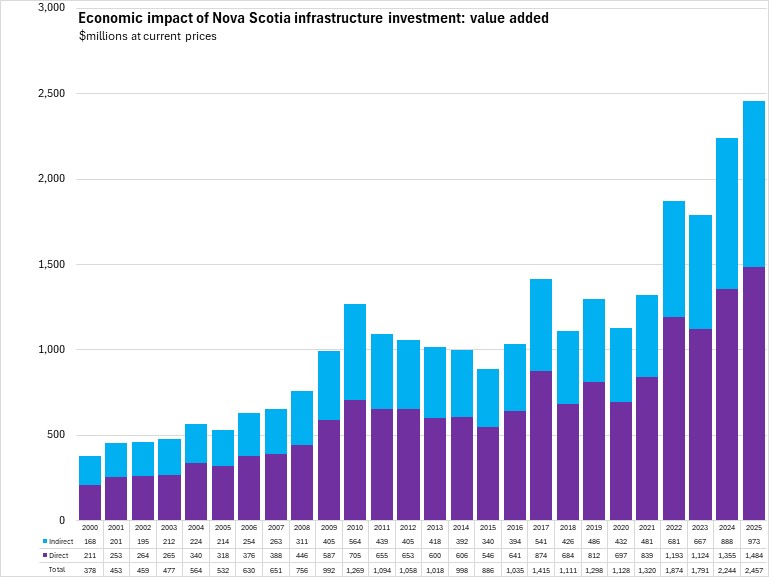
Including value added beyond compensation of employees, Nova Scotia's infrastructure investments in 2025 generated $1.48 billion in direct value added as well as $0.97 billion in indirect value added for a total impact on value added of $2.46 billion.
Notes: Infrastructure is defined as physical structures and systems that support the production of goods and service and their delivery to and consumption by governments, business and citizens. Infrastructure assets are tangible assets that generally enable or perform a support function and includes both economic asset (i.e. highways, road, energy generation/transmission, sewage systems) and social assets (i.e. hospitals, schools, pollution abatement, recreation facilities, law enforcement facilities). The value of the capital stock is measured using perpetual inventory method where investment are positive flows that accumulated the asset which is depreciated over time as assets age. Assets in the data can be separated by purchasing sector, asset type, or function. Infrastructure assets do not include all types of non-residential assets, for instance buses and trains are included while some other types of mobile assets (defense ships, aircraft, ambulances) are not considered part of infrastructure assets.
Source: Statistics Canada. Table 36-10-0608-01 Infrastructure Economic Accounts, investment and net stock by asset, industry, and asset function (x 1,000,000); Table 36-10-0610-01 Infrastructure Economic Accounts, economic impact by asset, industry, and asset function (x 1,000,000); Table 36-10-0611-01 Infrastructure Economic Accounts, average age and remaining useful service life ratio by asset and asset function; Table 17-10-0005-01 Population estimates on July 1, by age and gender
<--- Return to Archive