The Economics and Statistics Division maintains archives of previous publications for accountability purposes, but makes no updates to keep these documents current with the latest data revisions from Statistics Canada. As a result, information in older documents may not be accurate. Please exercise caution when referring to older documents. For the latest information and historical data, please contact the individual listed to the right.
<--- Return to Archive
For additional information relating to this article, please contact:
March 16, 2026CANADA NATIONAL BALANCE SHEET ACCOUNTS, Q4 2025 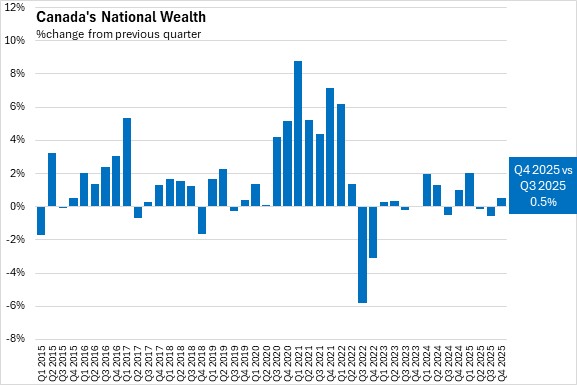
In the fourth quarter of 2025, Canadian national wealth (the total value of non-financial assets) increased 0.5% to $17,536.5 billion. This follows a decline of 0.6% in the third quarter of 2025. Growth in the fourth quarter was driven by an increase in the value of natural resources (excluding land) as commodity price growth increase the value of metallic and non-metallic mineral reserves. Residential real estate continued to decline in the fourth quarter of 2025 on lower sales activity. Financial assets increased due to continued strength in equity markets. Statistics Canada notes that wealth is not evenly distributed across households, as the wealthiest 20% of households held 65.5% of net worth in the fourth quarter.
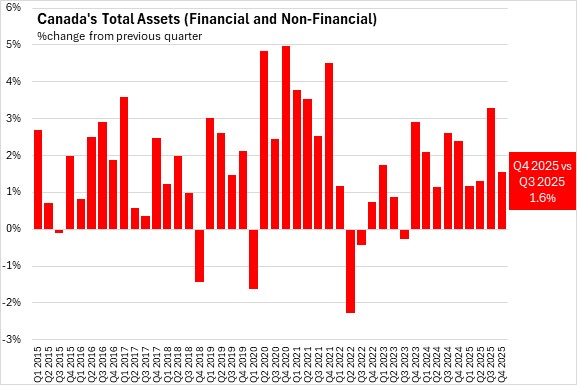
Total assets, including financial and non-financial assets rose by 1.6% to $74,530.8 billion at the end of Q4 2025, following 3.3% growth in Q3 2025.
Household sector
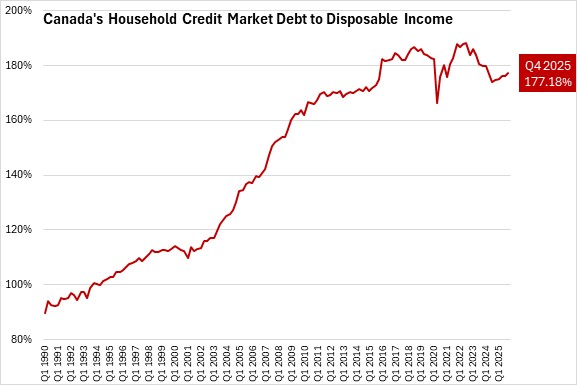
Household credit market debt as a proportion of household disposable income increased to 177.18% in Q4 2025.
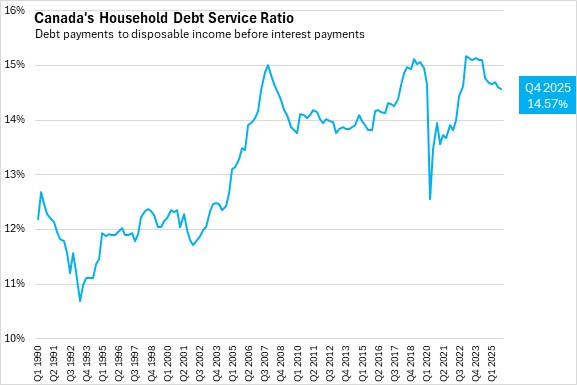
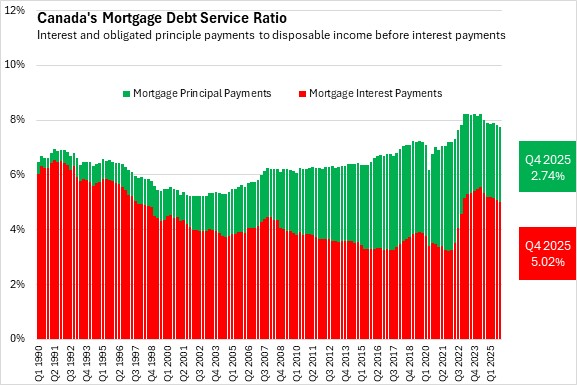
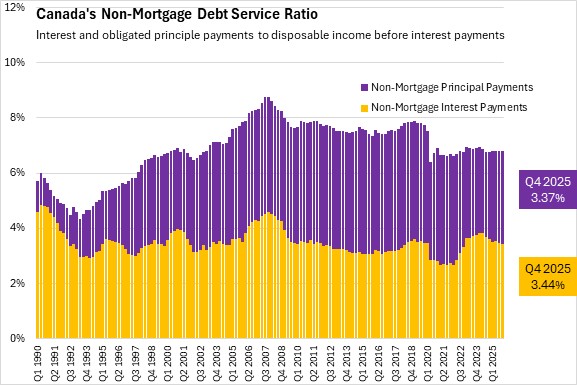
In Q4 2025, household debt payments decreased to 14.57% of disposable income. Mortgage interest payments were down 6 basis points to 5.02% of disposable income, while non-mortgage interest payments were down 3 basis points to 3.44% of disposable income. Principle payments edged up for mortgage loans to 2.74% and increased to 3.37% for non-mortgage loans as a share of disposable income.
Government sector
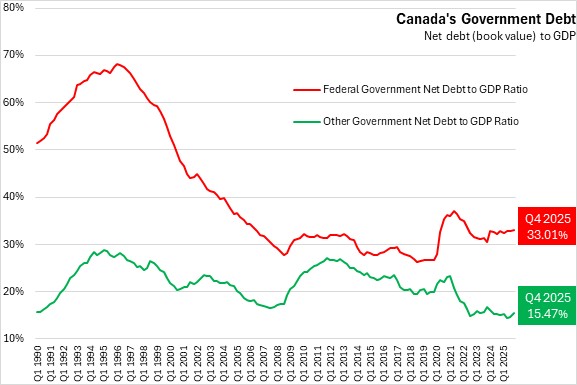
At the end of Q4 2025, federal government net debt (book value) increased to 33.01% of GDP. Net debt of other levels of government increased to 15.47% of GDP.
Corporate sector
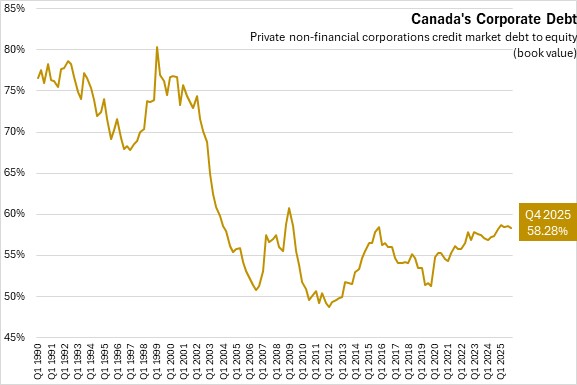
The credit market debt to equity ratio of non-financial private corporations declined to 58.28 cents of credit market debt for every dollar of equity in Q4 2025, from 58.56 cents in the third quarter.
Source: Statistics Canada. Table 11-10-0065-01 Debt service indicators of households, national balance sheet accounts; Table 36-10-0580-01 National Balance Sheet Accounts (x 1,000,000); Table 38-10-0235-01 Financial indicators of households and non-profit institutions serving households, national balance sheet accounts; Table 38-10-0236-01 Financial indicators of corporate sector, national balance sheet accounts; Table 38-10-0237-01 Financial indicators of general government sector, national balance sheet accounts; Table 38-10-0238-01 Household sector credit market summary table, seasonally adjusted estimates
<--- Return to Archive