The Economics and Statistics Division maintains archives of previous publications for accountability purposes, but makes no updates to keep these documents current with the latest data revisions from Statistics Canada. As a result, information in older documents may not be accurate. Please exercise caution when referring to older documents. For the latest information and historical data, please contact the individual listed to the right.
<--- Return to Archive
For additional information relating to this article, please contact:
March 26, 2026FOOD SERVICES AND DRINKING PLACES, JANUARY 2026 Monthly (January 2026 vs December 2025, seasonally adjusted)
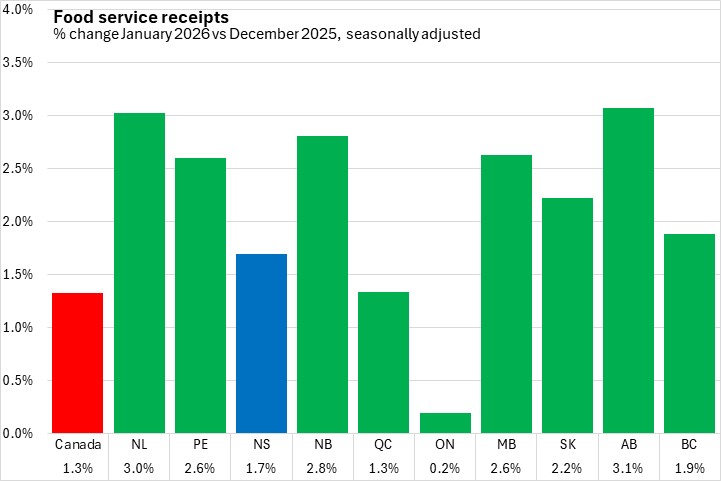
Nova Scotia food services and drinking places receipts increased by 1.7% to $206.3 million in January. Canada's food services receipts rose by 1.3% to $8.67 billion, with increases in every province. Alberta saw the fastest increase, followed by Newfoundland and Labrador, while Ontario reported the slowest month-over-month increase in food service receipts.
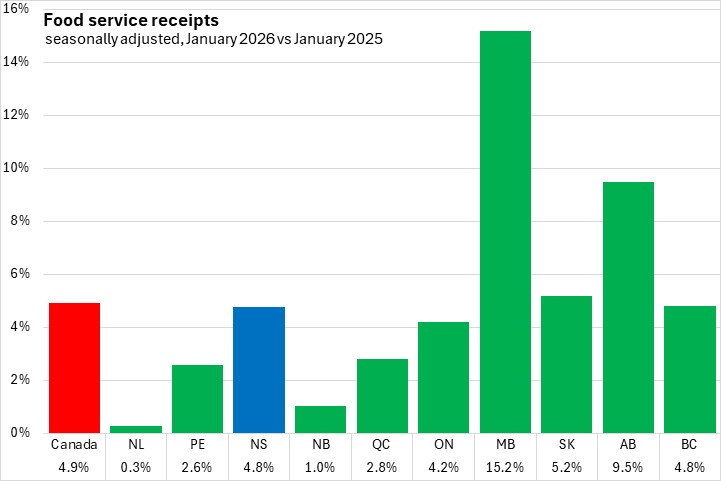
Year-over-year (January 2026 vs January 2025)
Nova Scotia reported a year-over-year gain of 4.8% in food service receipts. Canada's food services receipts increased 4.9% with year-over-year gains in all provinces with the strongest gain in Manitoba. Newfoundland and Labrador reported the slowest gain.
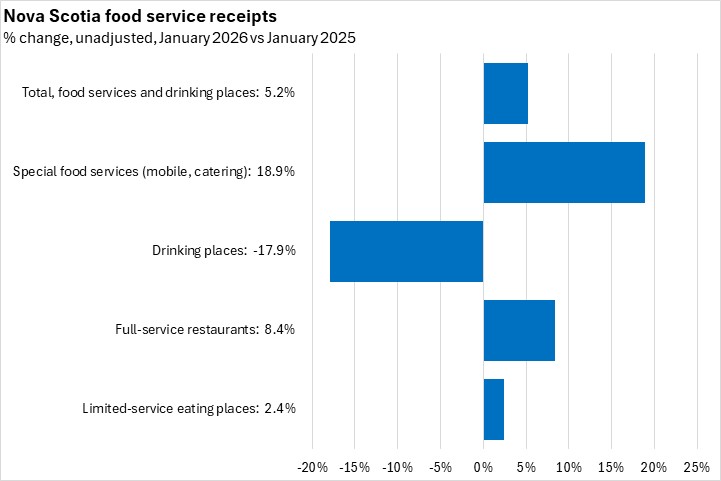
Nova Scotia's total food services and drinking places receipts (unadjusted) increased $8.8 million year-over-year, with increases in every category except drinking places.
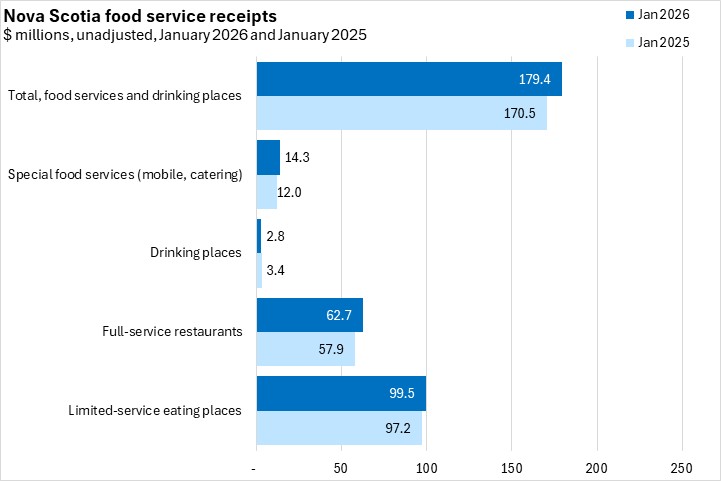
Special food services and full service restaurants reported the strongest growth rates in percentage terms, while drinking places had the only decline.
Trends
Nova Scotia's food service receipts exhibit more volatility than national food service receipts, but in recent months Nova Scotia's receipts have grown faster than the national trend.
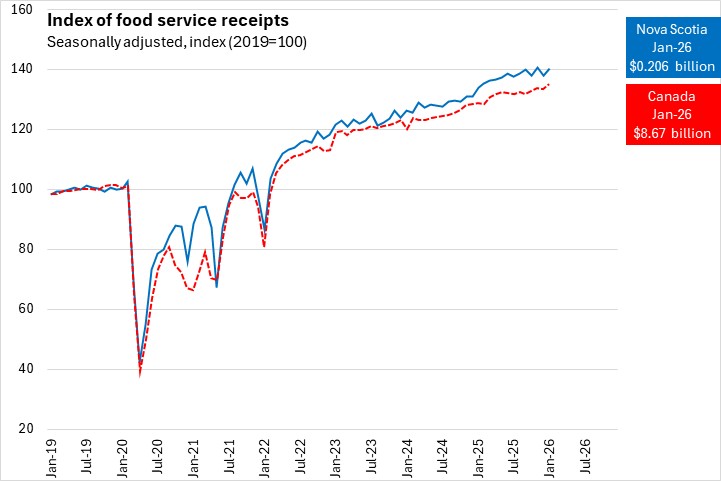
Source: Statistics Canada. Table 21-10-0019-01 Monthly survey of food services and drinking places (x 1,000)
<--- Return to Archive