The Economics and Statistics Division maintains archives of previous publications for accountability purposes, but makes no updates to keep these documents current with the latest data revisions from Statistics Canada. As a result, information in older documents may not be accurate. Please exercise caution when referring to older documents. For the latest information and historical data, please contact the individual listed to the right.
<--- Return to Archive
For additional information relating to this article, please contact:
July 24, 2026NEW HOUSING PRICE INDEX, JUNE 2026 Monthly (June vs May 2026)
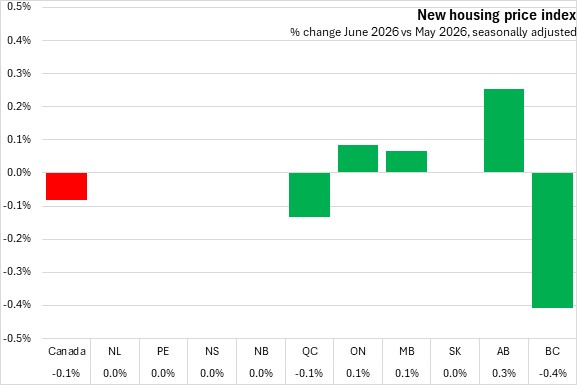
New housing prices in Nova Scotia were unchanged from May to June 2026. Nationally the price of new houses edged down 0.1%, with declines in British Columbia and Québec offsetting increases in Ontario, Manitoba and Alberta. The Atlantic provinces reported no change from May.
Year-over-year (June 2026 vs June 2025)
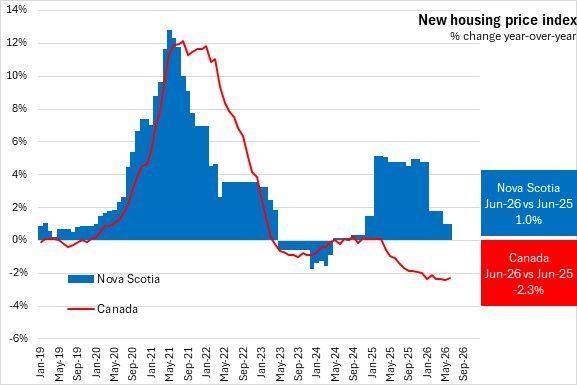
Nova Scotia’s new housing prices increased 1.0% from June 2025 to June 2026. Nationally, prices were down 2.3%, and have been declining year-over-year since March 2025.
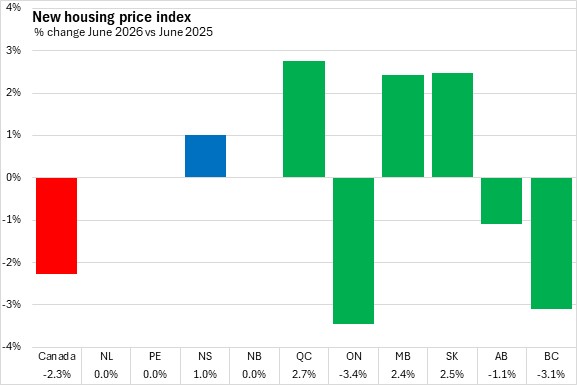
New housing prices increased year-over-year in four provinces, led by Québec, while Ontario reported the largest decline.
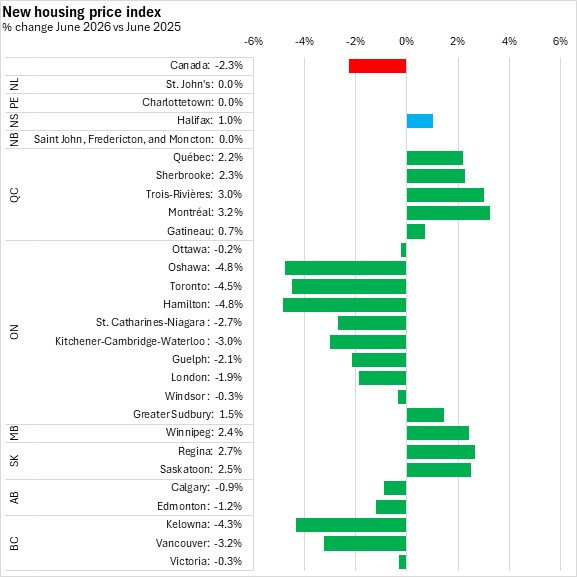
Halifax new home prices increased 1.0% year-over-year in June 2026. Among Census Metropolitan Areas (CMAs), new housing prices were down year-over-year in fourteen CMAs, led by Oshawa and Hamilton. Montréal reported the largest year-over-year gain.
Year-to-date (January-June 2026 vs January-June 2025)
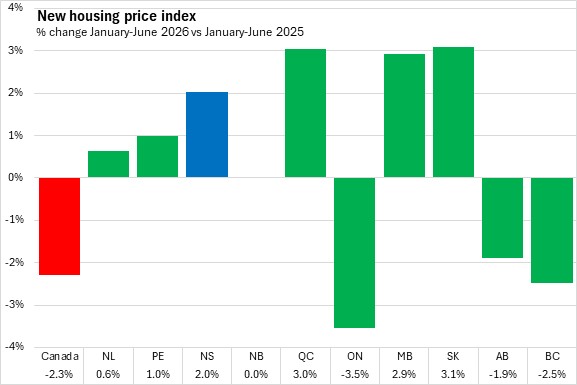
In the first six months of 2026, Nova Scotia new housing prices rose 2.0%. Nationally, new house prices declined 2.3%. Gains in six provinces (led by Saskatchewan) were offset by declines in Ontario, Alberta and British Columbia.
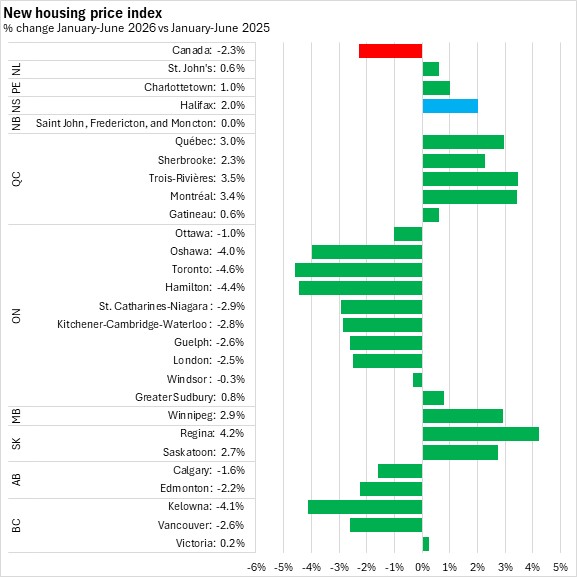
Halifax housing prices were up 2.0% in January-June 2026 compared to the same period a year ago. There were declines in prices in thirteen CMAs throughout Canada. Regina reported the largest increase while Hamilton and Toronto posted the largest declines in new house prices.
Source: Statistics Canada. Table 18-10-0205-01 New housing price index, monthly
<--- Return to Archive


