The Economics and Statistics Division maintains archives of previous publications for accountability purposes, but makes no updates to keep these documents current with the latest data revisions from Statistics Canada. As a result, information in older documents may not be accurate. Please exercise caution when referring to older documents. For the latest information and historical data, please contact the individual listed to the right.
<--- Return to Archive
For additional information relating to this article, please contact:
July 28, 2026US S&P COTALITY CASE-SHILLER HOME PRICE INDICES, MAY 2026 Month-over-month (May 2026 vs April 2026, seasonally adjusted)
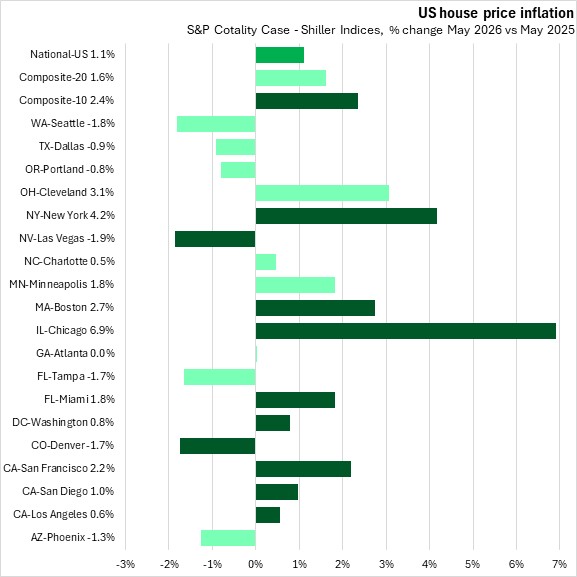
S&P Dow Jones Indices reports that US national house prices, as measured by the S&P Cotality Case - Shiller Indices edged down 0.05% from the previous month. The 20-city composite average was up 0.1% and 10-city composite average up 0.3%.
Month-over-month housing prices decreased for 10 of 19 (Detroit data is not available) major urban centres, with the fastest declines in Las Vegas and San Diego. The fastest gain was reported in Boston.
Year over year (May 2026 vs May 2025, seasonally adjusted)
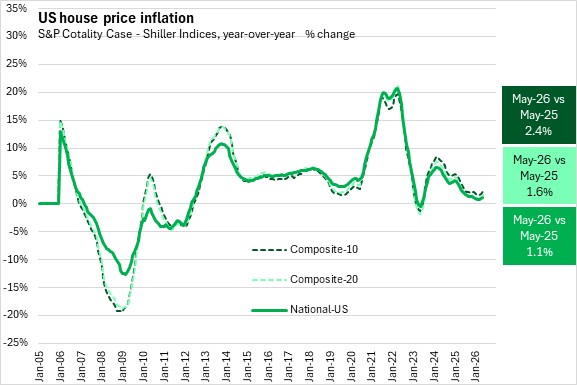
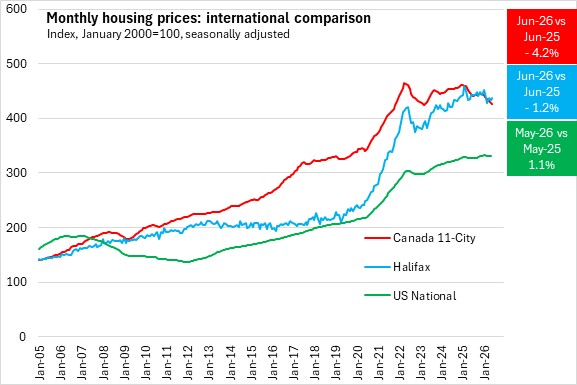
In the year over year comparison, National US house prices increased 1.1%. The 20-city composite average increased 1.6% while the 10-city composite grew 2.4%. Housing prices were up for 12 of 19 (Detroit data is not available) major urban centres. The largest gains were reported in Chicago and New York. The fastest decline was reported in Las Vegas.
Year to date (January-May 2026 vs January-May 2025, seasonally adjusted)
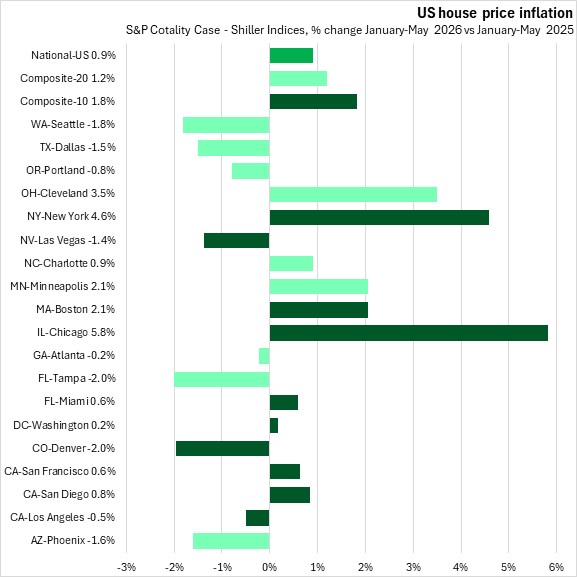
US national house prices rose by 0.9% in the first five months of 2026 when compared to the same period last year. The 20-city composite average was up 1.2% and the 10-city composite was up 1.8%.
Housing prices were up for 10 of 19 (Detroit data is not available) major urban centres. The largest gains were in Chicago and New York. The fastest declines were in Tampa and Denver.
Trends
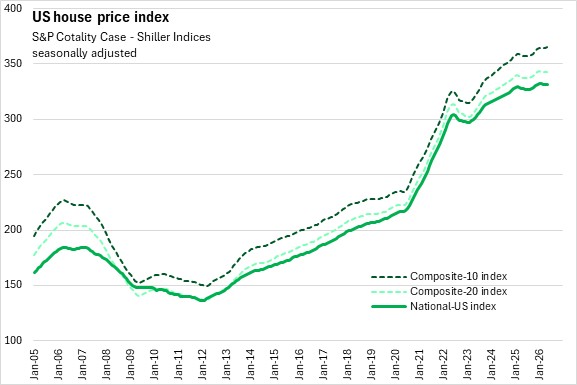
In 2023 and 2024, US house prices gradually increased and passed the peak of June 2022. In the summer months of 2025, US house prices declined, but have recently returned to a gradual increasing trend.
Canadian urban house price growth (measured by the Teranet-National Bank House Price Index) peaked in 2022, declined in 2023, peaked again in 2024, declined in 2025, and has continued to decline in recent months (-4.2% year-over-year in June 2026). Halifax resale house prices also had peaks in 2022 and 2024, but exhibited a faster recovery from recent corrections over the last 3 years.
The 20-City Composite Index includes Atlanta, Boston, Charlotte, Chicago, Cleveland, Dallas, Denver, Detroit, Las Vegas, Los Angeles, Miami, Minneapolis, New York, Phoenix, Portland, San Diego, San Francisco, Seattle, Tampa, and Washington DC.
The 10-City Composite Index includes Boston, Chicago, Denver, Las Vegas, Los Angeles, Miami, New York, San Diego, San Francisco, and Washington DC.
Source: S&P Cotality Case-Shiller Home Price Index, retrieved from FRED, Federal Reserve Bank of St. Louis
<--- Return to Archive


