The Economics and Statistics Division maintains archives of previous publications for accountability purposes, but makes no updates to keep these documents current with the latest data revisions from Statistics Canada. As a result, information in older documents may not be accurate. Please exercise caution when referring to older documents. For the latest information and historical data, please contact the individual listed to the right.
<--- Return to Archive
For additional information relating to this article, please contact:
August 05, 2026AVERAGE RETAIL PRICES, JUNE 2026 Year-over-year (June 2026 vs June 2025)
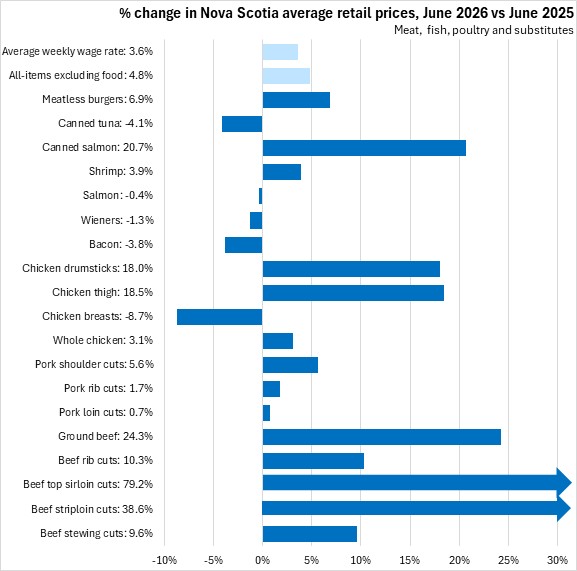
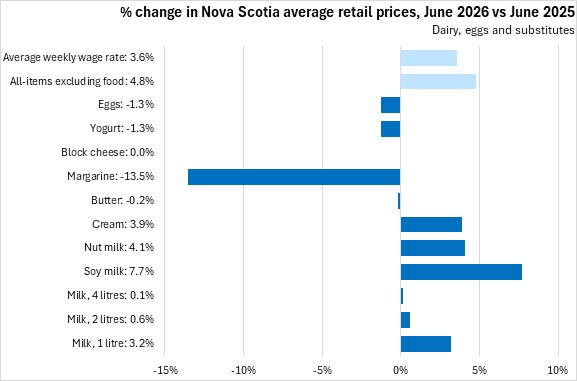
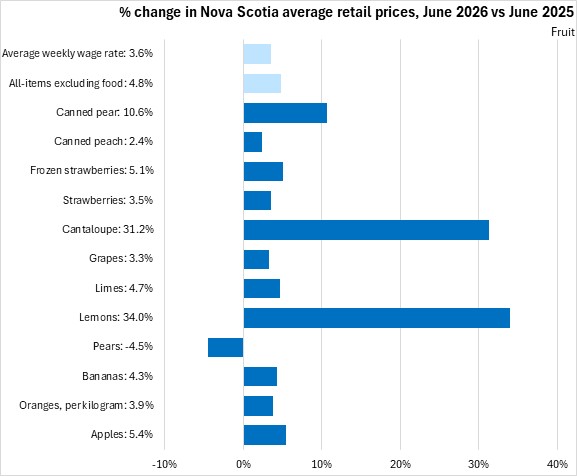
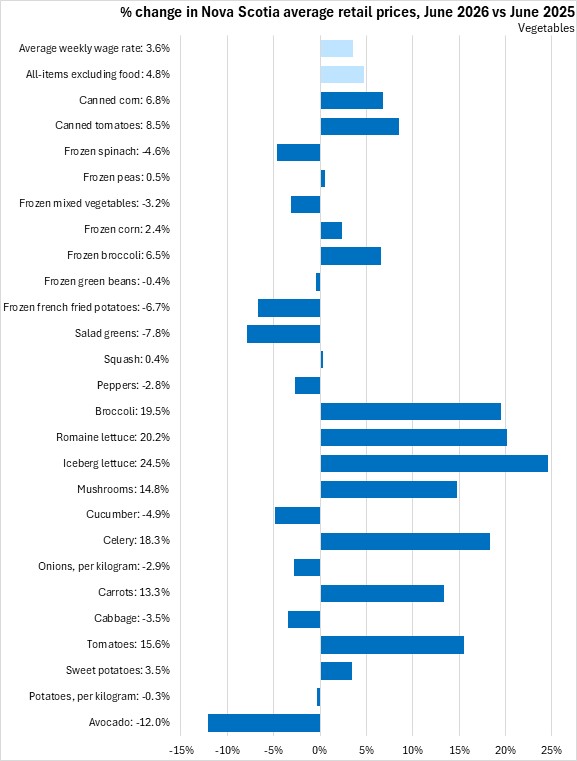
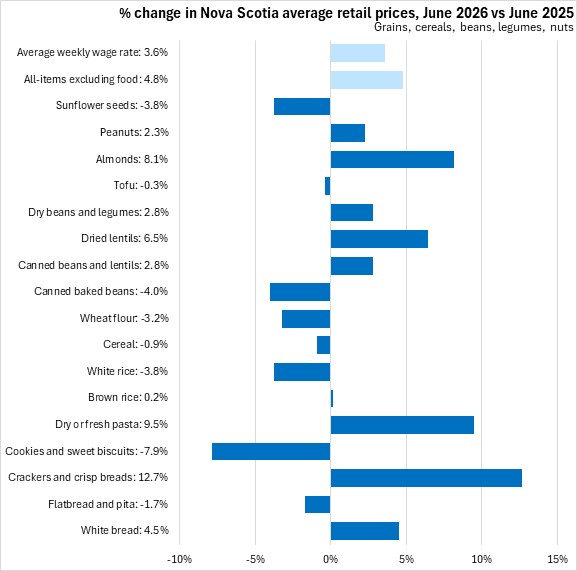
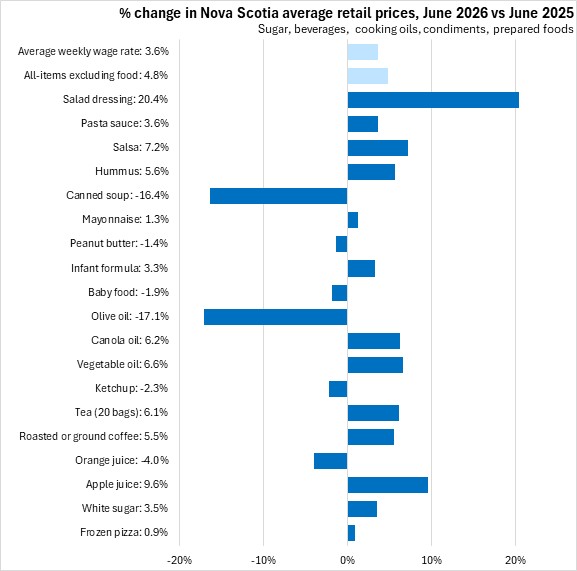
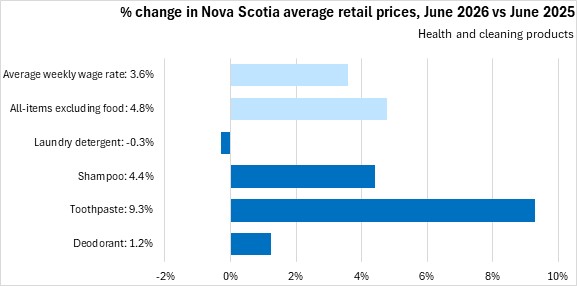
Over the last year (June 2026 vs June 2025), the consumer price index for all items in Nova Scotia excluding food increased by 4.8%. Food prices as a whole rose 3.3%. At the same time the average weekly wage across all Nova Scotia industries increased by 3.6%.
In the last year, the following products reported lower prices in Nova Scotia: chicken breasts, bacon, wieners, salmon, canned tuna, butter, margarine, yogurt, eggs, pears, avocado, potatoes, per kilogram, cabbage, onions, per kilogram, cucumber, peppers, salad greens, frozen french fried potatoes, frozen green beans, frozen mixed vegetables, frozen spinach, flatbread and pita, cookies and sweet biscuits, white rice, cereal, wheat flour, orange juice, ketchup, olive oil, baby food, peanut butter, canned baked beans, canned soup, tofu, sunflower seeds, and laundry detergent.
The following products reported price growth that exceeded the gains in average weekly earnings: beef (stewing cuts, striploin cuts, rib cuts, ground), chicken thighs and drumsticks, shrimp, canned salmon, meatless burgers, soy milk, nut milk, cream, apples, oranges, bananas, lemons and limes, cantaloupe, tomatoes, carrots, celery, mushrooms, lettuce, broccoli, frozen broccoli, frozen strawberries, white bread, crackers and crisp breads, dry or fresh pasta, apple juice, coffee and tea, vegetable oil, canola oil, canned tomatoes, canned corn, canned pear, dried lentils, hummus, salsa, pasta sauce, salad dressing, almonds, toothpaste, and shampoo.
Nova Scotia prices relative to national average (June 2026)
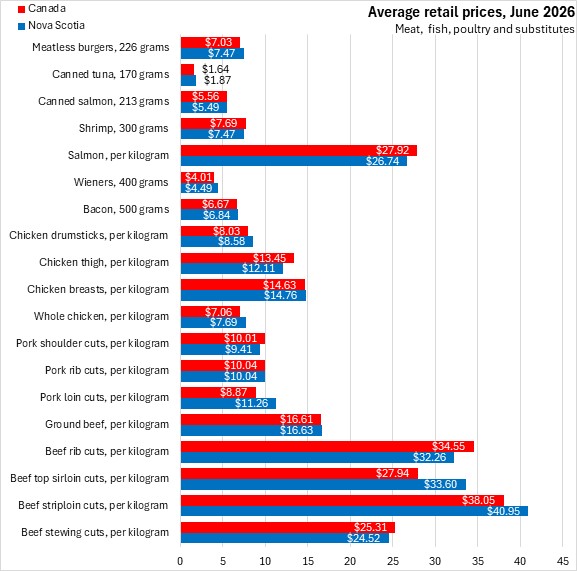
Nova Scotia food prices were below national averages for beef stewing cuts, beef rib cuts, pork shoulder cuts, chicken thigh, salmon, shrimp, canned salmon, milk (2 litres), tofu, frozen mixed vegetables, frozen spinach and pasta sauce. Other products below the national average included nut milk, cookies and sweet biscuits, cabbage, romaine lettuce, salad greens, frozen corn, frozen peas, frozen pizza, and shampoo.
Nova Scotia food prices were more than 10% higher than national averages for beef top sirloin cuts, pork loin cuts, wieners, canned tuna, cream, eggs, apples, oranges per kilogram, bananas, pears, lemons, limes, cantaloupe, strawberries, avocado, potatoes per kilogram, tomatoes, celery, cucumber, mushrooms, iceberg lettuce, broccoli, peppers, squash, flatbread and pita, crackers and crisp breads, vegetable oil, canola oil, salad dressing, and canned baked beans.
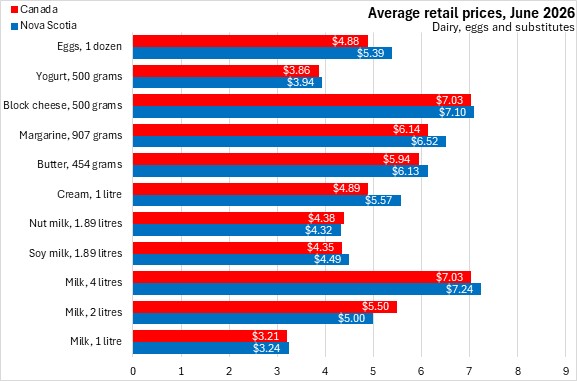
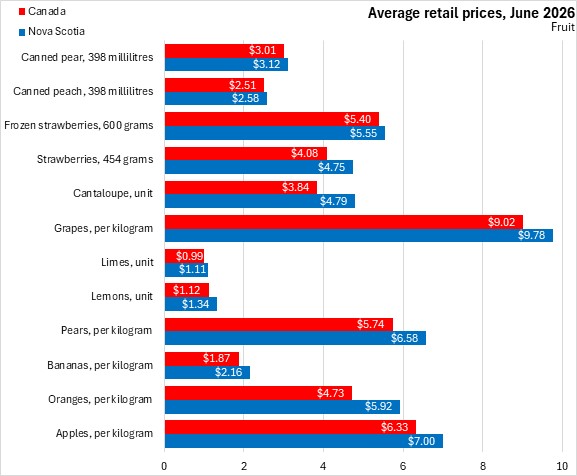
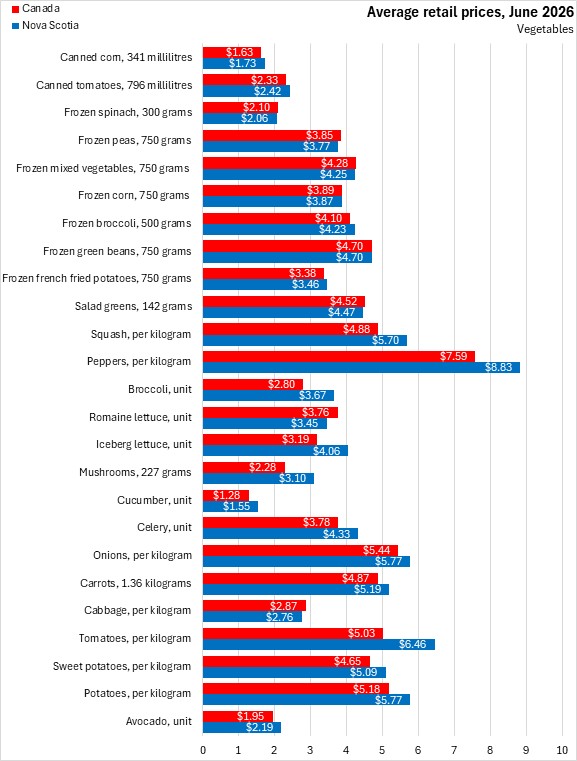
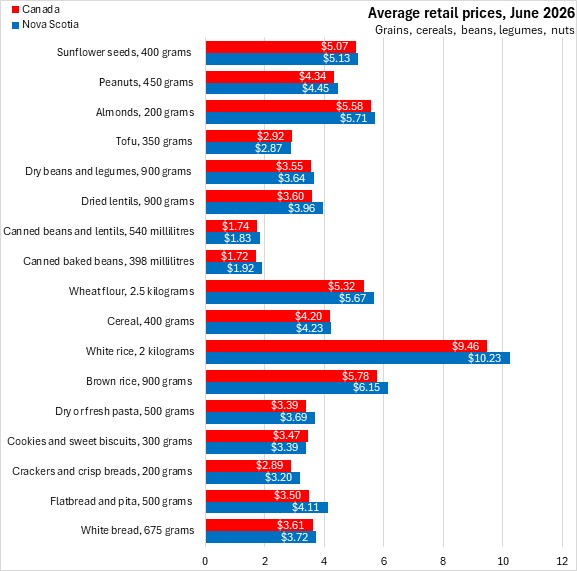
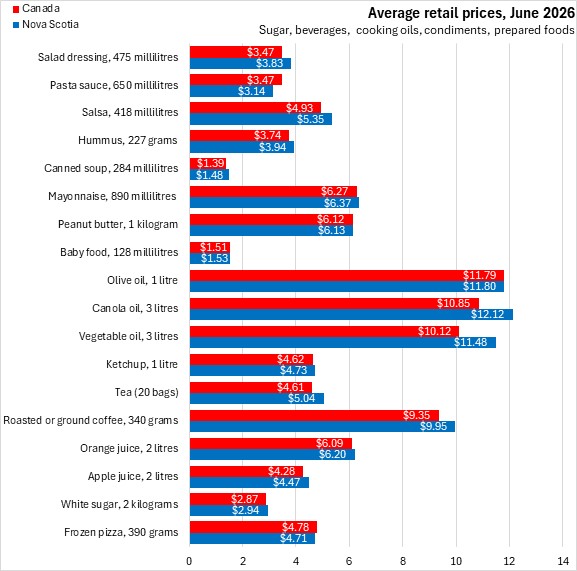

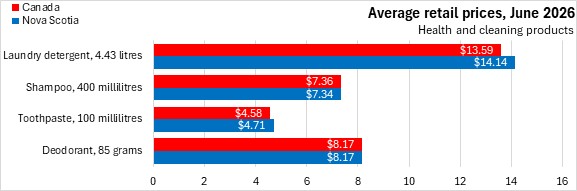
Notes: Statistics Canada makes available scanner data on prices collected for a range of food and personal care items. These prices are collected through point-of-sale (transaction) data obtained directly from Canadian retailers. The data represent commonly purchased items (which do change over time), but are not representative of the Consumer Price Index weights. Over time, products are rotated and quantity or quality may change. Comparisons of prices from one time period to another reflect quantity and quality changes as well as price changes.
For the purposes of this analysis, the 110 items reported by Statistics Canada will be grouped into:
- Meat, fish, poultry and meat substitutes
- Dairy, eggs and substitute products
- Fruit (including canned and frozen products)
- Vegetables (including canned and frozen products)
- Grains, cereals, beans, legumes and nuts
- Sugar, juices, cooking oils, condiments and prepared foods
- Health and cleaning products
Source: Statistics Canada. Table 18-10-0245-01 Monthly average retail prices for selected products; Table 18-10-0004-01 Consumer Price Index, monthly, not seasonally adjusted; Table 14-10-0063-01 Employee wages by industry, monthly, unadjusted for seasonality
<--- Return to Archive


