The Economics and Statistics Division maintains archives of previous publications for accountability purposes, but makes no updates to keep these documents current with the latest data revisions from Statistics Canada. As a result, information in older documents may not be accurate. Please exercise caution when referring to older documents. For the latest information and historical data, please contact the individual listed to the right.
<--- Return to Archive
For additional information relating to this article, please contact:
August 07, 2026LABOUR FORCE SURVEY: VISIBLE MINORITIES, JULY 2026 The Labour Force Survey asks respondents about whether they identify with visible minority categories (as used in the Census): White, South Asian (e.g., East Indian, Pakistani, Sri Lankan), Chinese, Black, Filipino, Arab, Latin American, Southeast Asian (e.g., Vietnamese, Cambodian, Laotian, Thai), West Asian (e.g., Iranian, Afghan), Korean, Other.
July 2026 (3 month moving average, unadjusted)
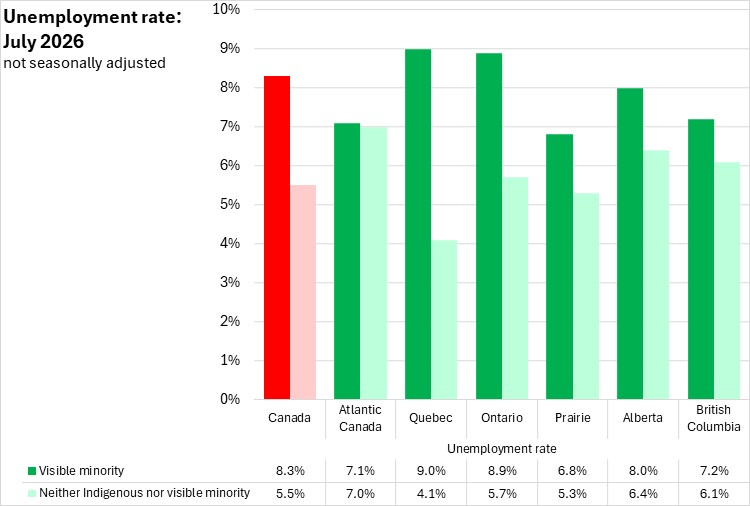
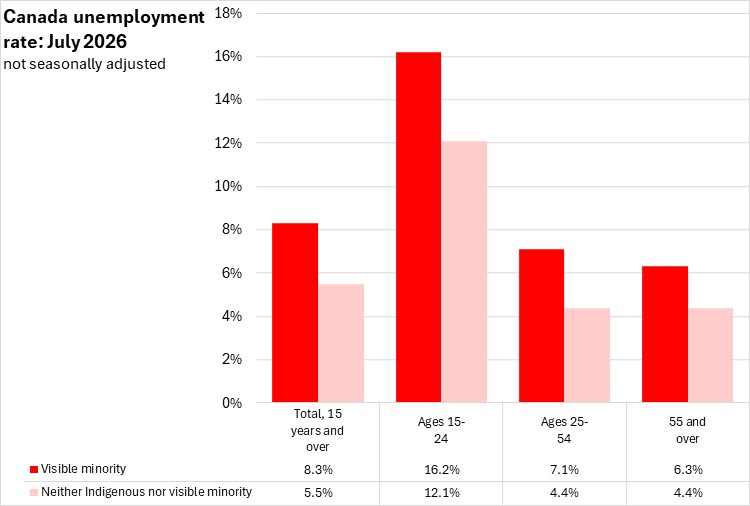
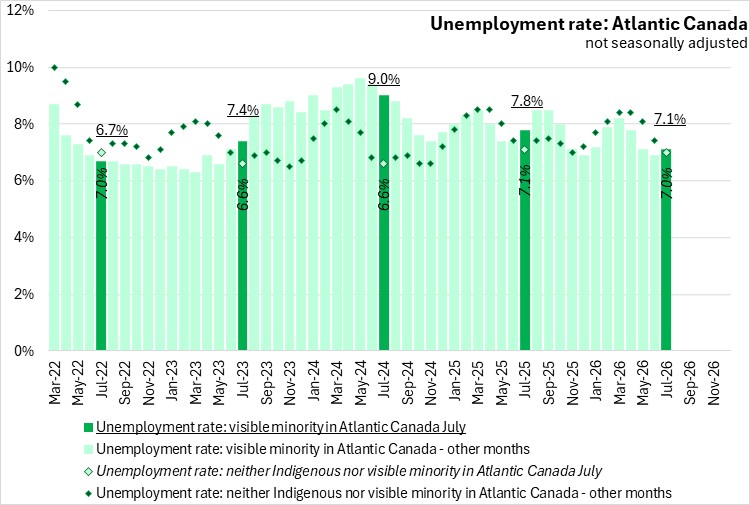
Nationally, the unemployment rate for those who identify as a visible minority population (8.3%) was higher than the unemployment rate for those that did not identify as Indigenous or in a visible minority population (5.5%). All regions had an unemployment rate higher for those who identify with a visible minority group than for those who did not identify as Indigenous or in a visible minority population. This gap was highest in Québec. In Atlantic Canada, the unemployment rate was 7.1% for those who identify with a visible minority group and 7.0% for those that did not identify as Indigenous or in a visible minority population.
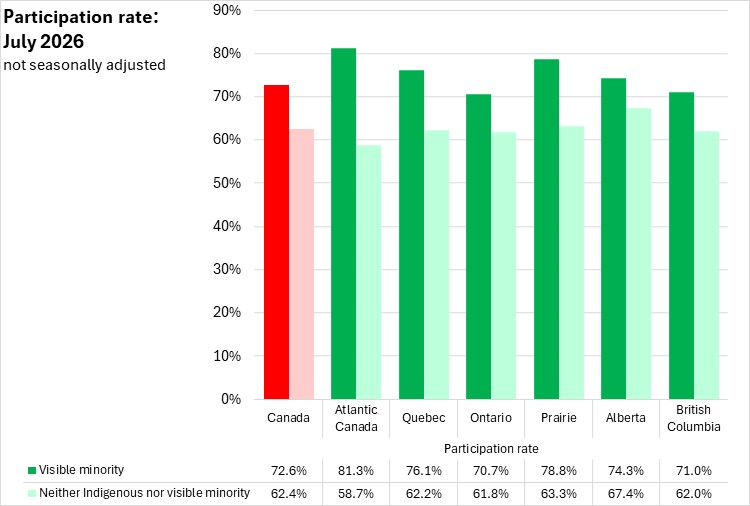
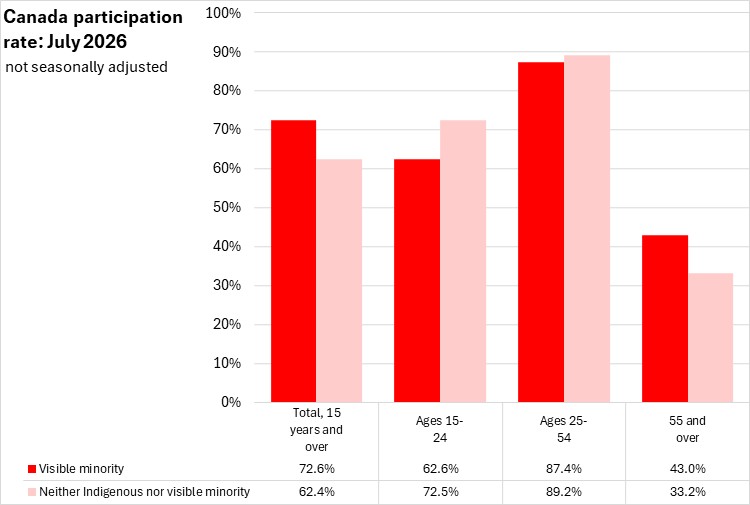
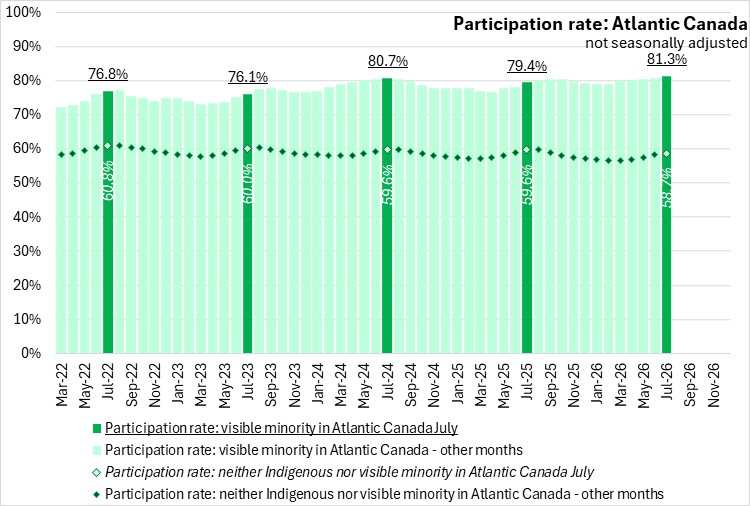
National participation rates were higher for those who identify with a visible minority population (72.6%) than for those that did not identify as Indigenous or in a visible minority population (62.4%). Participation rates of those who identify with a visible minority population were higher in all regions in July 2026. In Atlantic Canada, those who identify with a visible minority population reported a 81.3% participation rate, compared to a 58.7% participation rate for those that do not identify as Indigenous or in a visible minority population, the largest gap among regions.
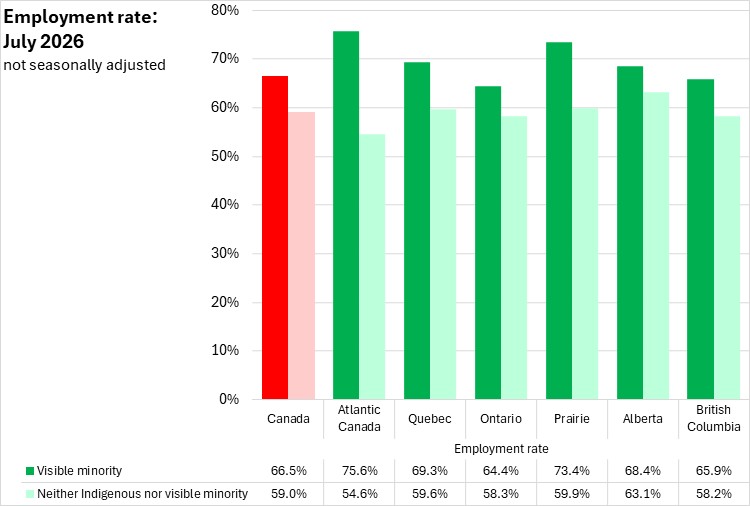
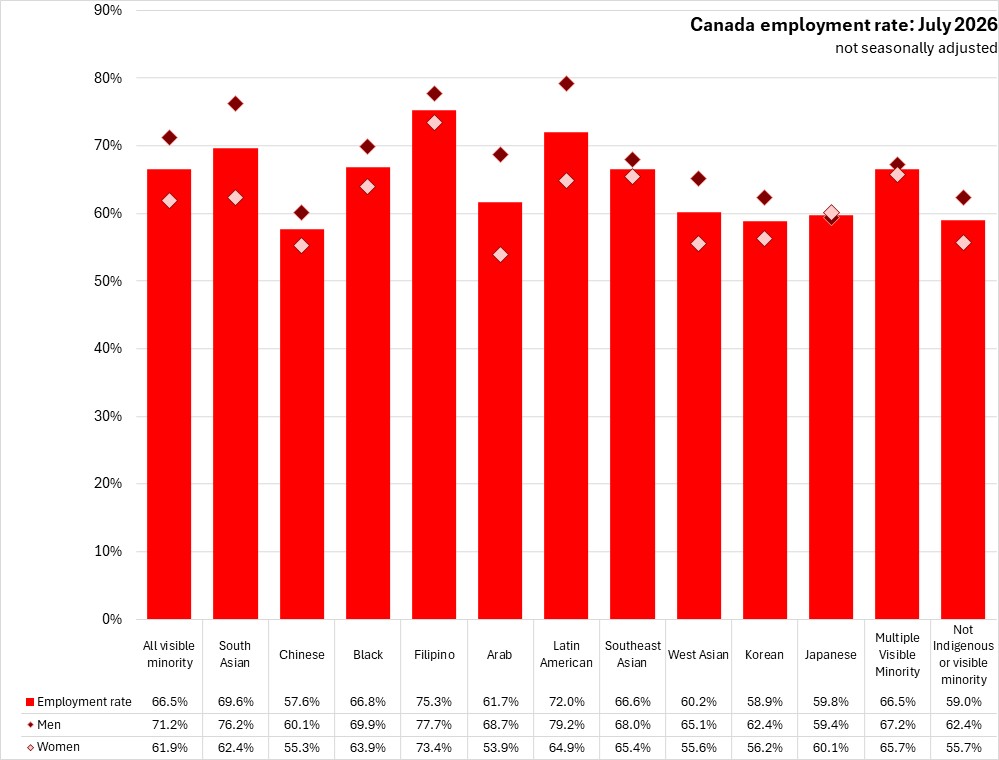
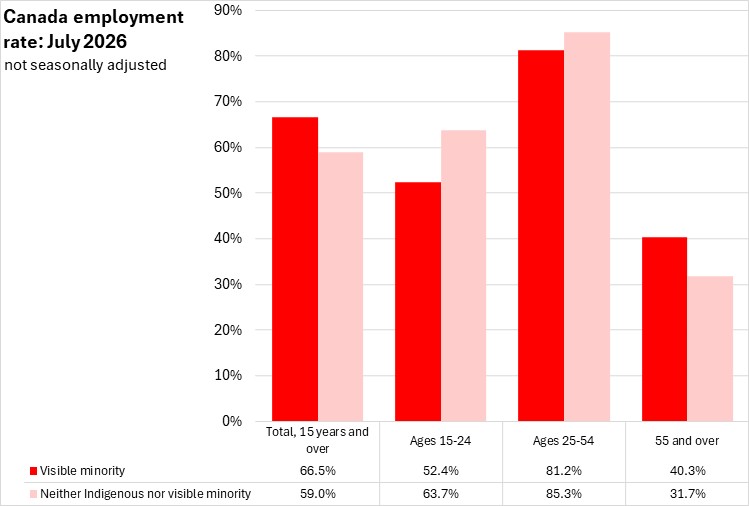
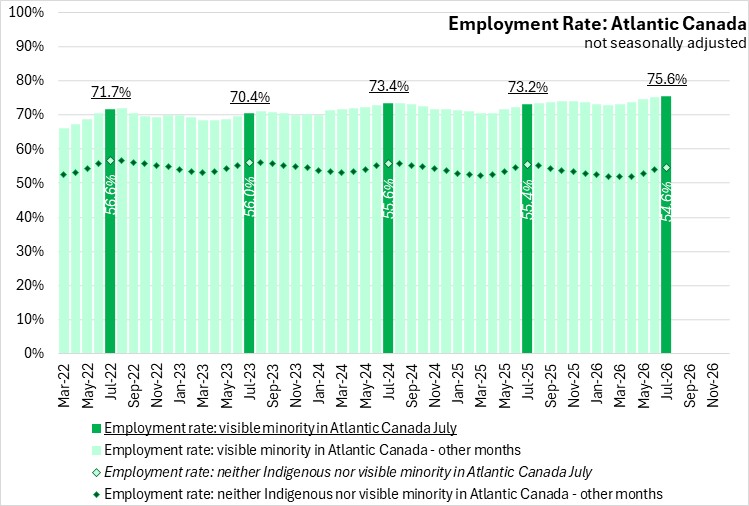
Nationally, employment rates were higher for those who identified with visible minority populations (66.5%) than for those who did not identify as Indigenous or in a visible minority population (59.0%). Employment rates were higher for those who identify with visible minority populations in every region when compared against those who do not identify as Indigenous or in a visible minority population in July 2026. The largest gap was in Atlantic Canada, with an employment rates for those who identified with visible minority populations of (75.6%) and for those who did not of (54.6%).
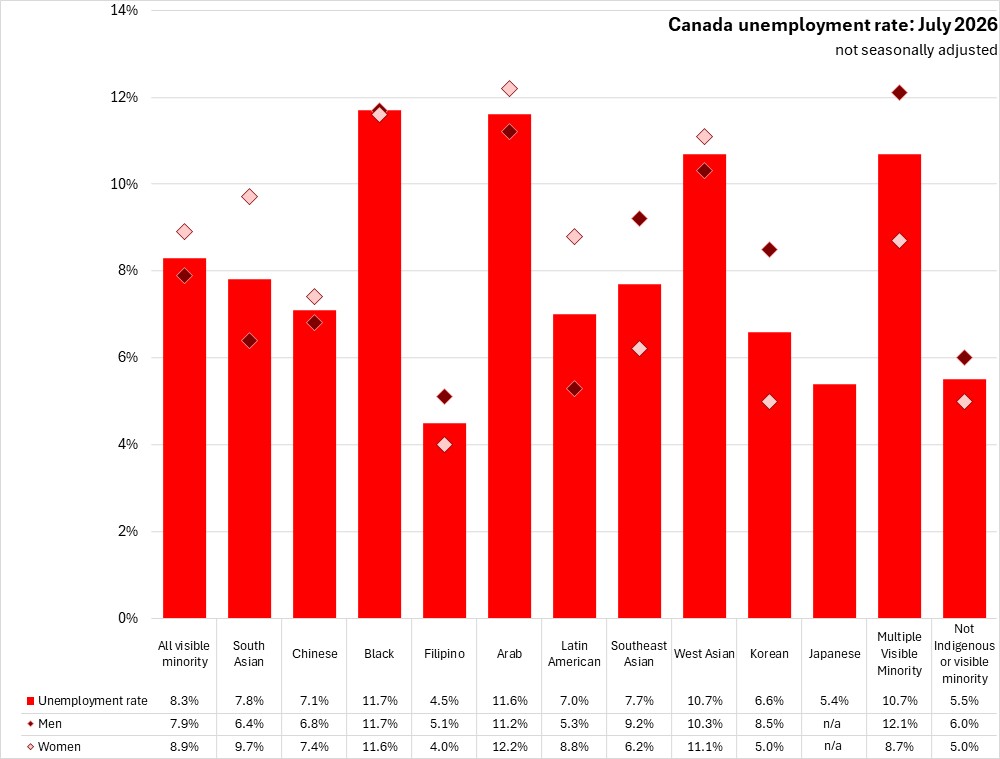
Canada's unemployment rates were generally higher across visible minority populations than for those who did not identify as Indigenous or in a visible minority population (Exception: Filipino and Japanese).
In July 2026, the average unemployment rates of males in visible minority populations were lower (7.9%) than for females in visible minority populations (8.9%). The male unemployment rate was higher among populations that did not identify as Indigenous or visible minorities. The unemployment rate for female visible minorities overall was higher than that for males, with exceptions across visibile minority categories. Data was suppressed for Japanese men and women unemployment rates.
Labour force participation rates for those identifying with a visible minority were generally higher when compared those who do not identify as Indigenous or a visible minority (exceptions: Chinese).
Participation rates were higher for men (77.3%) than for women (67.9%) among all visible minority populations (exception: Japanese). Male participation rates were also higher than for females for those who did not identify as indigenous or visible minority.
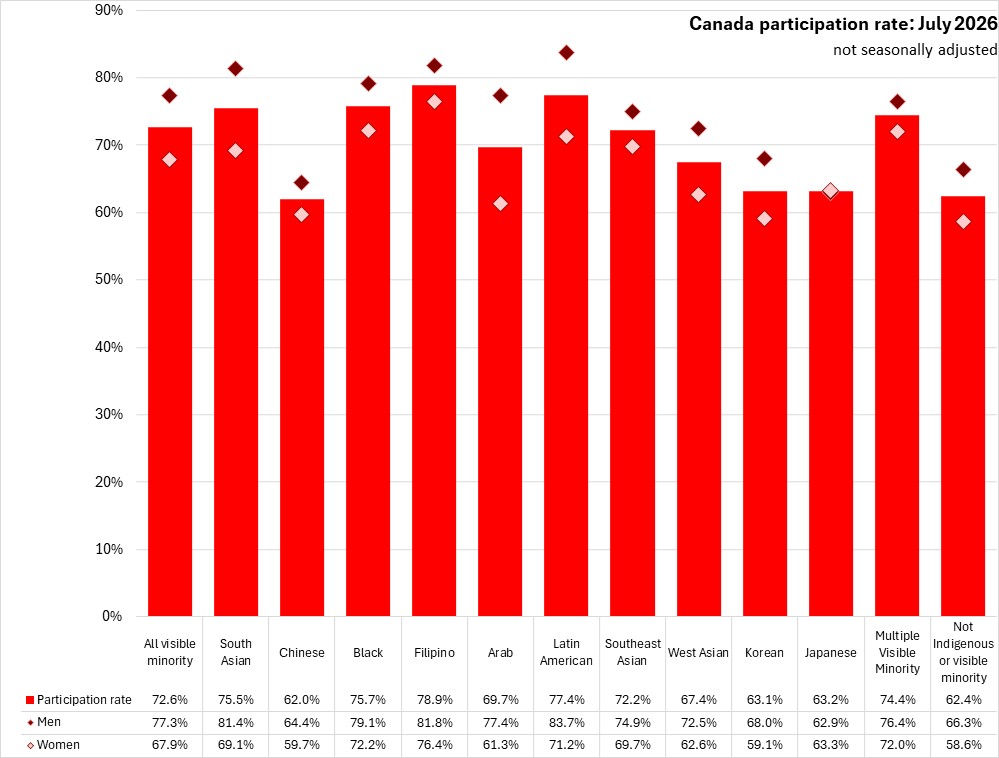
Employment rates were generally higher among visible minority populations than among those who identified neither as Indigenous nor as a visible minority (exceptions: Chinese and Korean populations). Men reported higher employment rates than women in visible minority populations (exception: Japanese). Men also reported higher employment rates than women among populations that did not identify as Indigenous or a visible minority.
Unemployment rates in Canada were higher for all age cohorts of visible minority populations when compared with those that do not identify as Indigenous or in a visible minority population. The largest gap was for workers aged 15-24.
Participation rates of visible minority populations were higher for older workers, compared to the same age cohort that does not identify as Indigenous or visible minority populations. Among youth and core aged workers, participation rates among visible minority populations were lower than among similarly aged populations that do not identify as Indigenous or in a visible minority population.
With lower participation and higher unemployment rates, employment rates were lower for visible minority youth and core aged populations than for those of similar age who do not identify as Indigenous or a visible minority population, except for older workers ages 55+.
Trends
In July 2026, the unemployment rate for the visible minority population was higher compared to the population that was neither Indigenous nor in a visible minority population in Atlantic Canada for the first time in eight months.
Participation and employment rates for visible minority populations in Atlantic Canada are consistently higher than those that identified neither as Indigenous nor in a visible minority population.
Source: Statistics Canada. Table 14-10-0373-01 Labour force characteristics by visible minority group, three-month moving averages, monthly, unadjusted for seasonality
<--- Return to Archive


