The Economics and Statistics Division maintains archives of previous publications for accountability purposes, but makes no updates to keep these documents current with the latest data revisions from Statistics Canada. As a result, information in older documents may not be accurate. Please exercise caution when referring to older documents. For the latest information and historical data, please contact the individual listed to the right.
<--- Return to Archive
For additional information relating to this article, please contact:
August 18, 2026US HOUSING STARTS AND BUILDING PERMITS, JULY 2026 Month over month (July vs June 2026, seasonally adjusted annualized rates)
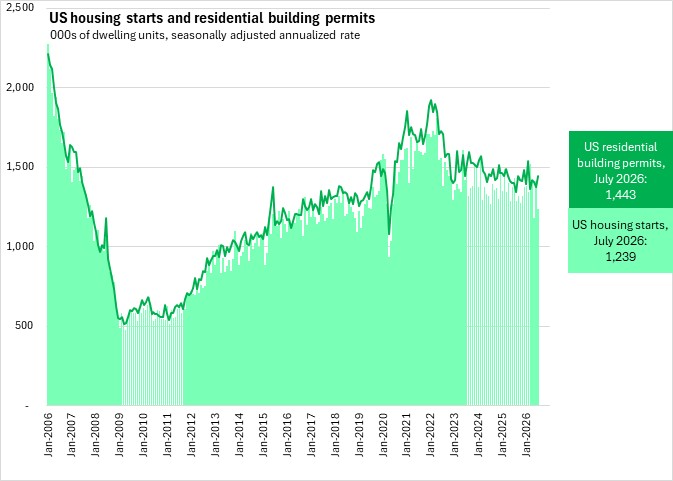
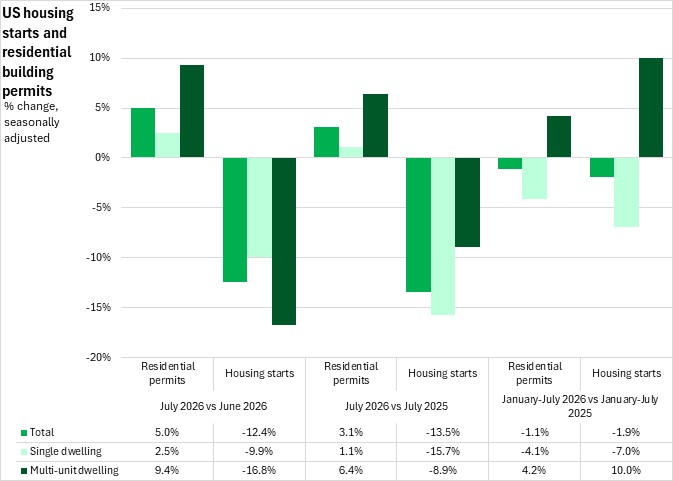
US housing starts were down 12.4% from June to July, falling to a seasonally adjusted annualized rate of 1,239,000 units. There were decreases in both single unit starts (-9.9%) and multi-unit dwelling starts (-16.8%).
The number of residential building permits was up 5.0% to a seasonally adjusted annualized rate of 1,443,000 units. Permits were up for both multiple units (+9.4%) and single units (+2.5%).
Year over year (July 2026 vs July 2025)
Compared to the same month last year, US housing starts were down 13.5%, with decreases in both multiple unit starts (-8.9%) and single unit starts (-15.7%).
Residential building permits were up 3.1% year-over-year. Residential building permit increases occurred for both multi-unit structures (+6.4%) and single unit structures (+1.1%).
Year-to-date (January-July 2026 vs January-July 2025)
From January-July of 2026, US housing starts were down 1.9%. While housing starts for single units declined (-7.0%), those for multi-units increased (+10.0%).
Residential building permits were down 1.1 year-to-date, with decreases in single units (-4.1%) and increases in multi-unit structures (+4.2%).
Note: multi-unit refers to structures with 2-4 units as well as structures were more than 5 units.
Source: US Census Bureau New Residential Construction
<--- Return to Archive


