The Economics and Statistics Division maintains archives of previous publications for accountability purposes, but makes no updates to keep these documents current with the latest data revisions from Statistics Canada. As a result, information in older documents may not be accurate. Please exercise caution when referring to older documents. For the latest information and historical data, please contact the individual listed to the right.
<--- Return to Archive
For additional information relating to this article, please contact:
August 25, 2026VISITOR TRAVEL SURVEY, Q1 2026 Year-over-year (Q1 2026 vs Q1 2025)
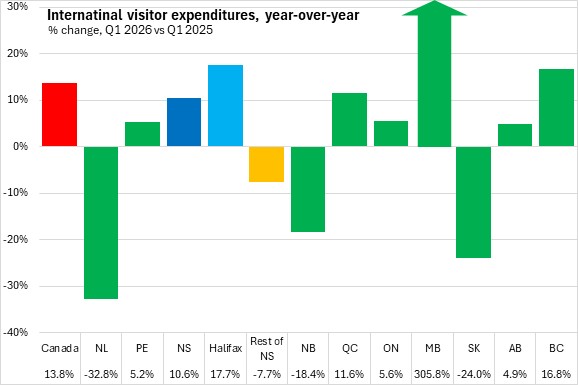
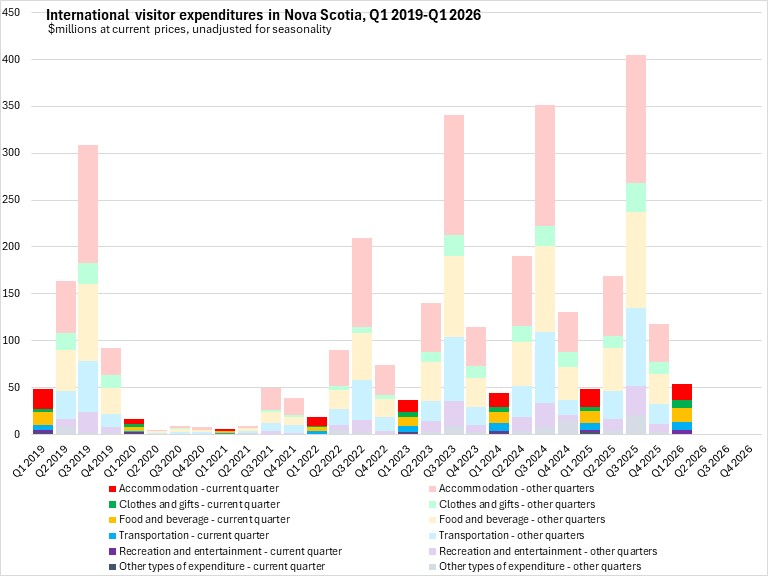
International visitors to Nova Scotia spent $54.1 million in Q1 2026. Visitors from United States accounted for just over half (50.2%) of all the visitor spending in Nova Scotia. International visitor expenditures were up 10.6% from the same period in 2025. Across Canada, international visitor expenditures were up 13.8% with gains in seven provinces led by Manitoba. Newfoundland and Labrador reported the largest year-over-year decline in visitor expenditures in Q1 2026.
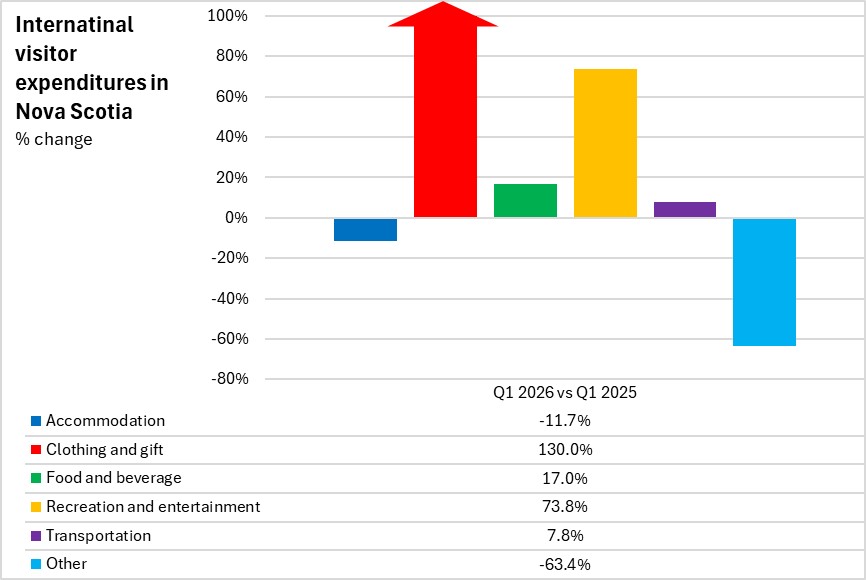
Clothing and gift expenditures reported the largest percentage gain in Nova Scotia's international visitor expenditures, followed by recreation and entertainment. Expenditures were down in Q1 for accommodation and other categories compared to Q1 2025.
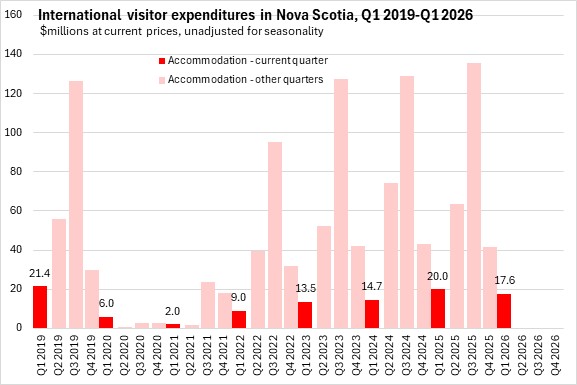
Unadjusted results by quarter show Nova Scotia's Q1 accommodations expenditures by international visitors were little changed over the last four years.
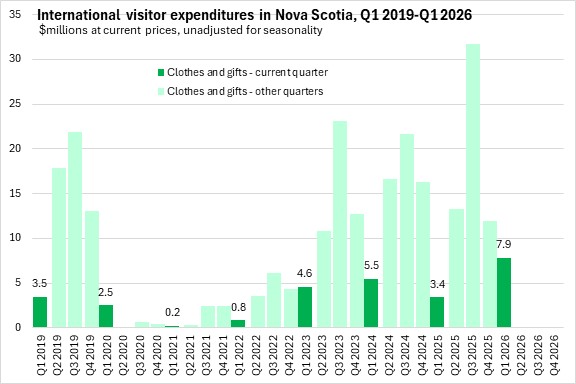
Clothing and gift spending by international visitors to Nova Scotia were more than twice as high as the 2025 Q1 results.
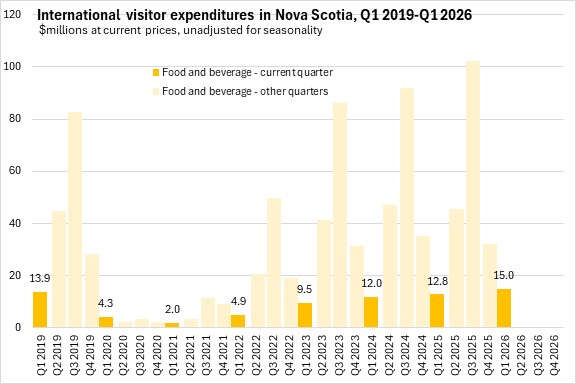
Food and beverage spending in Nova Scotia by international visitors was comparable with expenditures in the past two years.
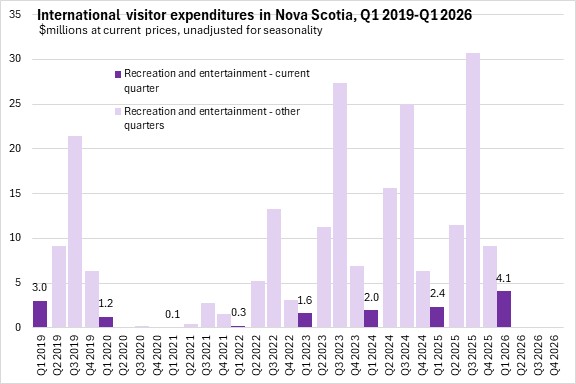
Recreation and entertainment spending in Nova Scotia by international visitors increased sharply in Q1 2026 compared to the past three years.
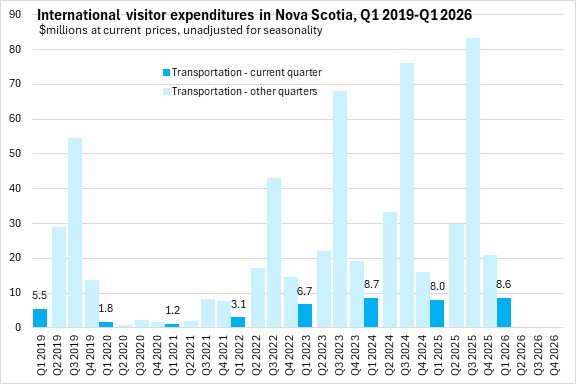
Expenditures on transportation (including the effects of fuel price changes) were in line with the past three years in Q1 2026.
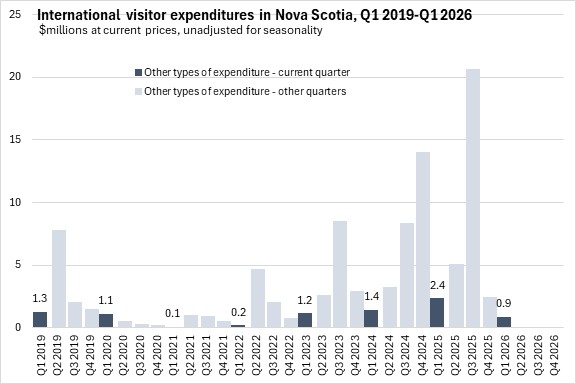
Other international visitor spending in Nova Scotia was substantially lower in Q1 2026 than Q1 2025.
The distribution of international visitor expenditures by category in Q1 2026 was comparable to that in Q1 2025.
Notes: Statistics Canada’s Visitor Travel Survey (VTS) provides quarterly statistics on United States and overseas visitors to Canada, their characteristics of travel and their spending levels. From the first quarter of 2018 to the first quarter of 2020, spending data were derived from a Small Area Estimation model. Collection activity related to the VTS was suspended in March 2020 because of the COVID-19 pandemic; estimates from the second quarter of 2020 to the first quarter of 2023 were produced using a model based on historical 2019 VTS estimates combined with alternate data and adjusted with Frontier Counts results. As of April 2023, VTS collection partially resumed, with the Air Exit Survey (AES) restarting in five major Canadian airports. The non-air component of VTS (visitors arriving by modes of transportation other than air) uses modelled data based on historical VTS estimates while the air component is based on estimates obtained from AES survey results.
The Frontier Counts program at Statistics Canada receives administrative data from the Canada Border Services Agency (CBSA) on all international arrivals into the country, consisting of both non-resident visitors to Canada and Canadian residents returning from abroad.
Source: Statistics Canada. Table 24-10-0066-01 Visits, nights and spending for visitors to Canada by geography of visit, residency and mode of transport (x 1,000)
<--- Return to Archive


