The Economics and Statistics Division maintains archives of previous publications for accountability purposes, but makes no updates to keep these documents current with the latest data revisions from Statistics Canada. As a result, information in older documents may not be accurate. Please exercise caution when referring to older documents. For the latest information and historical data, please contact the individual listed to the right.
<--- Return to Archive
For additional information relating to this article, please contact:
September 22, 2026CANADIAN HOUSING SURVEY, 2024 Recently Statistics Canada released results from the 2024 Canadian Housing Survey, with data on housing affordability, core housing need and its dimensions, household composition, first-time homebuyers, and indicators related to moving. Data are available at the provincial level, as well as for different population-centre sizes, census agglomerations and census metropolitan areas. Collection for the 2024 Canadian Housing Survey took place from October 28, 2024 to March 31, 2025. Canadian Housing Survey.
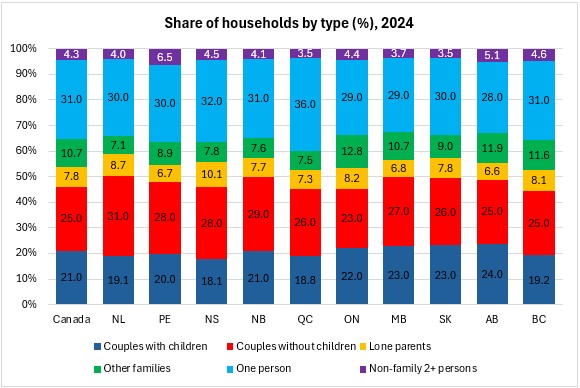
In 2024, Nova Scotia had an estimated 472,500 households. Household composition continued to differ across community sizes, reflecting differences in family structure and the prevalence of one-person and non-family households.
Among Nova Scotia households, the largest shares were one-person households (32.0%) and couples without children (28.0%). Compared with the national average, Nova Scotia had a larger share of one-person households (32.0% versus 31.0%) and lone-parent households (10.1% versus 7.8%). Nova Scotia reported smaller shares of couples with children (18.1% versus 21.0%) and other family households (7.8% versus 10.7%). Non-family households with two or more people represented 4.5% of Nova Scotia households, compared with 4.3% nationally.
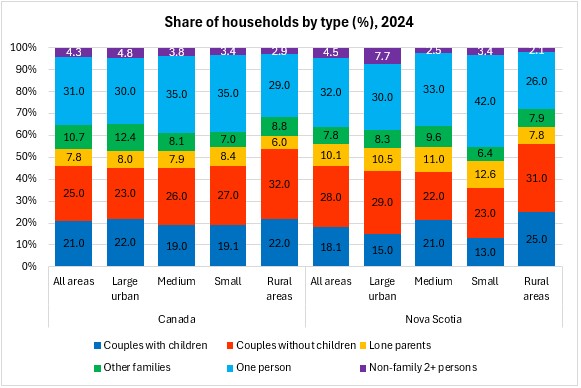
Household composition differed markedly across community sizes. One-person households were most prevalent in Nova Scotia's small population centres, accounting for 42.0% of households, compared with 30.0% in large urban areas and 26.0% in rural areas. Couples with children accounted for 25.0% of rural households, compared with 13.0% in small population centres. Lone-parent households were also more prevalent in small and medium population centres than in rural areas.
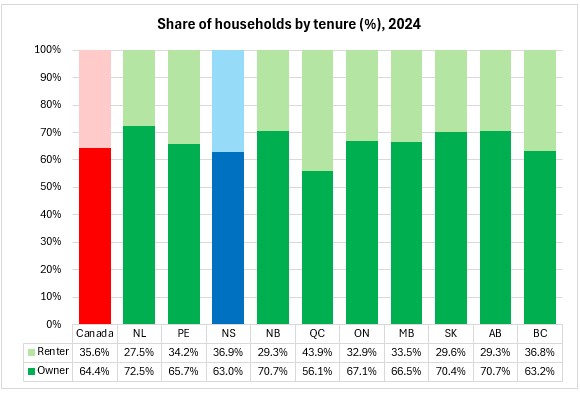
Renters made up 36.9% of Nova Scotia's households in 2024 while 63.0% were homeowners. Compared with the national average, Nova Scotia had a slightly lower homeownership rate (63.0% versus 68.6%) and a correspondingly higher share of renter households (36.9% versus 31.4%).
Across the provinces, homeownership rates ranged from 56.1% in Quebec to 78.6% in Newfoundland and Labrador. Nova Scotia's homeownership rate was below the rates observed in the other Atlantic provinces and below the national average.
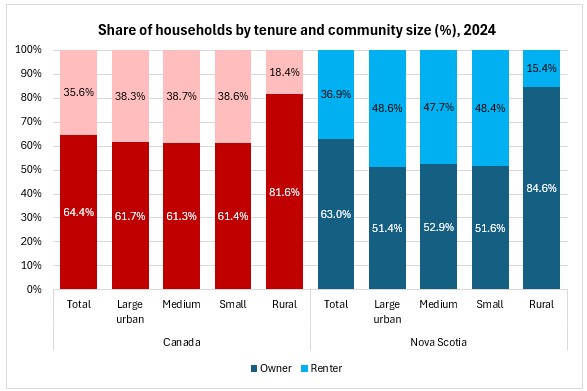
Tenure patterns varied considerably by community size. In Nova Scotia, homeownership was highest in rural areas, where 84.6% of households were owners, compared with 51.4% in large urban population centres, 52.9% in medium population centres and 51.6% in small population centres. As a result, renters accounted for nearly half of households in Nova Scotia's large urban, medium and small population centres, but only 15.4% of households in rural areas.
A similar pattern was observed nationally. Rural areas had substantially higher rates of homeownership (81.6%) than large urban (61.7%), medium (61.3%) or small (61.4%) population centres. Nova Scotia's large urban, medium and small population centres all had lower homeownership rates than the corresponding national averages, while Nova Scotia's rural homeownership rate was slightly higher than the national rural rate.
The differences between Nova Scotia's urban and rural areas were particularly pronounced. In large urban population centres, renters accounted for almost one-half of households (48.6%), compared with only 15.4% of households in rural areas. This urban-rural divide was larger than that observed nationally.
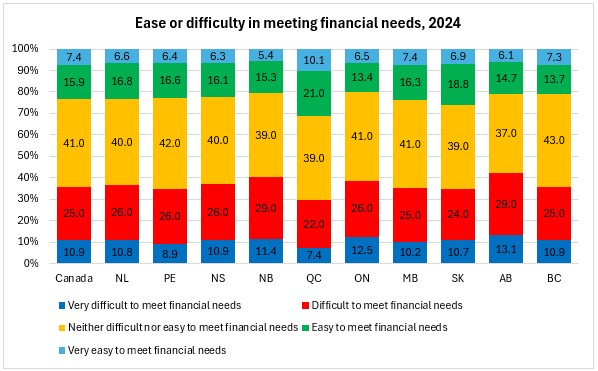
The housing survey asked respondents about their difficulty or ease in meeting household financial needs. In 2024, 17.6% of Nova Scotia households reported that meeting financial needs was “easy” or “very easy”, while 43.5% reported that meeting financial needs was “difficult” or “very difficult.” A further 38.0% reported that meeting financial needs was neither difficult nor easy.
Compared with the national average, Nova Scotia reported a higher share of households experiencing financial difficulty. Nationally, 45.0% of households reported that meeting financial needs was difficult or very difficult, while 17.7% reported that meeting financial needs was easy or very easy. Across the provinces, the highest shares reporting difficult or very difficult financial conditions were observed in Alberta (52.9%) and British Columbia (44.6%), while the lowest shares were reported in Quebec (40.4%) and Ontario (47.3%).
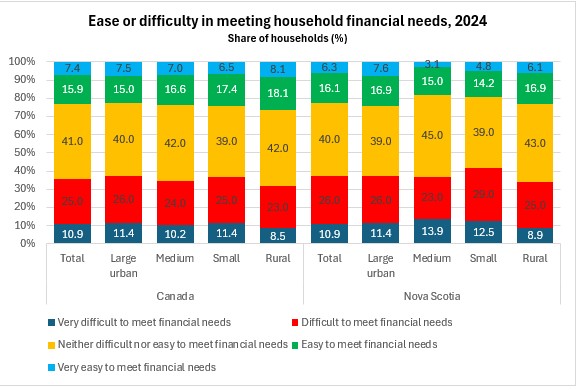
Financial conditions also varied by community size. In Nova Scotia, households in small population centres reported the highest levels of financial difficulty. The combined share reporting that meeting financial needs was difficult or very difficult was 36.9% in medium population centres and 36.9% in large urban population centres, rising to 42.1% in small population centres. Rural areas reported the lowest share of households experiencing financial difficulty at 33.9%.
The highest share reporting that meeting financial needs was easy or very easy was observed in Nova Scotia's rural areas (23.0%), followed closely by large urban population centres (22.4%). Lower shares were reported in small population centres (19.0%) and medium population centres (18.1%). These results suggest that financial conditions were generally more favourable in Nova Scotia's rural and large urban areas than in its medium and small population centres.
Core housing need identifies households whose housing falls below at least one of the established standards for affordability, adequacy or suitability and that would be unable to afford alternative suitable housing in their community.
Core housing need is defined as the portion of households experiencing at least one of:
- unaffordability (spending 30% or more of income on housing)
- inadequacy (requiring major repairs)
- unsuitability (insufficient bedrooms or housing size for household composition)
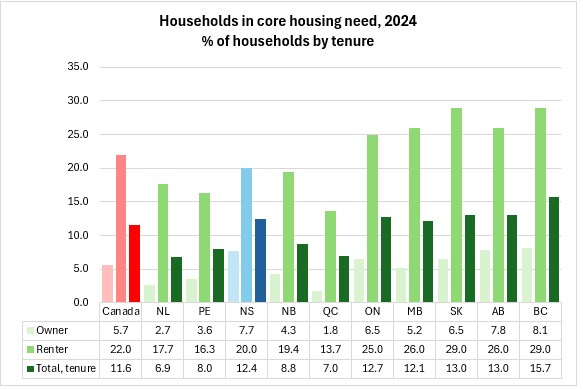
In 2024, 12.4% of Nova Scotia households were in core housing need, down slightly from 12.9% in 2022. Nationally, 11.6% of households were in core housing need, unchanged from 2022. Nova Scotia's rate remained above the national average.
Across the provinces, British Columbia reported the highest rate of core housing need (15.7%), followed by Saskatchewan (13.0%), Alberta (13.0%), and Ontario (12.7%). Nova Scotia ranked fifth among the provinces in 2024. The lowest rates were reported in Newfoundland and Labrador (6.9%) and Quebec (7.0%).
While Nova Scotia's core housing need rate declined from 12.9% in 2022 to 12.4% in 2024, several western provinces experienced notable increases. Saskatchewan increased from 9.4% to 13.0%, while Alberta increased from 11.3% to 13.0%. As a result, Nova Scotia's relative ranking among provinces improved despite remaining above the national average.
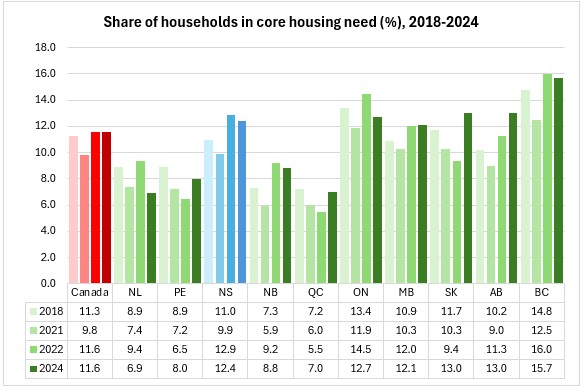
Nova Scotia's core housing need rate declined modestly from 2022, while remaining above the levels reported in both 2018 (11.0%) and 2021 (9.9%). Nationally, the decline in core housing need observed between 2018 and 2021 has largely reversed in many provinces.
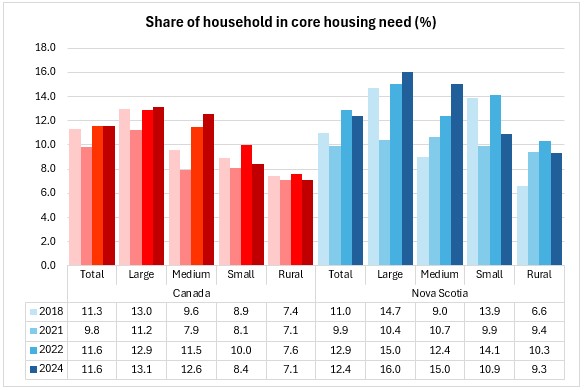
Core housing need varied considerably by community size. In Nova Scotia, the highest rates were observed in large urban population centres (16.0%) and medium population centres (15.0%), while lower rates were observed in small population centres (10.9%) and rural areas (9.3%).
Nationally, a similar pattern was observed, with core housing need tending to be highest in larger urban areas and lowest in rural areas. In 2024, the national rate was 13.1% in large urban population centres, compared with 7.1% in rural areas.
Changes within Nova Scotia differed considerably by community size. Between 2022 and 2024, core housing need rose in both large urban population centres (15.0% to 16.0%) and medium population centres (12.4% to 15.0%). Conversely, core housing need declined in small population centres (14.1% to 10.9%) and rural areas (10.3% to 9.3%).
Core housing need remained substantially more prevalent among renter households than owner households in 2024. In Nova Scotia, 20.0% of renter households were in core housing need compared with 7.7% of owner households.
Renters were approximately 2.6 times more likely than homeowners to be in core housing need in Nova Scotia. This pattern was observed across all provinces. Nova Scotia's renter core-housing-need rate exceeded the national average, while its owner rate was below the national average.
Across the provinces, renter households in British Columbia and Saskatchewan (27.0%) reported the highest rates of core housing need, followed by Ontario and Newfoundland and Labrador (26.0%). Among homeowners, rates were substantially lower, ranging from 2.0% in Quebec to 8.7% in British Columbia.
Although renters represented only 36.9% of Nova Scotia households, they accounted for a disproportionate share of households experiencing core housing need.
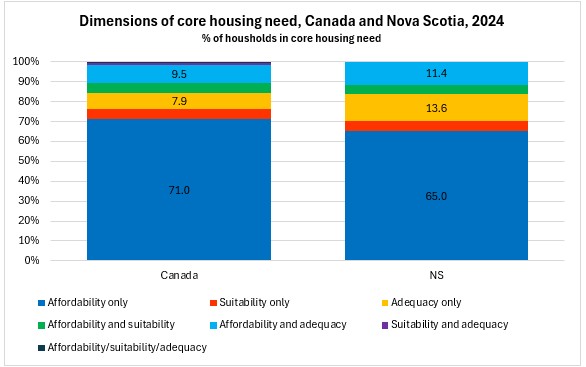
The Canadian Housing Survey identifies three dimensions of core housing need:Affordability: housing costs equal to or exceeding 30% of before-tax household income.
- Adequacy: dwellings requiring major repairs.
- Suitability: dwellings that do not have enough bedrooms for the size and composition of the household.
- Affordability continued to be the dominant dimension of core housing need in both Nova Scotia and Canada.
In 2024, 74.0% of Nova Scotia households in core housing need were below the affordability threshold only, compared with 75.0% nationally.
The second most common dimension in Nova Scotia was being below both the affordability and adequacy thresholds (12.1%), followed by being below the adequacy threshold only (9.3%). In comparison, the corresponding shares nationally were 9.0% and 6.3%, respectively.
Affordability alone accounted for approximately three-quarters of households in core housing need in both Nova Scotia and Canada. Nova Scotia reported a somewhat larger share of households facing adequacy-related challenges, either on their own or in combination with affordability, than Canada overall. By contrast, relatively few households in core housing need were affected by suitability issues alone or by combinations involving suitability. These results suggest that housing costs remained the primary driver of core housing need, while housing condition issues were somewhat more prevalent in Nova Scotia than nationally.
Source:
<--- Return to Archive


