The Economics and Statistics Division maintains archives of previous publications for accountability purposes, but makes no updates to keep these documents current with the latest data revisions from Statistics Canada. As a result, information in older documents may not be accurate. Please exercise caution when referring to older documents. For the latest information and historical data, please contact the individual listed to the right.
<--- Return to Archive
For additional information relating to this article, please contact:
September 23, 2026NOVA SCOTIA ANNUAL POPULATION ESTIMATES AS OF JULY 1, 2026 Note: population estimates for July 1 and components of population change in the 12 months up to July 1 are conventionally referred to as 'annual' population estimates.
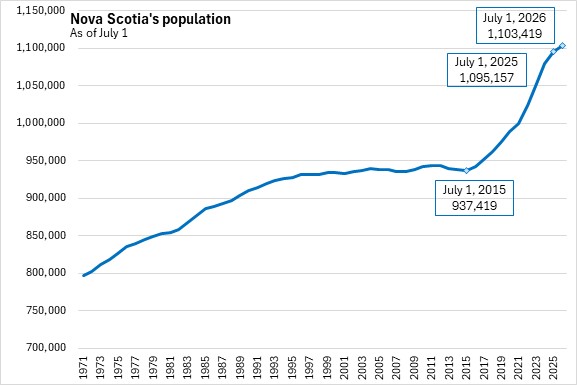
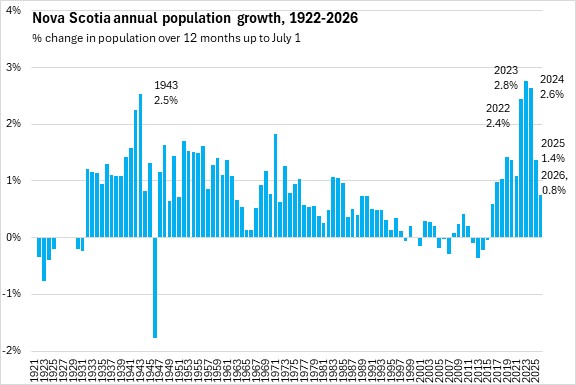
As of July 1, 2026, Nova Scotia's population was estimated to be 1,103,419, an increase of 8,262 (+0.8%) over the revised July 1, 2025 estimate (1,095,157). Since July 1, 2015, Nova Scotia's population has increased by 166,000.
With this release, Statistics Canada has revised historical estimates of Nova Scotia's population, increasing the previous estimate of the province's population as of July 1, 2025 by 1,912.
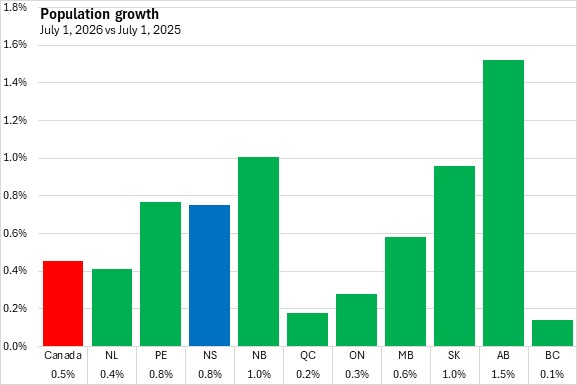
National population growth was +0.5% from July 1, 2025 to July 1, 2026. The fastest growth was observed in Alberta while the slowest population gain was in British Columbia.
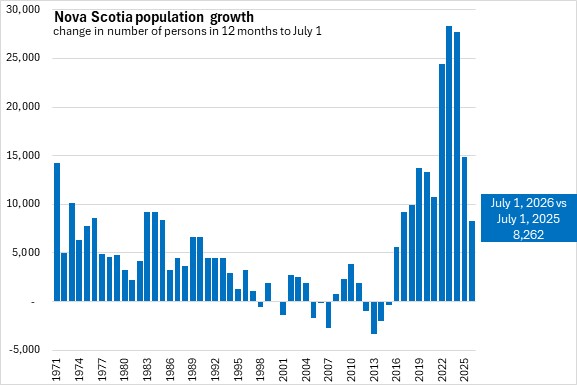
Nova Scotia's July 1, 2025 to July 1, 2026 population increase was 8,262, a smaller gain than in any of the previous 9 years.
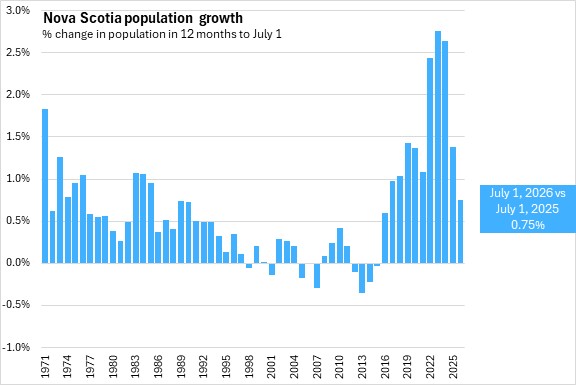
In percentage terms, Nova Scotia's growth of 0.75% was slowest since the pace last observed in 2017.
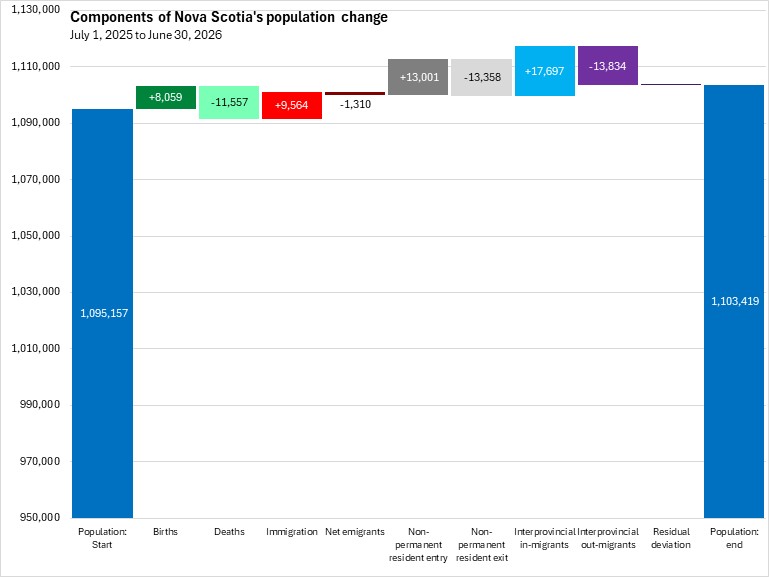
Nova Scotia's population growth was attributable to immigration (9,564, which far exceeds emigration of 1,310) as well as net increase due to net interprovincial migration (+3,863). Net non-permanent residents declined by 357. Annual births edged up to 8,059 while deaths rose to 11,557.
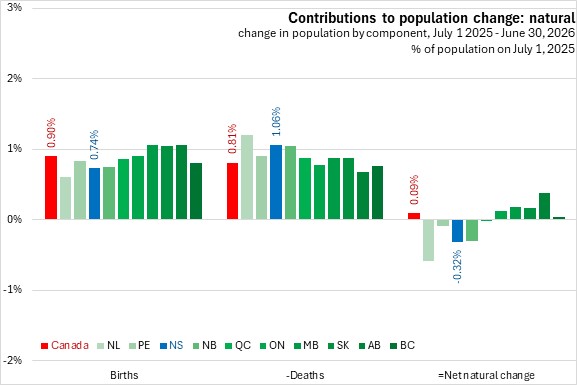
When measured as a percentage of the population on July 1, 2025, Nova Scotia reported less population growth as a result of births and steeper population decline as a result of deaths. Although Canada's national population was still increasing because of natural population change (births less deaths), deaths outnumbered births in all Atlantic provinces and Québec.
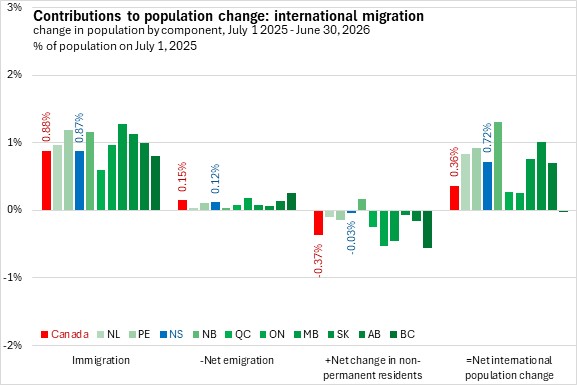
International migration is the main contributor to Canada's population growth. Measured as a share of the July 1, 2025 population immigration contributed about the slightly less to Nova Scotia's population growth than it contributed to national population growth. Manitoba reported the largest contribution to population gain from immigration while Québec reported the least contribution from immigration.
Net emigration (including returning emigrants) was a comparatively small drain on the population for all provinces (highest: British Columbia, lowest: Newfoundland and Labrador).
The contributions to population growth as a result of net change in non-permanent residents were down from July 1, 2025 to July 1, 2026. Nova Scotia's population received a small net decline in non-permanent residents. Nationally, net change in non-permanent residents contributed to a population decline (primarily due to declines in all provinces except New Brunswick).
Considering immigration, net emigration and non-permanent residents, all provinces reported net international population gains, led by New Brunswick and Saskatchewan. Nova Scotia's net international population gains were above the national average.
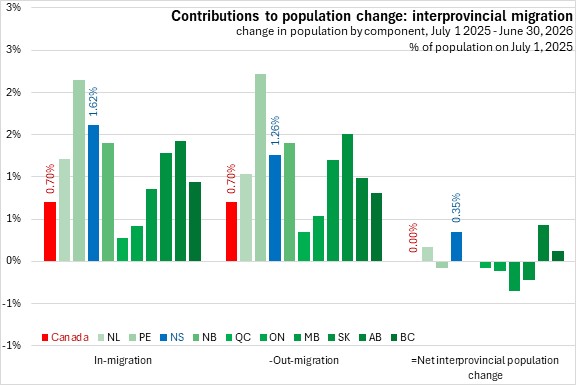
Nova Scotia reported a larger than average contribution to population growth as a result of interprovincial in-migration (measured as a percentage of July 1, 2025 population). Out-migration to other provinces was a larger drain on Nova Scotia's population than the national average. Alberta and Nova Scotia reported the strongest contributions to population growth from net interprovincial migration. Manitoba reported the largest percentage decline as a result of net interprovincial migration.
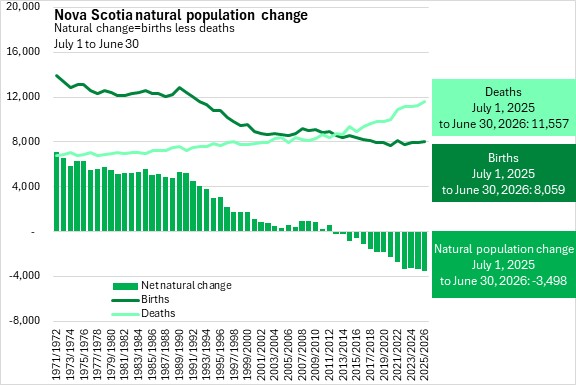
Natural population change (births less deaths) continued to put downward pressure on Nova Scotia's population. From July 1, 2025 to July 1, 2026 there were 8,059 births and 11,557 deaths, resulting in a net natural population change of -3,498 over this period.
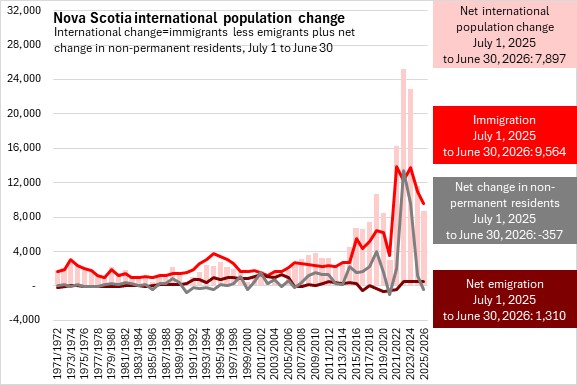
From July 1, 2025 to July 1, 2026, Nova Scotia reported 9,564 immigrants coming to the province. This was down from the record immigration levels reported in recent years, but higher than immigration reported in 2020 and prior years.
Net emigration resulted in 1,310 persons moving from the province to another country between July 1, 2025 and July 1, 2026.
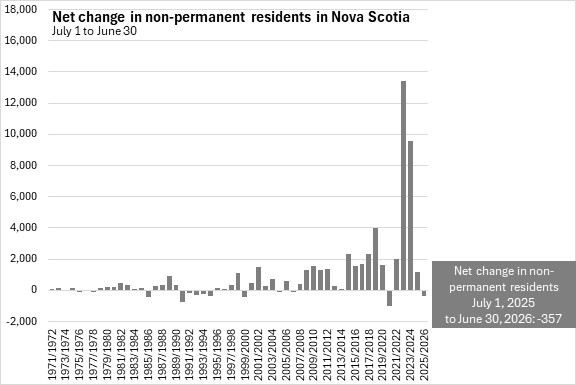
The change in non-permanent residents (which includes students and temporary foreign workers) was a loss of 357 persons, the first decline after 2021.
Accounting for the decline resulting from net emigration and non-permanent residents and the gains from immigrants and the net international population change for Nova Scotia was +7,897 from July 1, 2025 to July 1, 2026 - a substantial decline from the previous four years.
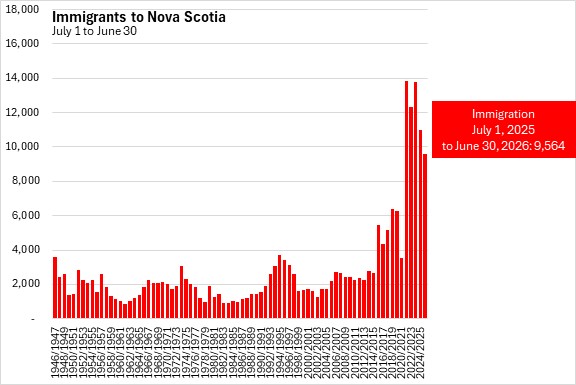
Although slower from July 1, 2025 to June 30, 2026, Nova Scotia's immigration levels remain near all-time highs, well above any pace of immigration reported before 2020.
Net change in non-permanent residents has declined from July 1, 2025 to June 30, 2026.
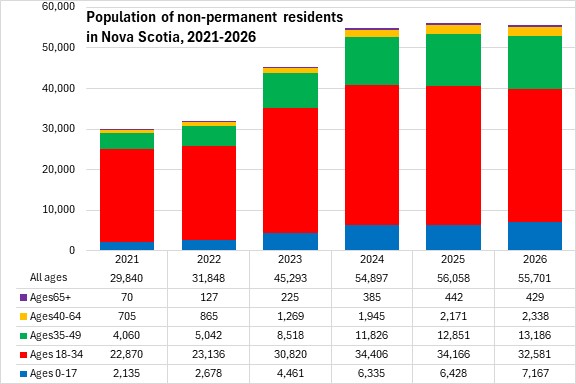
The number of non-permanent residents in Nova Scotia as of July 1, 2026 was 55,701, with the overwhelming majority of non-permanent residents falling between the ages of 18 and 34.
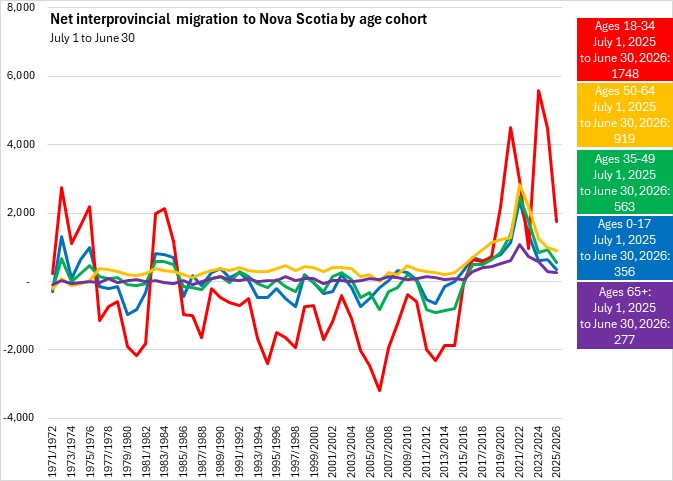
The period from July 1, 2025 to July 1, 2026 marked the eleventh consecutive year of positive net interprovincial migration to Nova Scotia. However, the pace of in-migration and net migration slowed sharply since 2022. Net migration was positive for those aged 0-17, 18-34, 35-49, 50-64 as well as for those aged 65 and older.
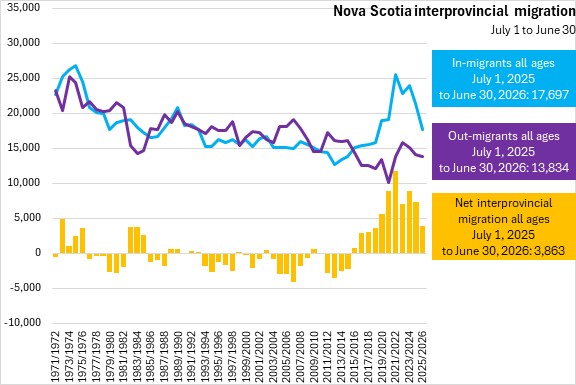
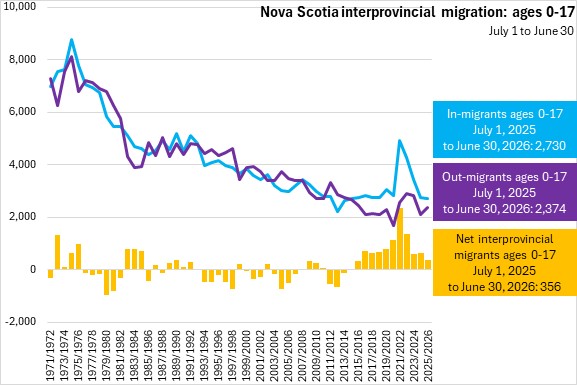
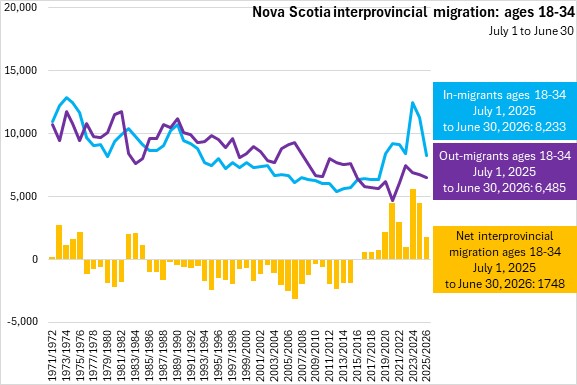
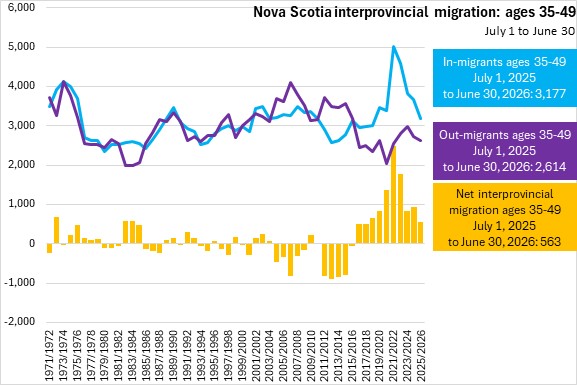
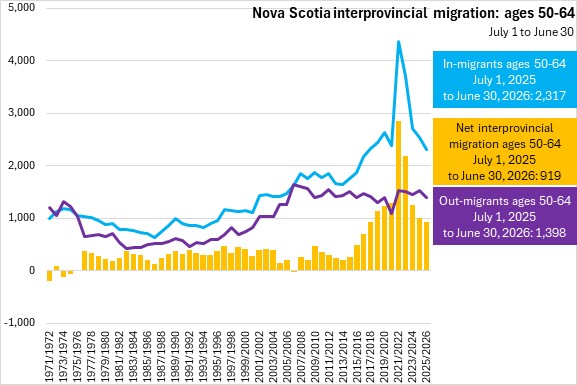
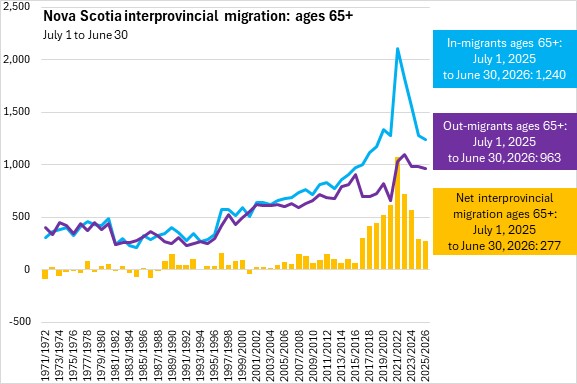
Net interprovincial migration slowed for most age cohorts, though the deceleration was more modest among those aged 50-64.
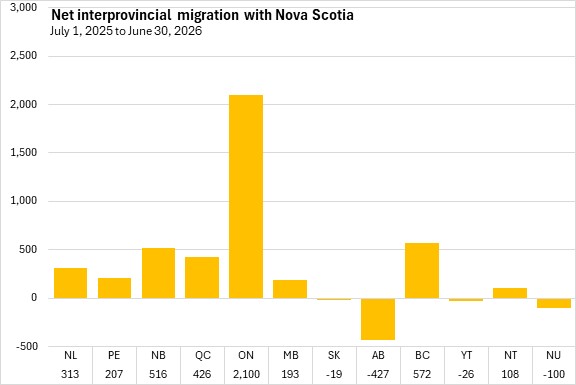
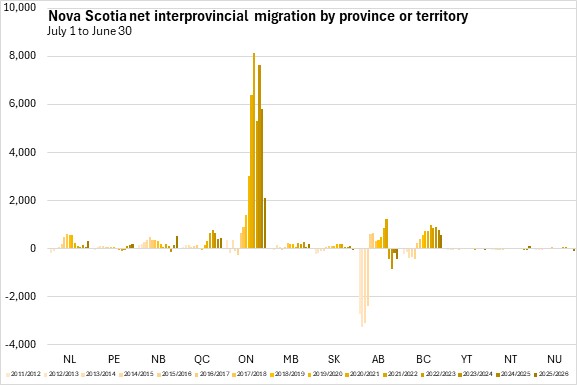
By source and destination, the largest source of net interprovincial migration to Nova Scotia was Ontario (+2,100) while the largest net outflow from Nova Scotia was to Alberta (-427).
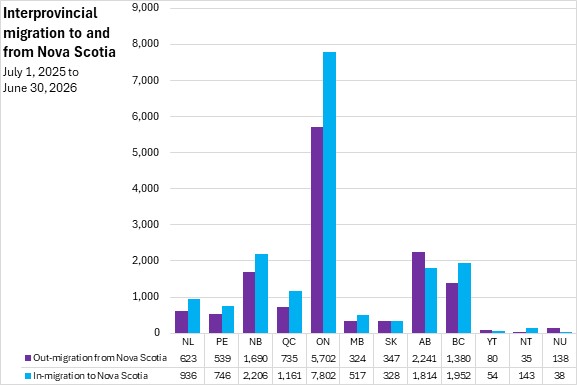
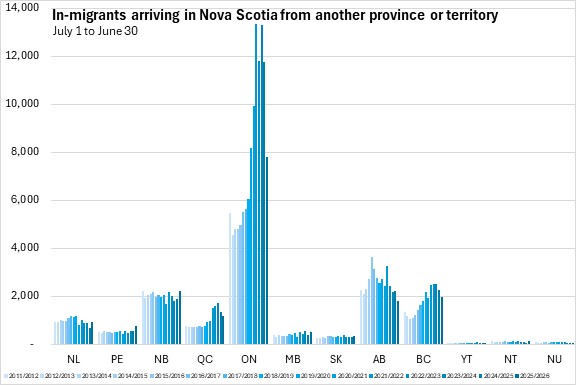
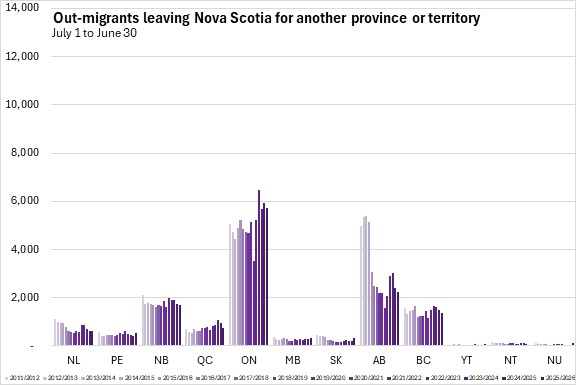
After a sharp rise in in-migration to Nova Scotia from Ontario over the past decade, the pace of in-migration has cooled again. In-migration from Alberta, British Columbia and Québec has also fallen.
From July 1, 2025 to July 1, 2026, Ontario continued to be the largest destination for out-migrants leaving Nova Scotia. Out-migration from Nova Scotia slowed for all regions except Newfoundland and Labrador, Prince Edward Island, Manitoba, Saskatchewan, Yukon and Nunavut.
Net interprovincial migration with Alberta remains the most substantial net drain for Nova Scotia.
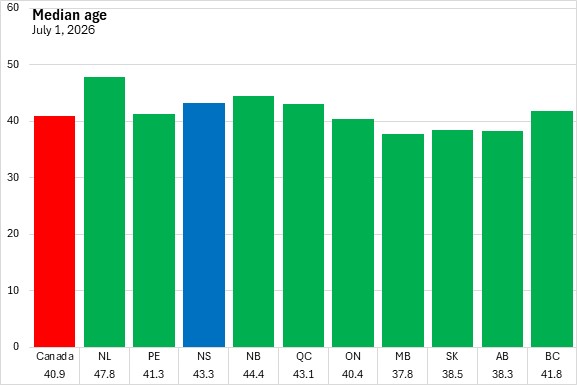
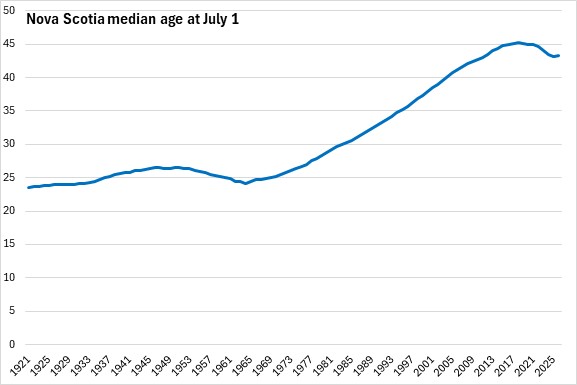
Prior increases in international and interprovincial migration were concentrated among younger cohorts, lowering Nova Scotia's median age substantially. With these population flows slowing, Nova Scotia's median age edged up from July 1, 2025 to July 1, 2026 to 43.3 years. Nova Scotia reported the third highest median age among provinces after Newfoundland and Labrador and New Brunswick. The national median age was 40.9 years with the lowest median age in Manitoba (37.8 years).
Nova Scotia's median age in 2026 has increased for the first time since 2018.
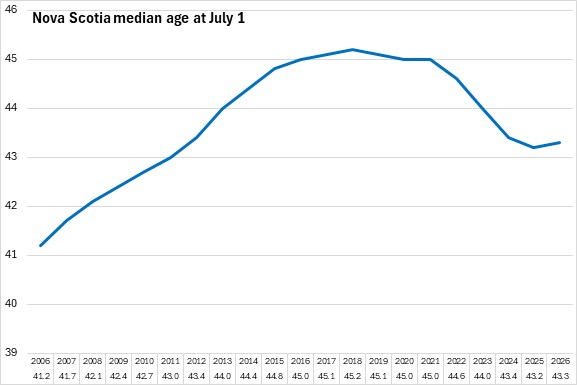
Nova Scotia's population last experienced an extended decline in median age during the late 1950s and early 1960s following elevated births from the baby boom.
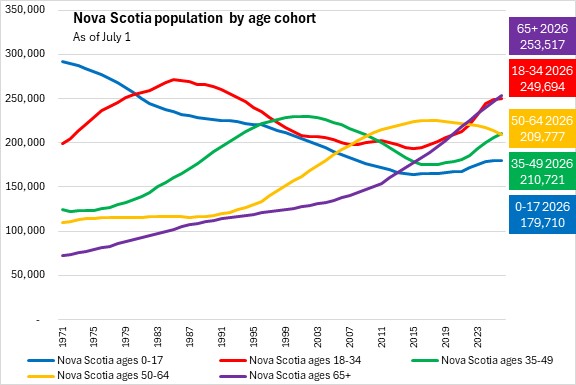
Immigration and net interprovincial migration have contributed to a reversal in declining populations of Nova Scotia's younger cohorts, particularly for those aged 0-17 as well as those aged 35-49. The population growth aged 18-34 slowed in recent years.
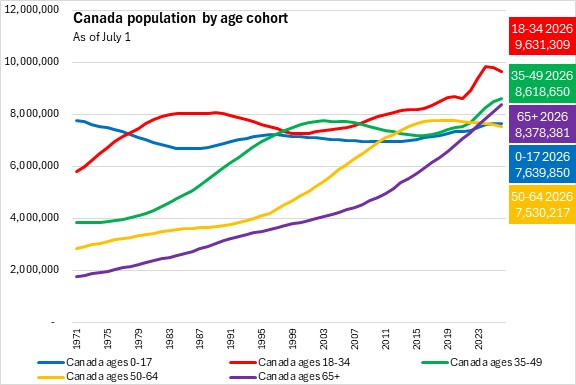
Canada's population aged 18-34 continued to decline in 2026. The number of seniors in Canada now exceeds the numbers of Canadians aged 0-17 as well as 50-64.
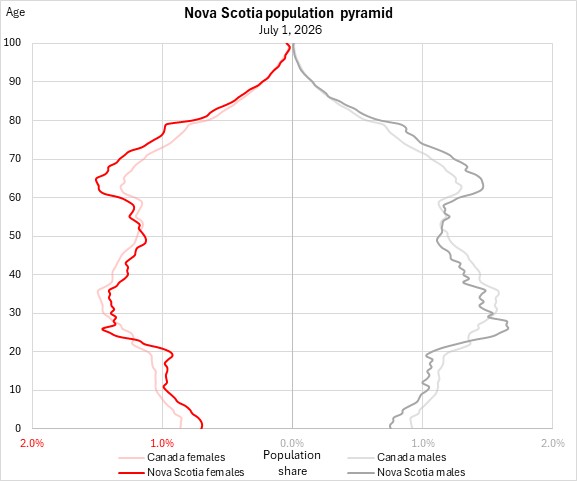
Despite a revival of growth among younger population cohorts in Nova Scotia, the population pyramid shows an older population than the national age distribution.
Source: Statistics Canada. Table 17-10-0005-01 Population estimates on July 1st, by age and sex, Table 17-10-0008-01 Estimates of the components of demographic growth, annual, Table 17-10-0014-01 Estimates of the components of international migration, by age and sex, annual, Table 17-10-0015-01 Estimates of the components of interprovincial migration, by age and sex, annual, Table 17-10-0022-01 Estimates of interprovincial migrants by province or territory of origin and destination, annual, Table 17-10-0009-01 Population estimates, quarterly, Table 17-10-0040-01 Estimates of the components of international migration, quarterly, Table 17-10-0020-01 Estimates of the components of interprovincial migration, quarterly
<--- Return to Archive


