The Economics and Statistics Division maintains archives of previous publications for accountability purposes, but makes no updates to keep these documents current with the latest data revisions from Statistics Canada. As a result, information in older documents may not be accurate. Please exercise caution when referring to older documents. For the latest information and historical data, please contact the individual listed to the right.
<--- Return to Archive
For additional information relating to this article, please contact:
October 06, 2026CANADA TRADE BALANCE, AUGUST 2026 Month-over-month (August 2026 vs July 2026)
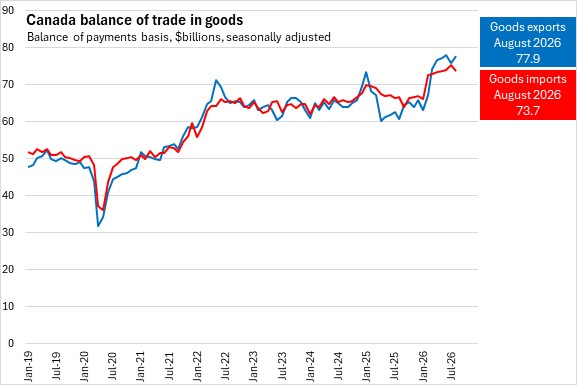
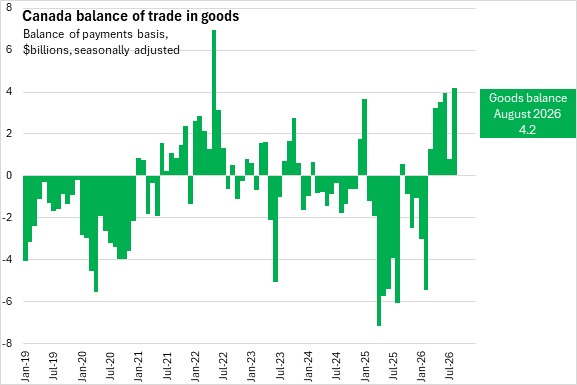
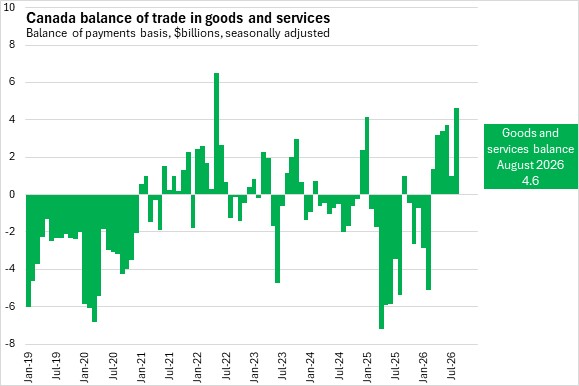
In August 2026, Canada's international exports of goods increased 2.5% to $77.9 billion, while goods imports declined 2.0% to $73.7 billion. As a result, Canada's goods trade surplus widened by $3.4 billion to $4.2 billion in August, following a surplus of $0.8 billion in July. Combined with a larger services surplus, Canada's overall goods and services trade surplus increased from $1.0 billion to $4.6 billion.
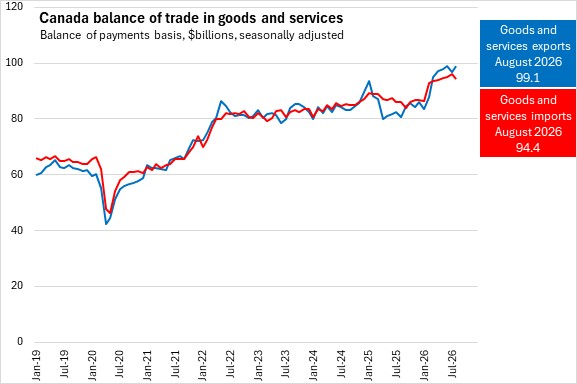
The improvement in Canada's trade position reflected higher exports and lower imports in August. Total exports of goods and services increased 2.1% to $99.1 billion, while total imports fell 1.7% to $94.4 billion. Canada's combined goods and services trade surplus rose by $3.6 billion to $4.6 billion.
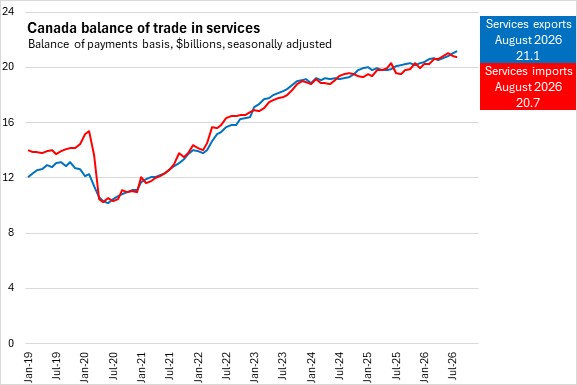
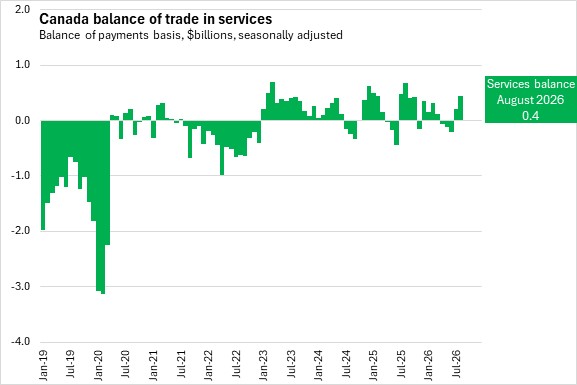
Services exports increased 0.7% to $21.1 billion in August, while services imports edged down 0.4% to $20.7 billion. This resulted in the services trade surplus widening from $0.2 billion in July to $0.4 billion in August. Exports of commercial services and travel services increased, while exports of transportation services declined. On the import side, transportation, travel and commercial services imports all decreased.
Canada's international exports of goods and services increased 2.1% to $99.1 billion in August 2026, while imports of goods and services declined 1.7% to $94.4 billion.
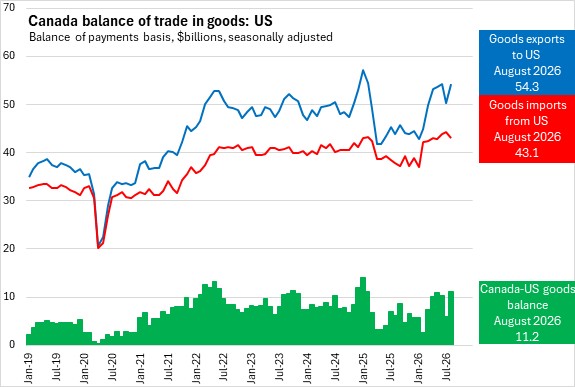
Exports of goods to the United States increased 8.1% to $54.3 billion in August 2026, while imports of goods from the United States declined 2.5% to $43.1 billion. As a result, Canada's merchandise trade surplus with the United States widened by $5.2 billion, from $6.1 billion in July to $11.2 billion in August 2026.
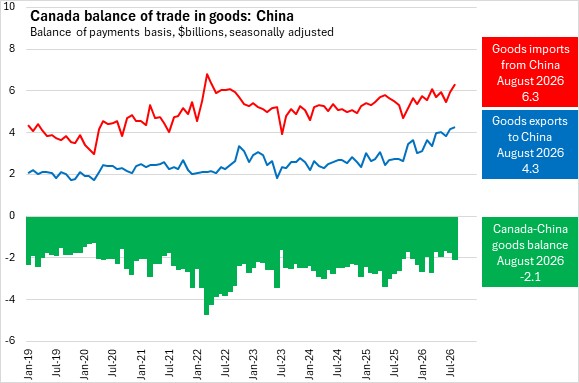
Canada's exports of goods to China increased 1.5% to $4.3 billion in August 2026, while imports of goods from China rose 6.3% to $6.3 billion. As a result, Canada's merchandise trade deficit with China widened by $312 million, from $1.8 billion in July to $2.1 billion in August 2026.
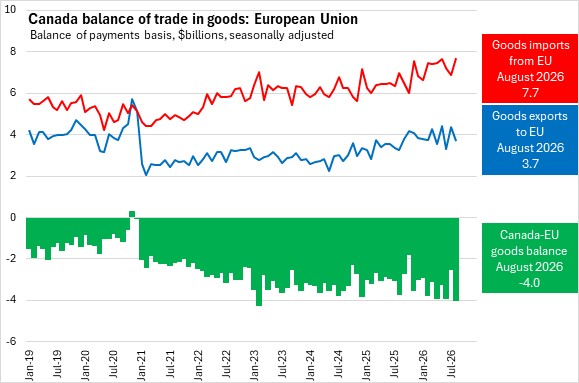
In August 2026, Canada's exports of goods to the European Union decreased 15.5% to $3.7 billion, while imports of goods from the European Union increased 12.3% to $7.7 billion. As a result, Canada's merchandise trade deficit with the European Union widened by $1.5 billion, from $2.5 billion in July to $4.0 billion in August 2026.
Year-over-year (August 2026 vs August 2025)
Compared with the same month in 2025 in Canada:
- International exports of goods rose 28.4% (+$17.2 billion) and Canada’s goods imports rose 10.5% (+$7.0 billion). Canada’s goods trade position improved by $10.3 billion, from a deficit of $6.1 billion in August 2025 to a surplus of $4.2 billion in August 2026.
- International exports of services increased 4.8% (+$961 million) and Canada’s imports of services increased 6.2% (+$1.2 billion). As a result, Canada’s services trade balance deteriorated by $243 million, from a surplus of $677 million in August 2025 to a surplus of $434 million in August 2026.
- Combined international exports of goods and services rose 22.5% (+$18.2 billion), while imports of goods and services increased 9.5% (+$8.2 billion). Canada's overall international trade position improved by $10.0 billion, from a deficit of $5.4 billion in August 2025 to a surplus of $4.6 billion in August 2026.
- Exports of goods from Canada to the United States increased 23.7% (+$10.4 billion) and imports of goods from the United States rose 13.9% (+$5.3 billion). As a result, Canada’s goods trade surplus with the United States widened by $5.2 billion, from $6.1 billion in August 2025 to $11.2 billion in August 2026.
- Exports of goods to China increased 55.5% (+$1.5 billion), while imports of goods from China rose 18.4% (+$981.6 million). Canada’s goods trade deficit with China narrowed by $538.4 million, from $2.6 billion in August 2025 to $2.1 billion in August 2026.
- Exports of goods to the European Union increased 14.4% (+$466.5 million) and imports of goods from the European Union rose 10.7% (+$744.7 million). Canada’s goods trade deficit with the European Union widened by $278.1 million, from $3.7 billion in August 2025 to $4.0 billion in August 2026.
Source: Statistics Canada, Table 12-10-0011-01 International merchandise trade for all countries and by Principal Trading Partners, monthly (x 1,000,000); Table 12-10-0121-01 International merchandise trade by commodity, monthly (x 1,000,000); Table 12-10-0144-01 International trade in services, monthly (x 1,000,000)
<--- Return to Archive


