The Economics and Statistics Division maintains archives of previous publications for accountability purposes, but makes no updates to keep these documents current with the latest data revisions from Statistics Canada. As a result, information in older documents may not be accurate. Please exercise caution when referring to older documents. For the latest information and historical data, please contact the individual listed to the right.
<--- Return to Archive
For additional information relating to this article, please contact:
September 08, 2021CANADIAN COMMUNITY HEALTH SURVEY, 2020 Statistics Canada has released results from the 2020 Canadian Community Health Survey.
This survey is an annual population health survey that provides insight into life satisfaction, stress, perceived health, health conditions and behaviours of the Canadian population. Note: the CCHS was conducted neither in the Territories nor on reserves.
Life satisfaction, belonging to community and life stress
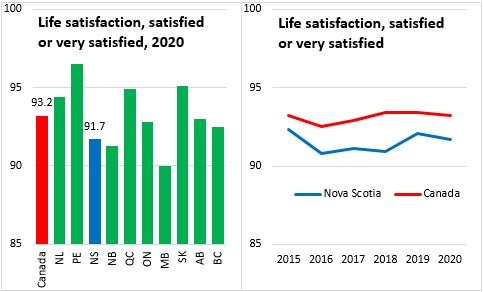
Over 90% of all Canadians (outside Territories and reserves) report being satisfied or very satisfied with their life at the moment, reporting a score of 6 or greater on a scale of 1 to 10. The highest percentage of the population reporting being satisfied or very satisfied was in Prince Edward Island while the lowest was in Manitoba. The share of Nova Scotia's population who were satisfied or very satisfied with their life at the moment was 91.7%, down from 92.1% in 2019.
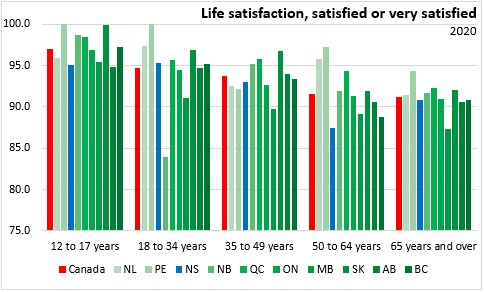
Life satisfaction by income group in Nova Scotia was lowest for those in the lowest quintiles of earnings. By education, those with a high school education (HS) or less (<HS) reported the lowest percentage who are satisfied or very satisfied with their life at the moment. Life satisfaction was higher for those in higher income quintiles and among those with post secondary education (PSE). By age and sex cohorts, younger adults in Nova Scotia (ages 18-34) reported the highest share who are satisfied or very satisfied: 95.3%. The share of youth aged 12-17 who are satisfied or very satisfied with their lives was 95.1% in 2020, down from 98.7% in 2019. Those aged 35-49, 50-64 and 65+ reported less satisfaction with their life. Females reported slightly lower life satisfaction than males in Nova Scotia.

Compared with age and sex cohorts across Canada, younger adults in Nova Scotia (ages 18-34) reported greater life satisfaction than the national average. Young Nova Scotians (12-17) as well as all cohorts over age 35 reported lower life satisfaction than the national average for these ages.
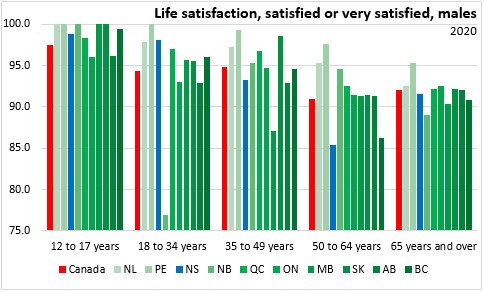
Among females, Nova Scotians' reported life satisfaction was lower than the national average for all age cohorts except those aged 35-49 (same as national average). Among males, youth (12-17) and young adults (18-34) in Nova Scotia reported higher life satisfaction than the national average. All older cohorts of males in Nova Scotia reported lower life satisfaction than the national averages for each male age cohort.

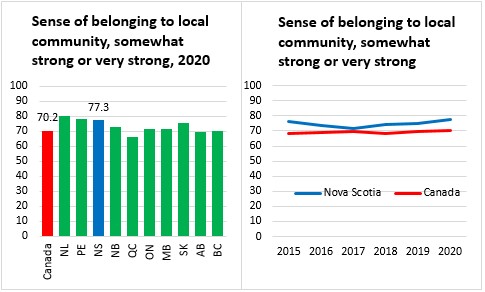
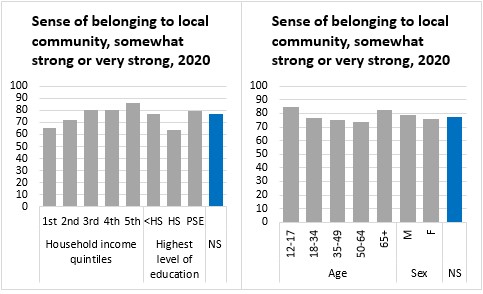
Over three quarters (77.3%) of Nova Scotians reported feeling a sense of belonging to their local community, which higher than the national average of 70.2%. The sense of belonging to community is strongest in Newfoundland and Labrador and lowest in Quebec. Nova Scotia's sense of belonging to community has been rising in each of the last three years.
Belonging to community rises with income, but not with education. There was a higher sense of belonging to community among younger Nova Scotians (12-17) and those over 65 years old.
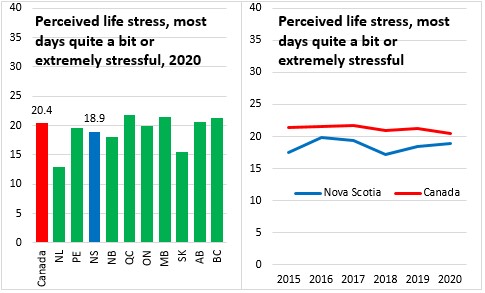
Nova Scotians (18.9%) generally reported lower levels of life stress than the national average (20.4%). Life stress was highest in Quebec and lowest in Newfoundland and Labrador.
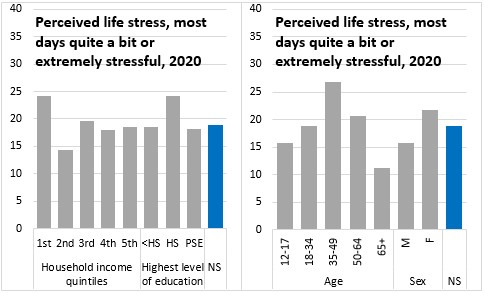
Life stress was notably higher among those in the lowest income quintile as well as among those whose highest level of education was high school. Life stress was lower for younger Nova Scotians (ages 12-17) and those over 65. Females reported higher life stress than males.
Perceptions of physical and mental health
The CCHS asks Canadians how they perceive their physical and mental health.
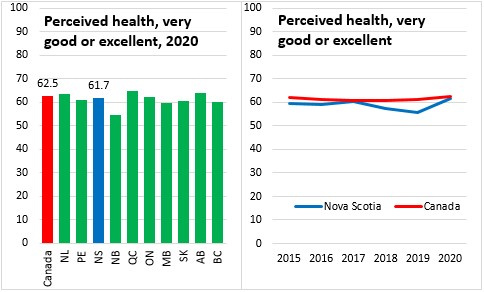
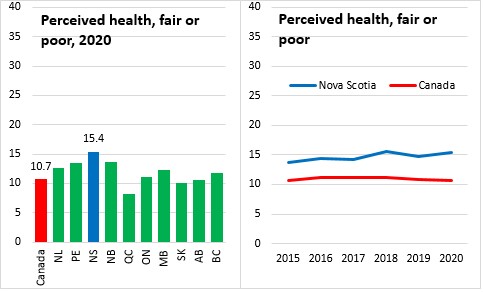
Among Nova Scotians aged 12 and up, 61.7% reported very good or excellent physical health, somewhat below the national average of 62.5%. New Brunswick had the lowest share reporting excellent or very good physical health while those in Quebec reported the highest share. Nova Scotia's share of very good or excellent health rebounded in the last year after two years of decline.
Nova Scotia had the highest share of the population (15.4%) that reported perceived physical health to be fair or poor. Perceived fair or poor physical health was higher across Atlantic Canada (where a higher share of the population is over 65), but lowest in Quebec.
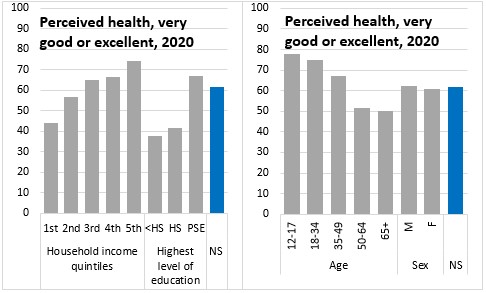
Perceptions of very good or excellent physical health rise with income and education levels. Perceived physical health declines with age. The relatively older populations in the Maritimes contribute to lower perceptions of physical health. Males had slightly stronger perceptions of their physical health than females.
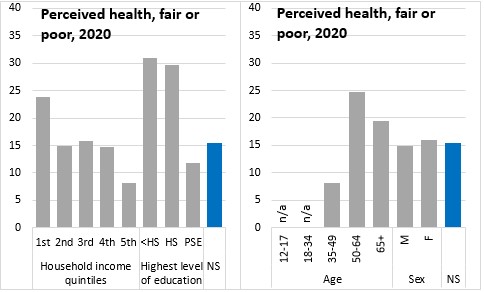
Perceived fair and poor physical health is notably higher among those in the first and second income quintiles as well as among those with less than a high school education. Note: data on perceived fair/poor health was suppressed for younger Nova Scotians (aged 12-17 and 18-34).
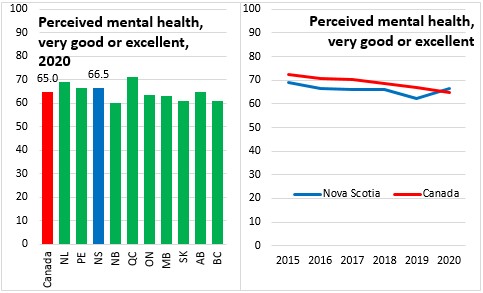
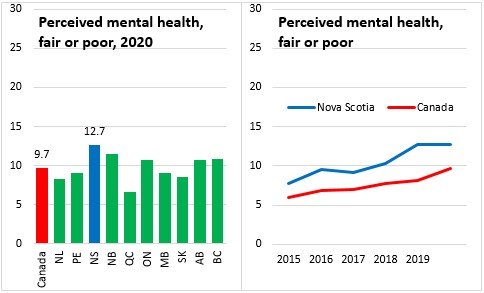
After a notable rebound in 2020, 66.5% of Nova Scotians reported very good or excellent mental health perceptions. Across Canada perceived mental health was highest in Quebec and lowest in New Brunswick.
Nova Scotia had the highest portion (12.7%) of the population that reported only fair or poor mental health. This portion has been rising in Nova Scotia and in Canada. Quebec has the smallest portion of the population that reports fair or poor mental health.
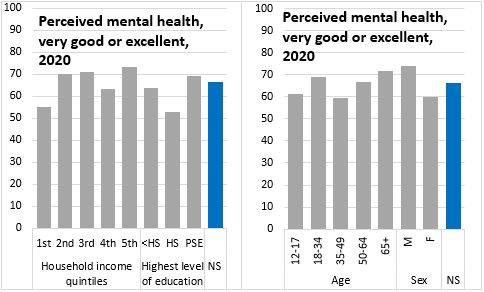
Perceptions of mental health were weaker for those in the lowest income quintile and for those with a high school education. Younger adults in Nova Scotia (aged 18-34) as well as seniors reported stronger perceived mental health while those aged 35-49 were less likely to report very good or excellent mental health. Males in Nova Scotia reported stronger perceptions of mental health than females in Nova Scotia.
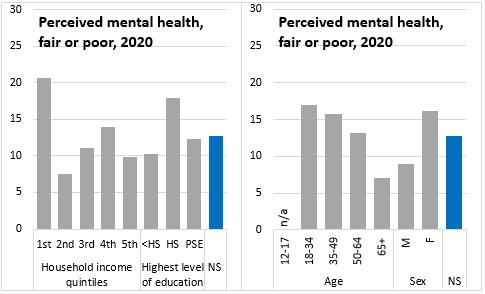
Fair or poor mental health was more commonly reported in the lowest income quintile, among those with a high school education and among those aged 18-34. Note: data for Nova Scotians aged 12-17 are suppressed.
Health conditions
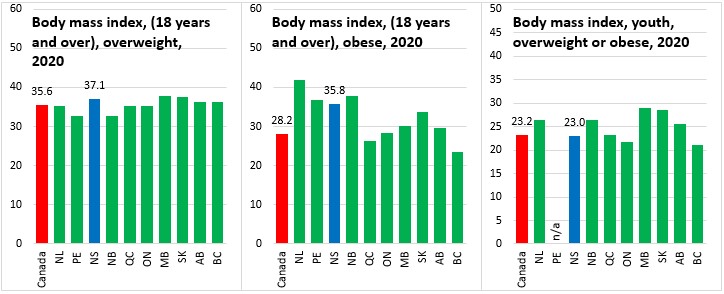
The portion of Nova Scotia's adult population that reports being overweight (37.1% using an adjusted self-assessment) is somewhat higher than the national average. However, the portion of Nova Scotian adults who report obesity (35.8%) is considerably higher than the national average. The share of Nova Scotia's youth (ages 12-17) who are overweight or obese (23.0%) was lower than the national average. Note: data for youth in Prince Edward Island are suppressed.
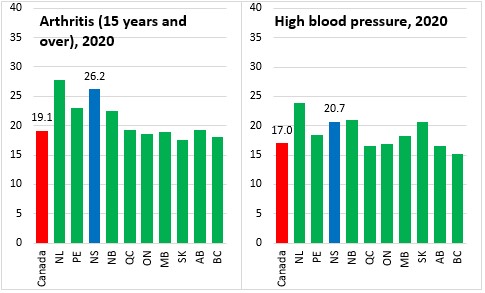
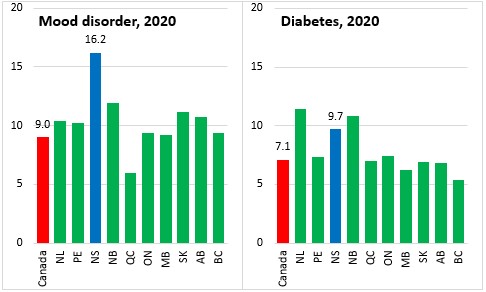
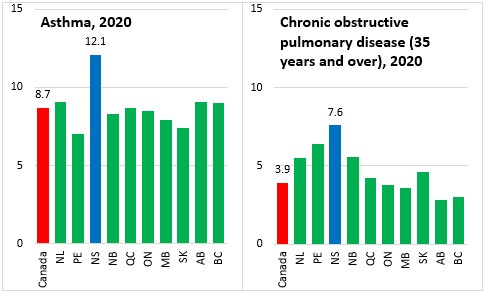
Among common chronic health conditions, Nova Scotia has higher than average prevalence of arthritis, high blood pressure, mood disorders (highest prevalence among provinces by a wide margin), diabetes, asthma (highest among provinces) and chronic obstructive pulmonary disease (highest among provinces). Note: mood disorders include depression, bipolar disorder, mania, dysthymia, phobia, obsessive-compulsive disorder and panic disorder.
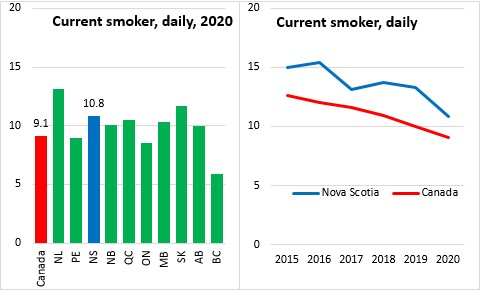
Nova Scotia reported the third highest portion of daily smokers among provinces, though this declined in the last year. The highest prevalence of daily smoking was in Newfoundland and Labrador and the lowest in British Columbia.
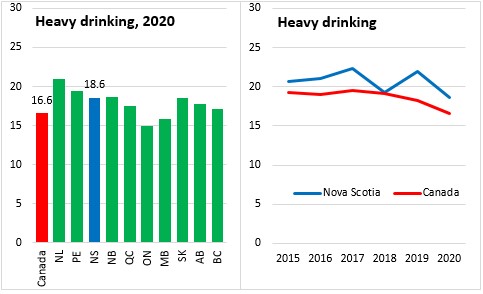
Nova Scotia also reported above average prevalence (18.6%) of heavy drinking (4-5 drinks on a least one occasion once a month in the last year). The prevalence of heavy drinking in Nova Scotia fell in 2020. The highest prevalence of heavy drinking was in Newfoundland and Labrador and the lowest in Ontario.
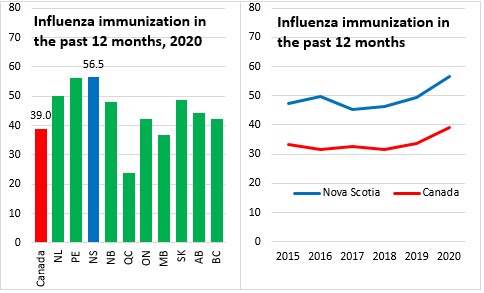
Nova Scotians consistently report the highest use of flu vaccines. The lowest use of flu vaccines was in Quebec. There was a notable rise in flu vaccination rates in 2020 compared with 2019.
Source: Statistics Canada. Table 13-10-0096-01 Health characteristics, annual estimates; Table 13-10-0097-01 Health characteristics, annual estimates, by household income quintile and highest level of education; Table 13-10-0098-01 Mental health characteristics and suicidal thoughts
<--- Return to Archive