The Economics and Statistics Division maintains archives of previous publications for accountability purposes, but makes no updates to keep these documents current with the latest data revisions from Statistics Canada. As a result, information in older documents may not be accurate. Please exercise caution when referring to older documents. For the latest information and historical data, please contact the individual listed to the right.
<--- Return to Archive
For additional information relating to this article, please contact:
November 05, 2021LABOUR MARKET TRENDS - OCTOBER 2021 Labour force survey results reflect the period from October 10 to 16. Compared with the September reference week, additional proof-of vaccination initiatives went into effect in various provinces and workplaces. British Columbia, Quebec and Ontario capacity limits were lifted in many sectors where proof of vaccination is now mandatory. Nova Scotia entered phase 5 reopening as of October 4.
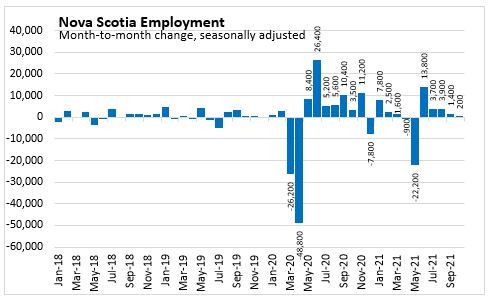
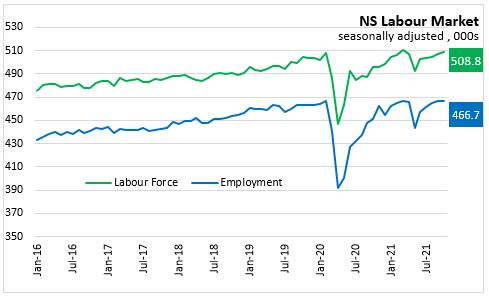
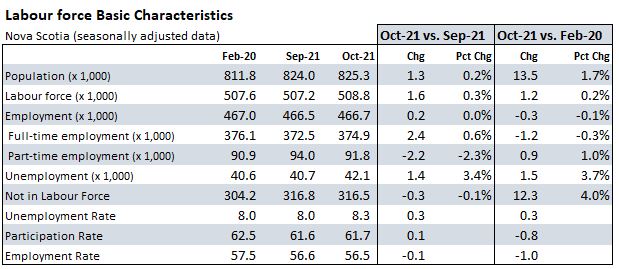
Nova Scotia’s seasonally adjusted employment level increased a statistically insignificant 200 (+0.0%) to 466,700 in October 2021 following on increases the previous four months as the economy reopened after the third-wave restrictions in spring 2021.
Nova Scotia’s employment was -0.1% (-300) below the pre-COVID employment level of February 2020.
Nova Scotia’s labour force increased 1,600 (+0.3%) to 508,800 in September. The labour force in October was higher by 1,200 (+0.2%) than the February 2020 level while the population grew by 13,500 (+1.7%) over the same period. The number of unemployed persons increased 1,400 compared to September 2021 and was 1,500 higher compared to February 2020.
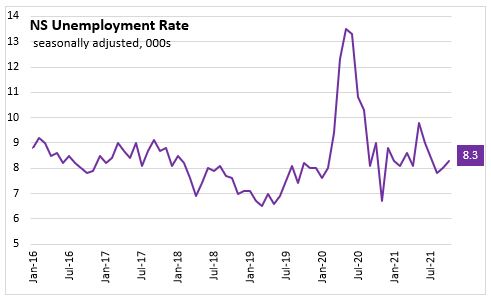
With a larger increase in labour force than employment, the unemployment rate increased 0.3 percentage points from last month to 8.3% in October 2021.
In October, full-time employment was up 2,400 (+0.6%) to 374,900 position and part-time employment decreased 2,200 (-2.3%) to 91,800. Compared to February 2020, full-time employment was lower by 1,200 (-0.3%) while part time employment was higher by 900 (+1.0%). (Note that this can include changes of hours within the same job.)
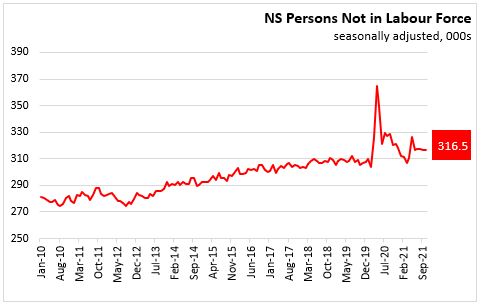
Nova Scotia’s participation rate was up 0.1 percentage points to 61.7% in October 2021. This was 0.8 percentage points below the February 2020 level. The number of persons not in the labour force decreased 300 (-0.1%) to 316,500 in October 2021, still elevated from levels seen prior to third-wave (March 2021) and pre-pandemic (February 2020).
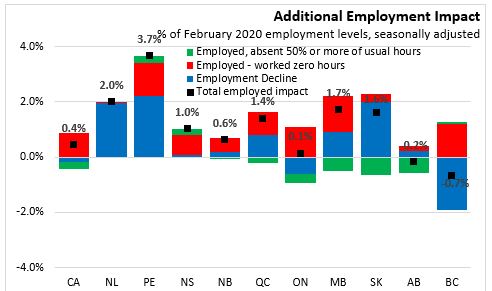
In addition to the employment decline from February 2020, there were elevated numbers of persons who are counted as employed, but had zero hours (for non-routine reasons like vacation, maternity/parental leave, labour dispute) or had their hours cut by 50% or more.
In October 2021 in Nova Scotia there were 24,300 persons employed but at less than 50% of their usual hours (including zero hours), up from 23,800 in September but lower than 45,900 in May 2021. Just before the third-wave lockdown (March 2021), there were an elevated number of people employed at fewer than usual hours at 27,700 persons. Pre-pandemic in February 2020 there were an estimated 19,800 persons with reduced hours.
Employment losses and substantially reduced hours combine to account for 1.0% of Nova Scotia’s February 2020 employment level. This is the lowest rate, same as September 2021, for Nova Scotia since the start of the pandemic. The rate was 10.6% in May 2021 and 4.6% in June 2021 after peaking at 28.1% in April 2020. The largest total employment/hour impacts in October 2021 was in Prince Edward Island (3.7%). British Columbia’s rate is -0.7% with employment growth since February 2020 offsetting the additional employed people with reduced hours in the province.
Statistics Canada reported in supplemental information that from September to October 2021 Nova Scotia had an increase of 2,800 in the number of people who were not in the labour force but wanted to work, currently at 17,100 people. The number of people not in labour force and wanting work is 3,800 more than February 2020.
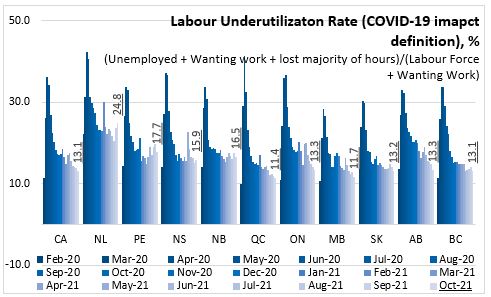
The labour underutilization rate (COVID-19 impact definition) is the proportion of the potential labour force (labour force + those wanting work) that is either unemployed, not in labour force but wanted work or employed but have lost the majority of their usual hours.
In February 2020, Nova Scotia's labour underutilization rate was 14.1%. This underutilization increased to 37.1% in April 2020 and subsequently fell to 15.5% in April 2021, before rising to 22.8% in May 2021 and declining to 16.2% in August 2021. The labour underutilization rate of 15.1% in September 2021 was the lowest since start of the pandemic; in October 2021 the rate rose to 15.9%
Newfoundland and Labrador reported the highest labour underutilization in October 2021 at 24.8% and Quebec (11.4%) reported the lowest.
Age Cohorts
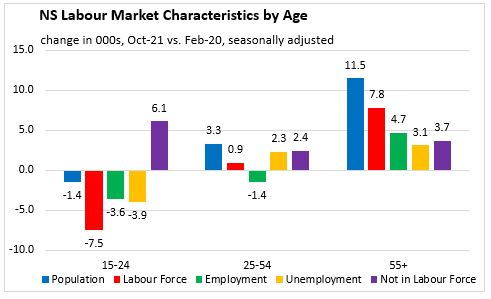
When compared to February 2020, youth (aged 15-24) and core aged workers (aged 25-54) saw lower employment levels in October 2021. In the youth cohort, employment was down 3,600 while the labour force was down 7,500. Employment among core-aged workers was down 1,400 while the labour force increased 900. For older workers (aged 55+), employment was up 4,700 while labour force was up 7,800; the population aged 55+ increased by 11,500 from February 2020 to October 2021.
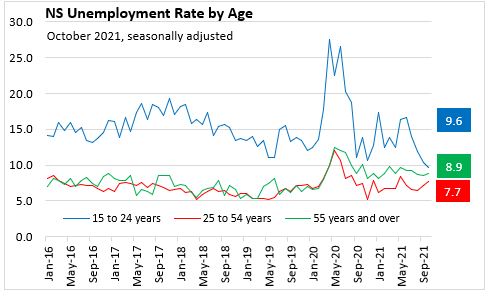
Compared to September 2021, October unemployment rates decreased for youth while rising for older and core-aged workers. The youth unemployment rate declined 0.7 percentage points to 9.6%. The unemployment rate for older workers was up 0.3 percentage points to 8.9% and was up 0.5 percentage points to 7.7% for core-aged workers.
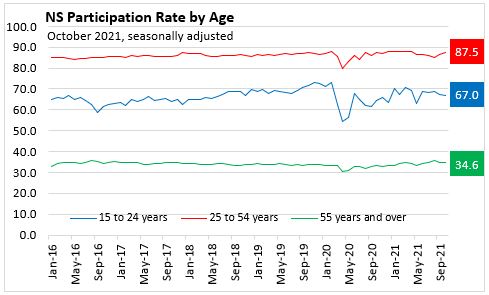
The participation rate for core-aged Nova Scotians rose by 0.9 percentage points to 87.5% in October. For younger workers, the participation rate declined by 0.6 percentage point to 67.0% and for older workers, the participation rate declined by 0.4 percentage points to 34.6%.
Compared to February 2020, the October participation rate was down 6.0 percentage points for youth and 0.5 percentage points fore core-aged workers while it rose 1.1 percentage points for older workers.
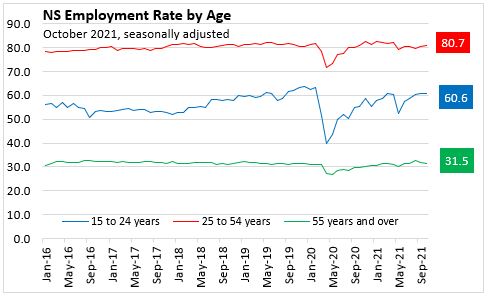
The employment rate was down for youth (-0.1 percentage points) and older workers (-0.5 percentage points) in October 2021 compared to September 2021. The employment rate for core-aged workers rose compared to the previous month (+0.4 percentage points).
Compared with February 2020, employment rates were down for youth (-2.5 percentage points), core-aged workers (-1.2 percentage points) while the employment rate was up for older workers (+0.3 percentage points).
Males and Females
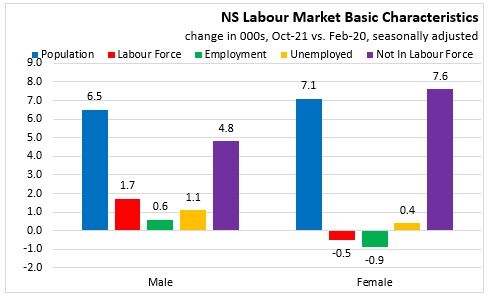
Compared to pre-pandemic levels seen in February 2020, female employment was lower by 100 and male employment was up 900 in October 2021. Over the same period, the female labour force declined 500 while male labour force increased 1,700. The number of unemployed females increased 400 while the number of males was up 1,100. The number of females not in the labour force was up 7,600 from February 2020 while the male population not in the labour force was up 4,800.
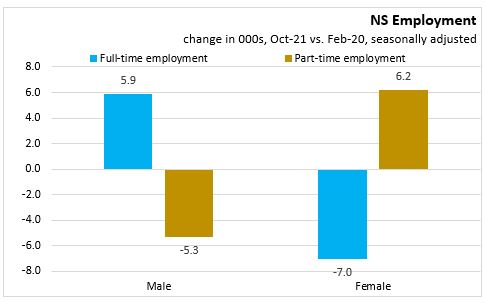
Female full-time employment was down 7,000 compared to February 2020 while rising by 6,200 in part-time employment. Male full-time employment was up 5,900 from pre-pandemic levels while males with part-time employment was down 5,300.
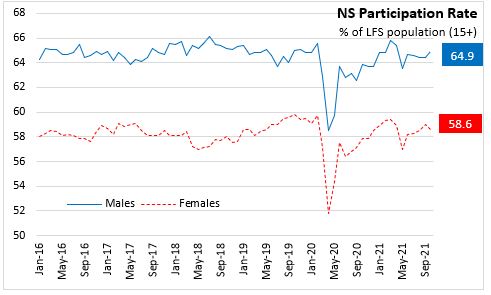
Compared with September 2021, the October 2021 the participation rate rose 0.5 percentage points for male workers to 64.9% while it declined 0.4 percentage points for female workers at 58.6%.
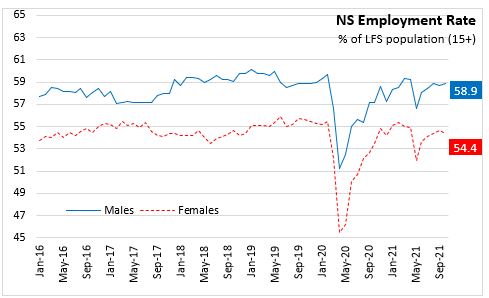
The monthly employment rate was up 0.2 percentage points to 58.9% for males and was down 0.3 percentage points to 54.4% for females.
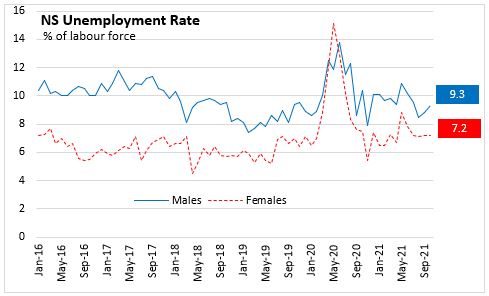
In October 2021, the monthly unemployment rate was up 0.5 percentage points to 9.3% for male workers and was unchanged at 7.2% for female workers.
Sectors and Industries
October employment reported small declines among public sector employees (-100) and private sector employees (-700), while self-employment rose 1,100 compared to September 2021.
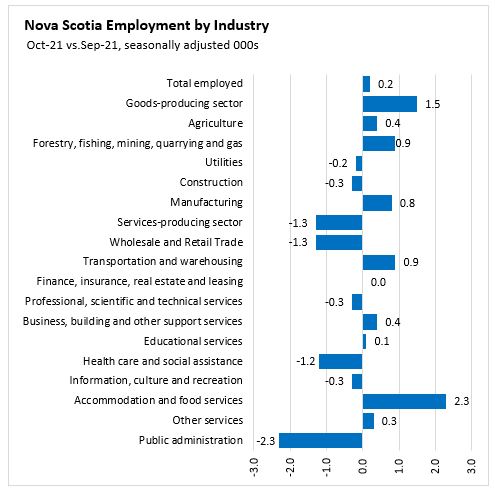
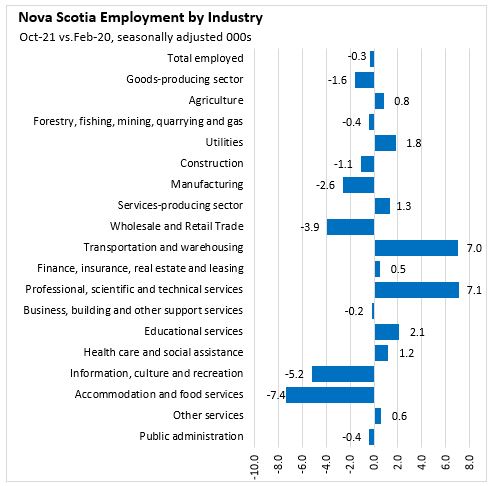
Following 2 months of decline, employment in goods-producing industries increased by 1,500 in October 2021. Increases in agriculture (+400), resource sectors (+900), and manufacturing (+800) were offset with declines in Construction (-300) and utilities (-200).
Service-producing industries’ employment decreased 1,300 in October, following four months of increases. The largest employment declines for October occurred public administration (-2,300), wholesale/retail trade (-1,300) and health care and social assistance (-1,200). Employment rose in accommodation and food services (+2,300) and transportation and warehousing (+900).
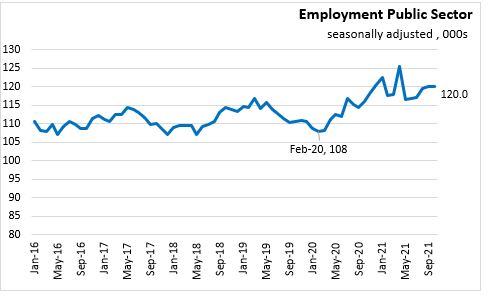
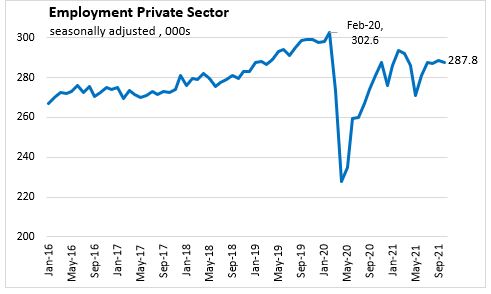
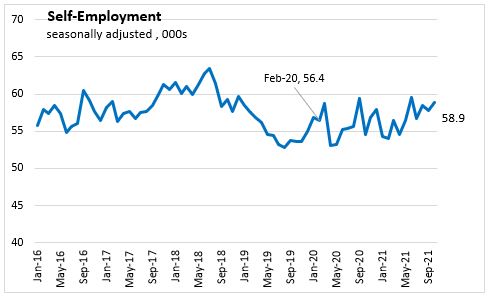
Comparing October 2021 with February 2020, employment was lower in the private sector (-14,800) while self-employment (+2,500) and public sector employment (+12,000) have increased.
Employment since February 2020 has declined 1,600 in goods-production industries with lower employment in manufacturing (-2,600), construction (-1,100) and forestry, fishing, and mining (-400). Utilities employment was 1,800 higher in October 2021.
Nova Scotia’s service-producing employment was higher by 1,300 than the pre-pandemic threshold with significant changes in subsectors. Employment gains from February 2020 through October 2021 have occurred professional, scientific and technical services (+7,100), transportation/warehousing (+7,000), educational services (+2,100). Employment levels remains significantly lower in some sectors: accommodation and food services (-7,400), information, culture and recreation (-5,200), and wholesale/retail (-3,900). Other sectors were little changed.
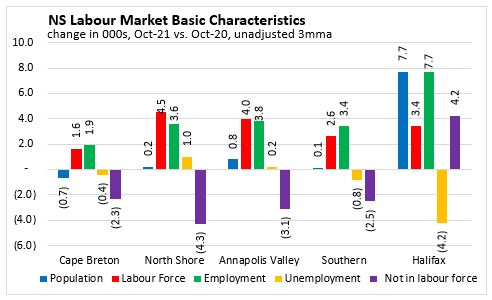
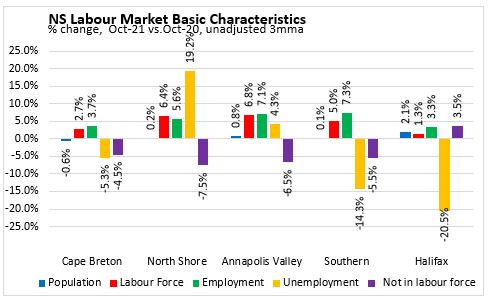
Regions – October 2021 vs October 2020 (unadjusted 3 month moving average)
Regional results for October are three month moving averages from the period August-October. Changes do not reflect the full extent of employment volatility observed in monthly results for the province as a whole.
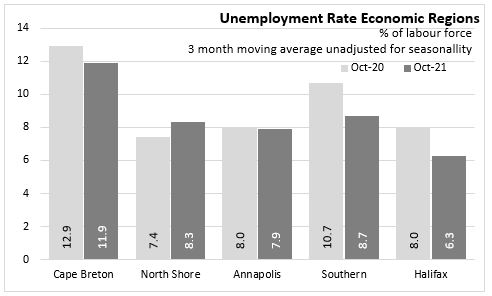
Compared with October 2020, Cape Breton employment increased by 1,900 while labour force was up by 1,600. The number of unemployed people decreased by 400 and the unemployment rate decreased by 1.0 percentage points to 11.9% in October 2021. The number of persons not in the labour force was down 2,300 compared to the same period one year ago.
For the North Shore region, the labour force increased 4,500 and employment was up 3,600. The number of unemployed people was up by 1,000 which resulted in a 0.9 percentage point increase in the unemployment rate to 8.3%. The number of persons not in the labour force declined by 4,300 compared to October 2020.
The Annapolis Valley reported an increase both in labour force (+4,000) and employment (+3,800) when compared to October 2020. The unemployment rate declined 0.8 percentage points to 8.5%. The number of persons not in the labour force declined 3,100 from a year earlier.
In the Southern region, labour force increased 2,600 while employment grew by 3,400 people when compared to October 2020. The number of unemployed was down 800 and the unemployment rate was down 2.0 percentage points to 8.7% in October 2021. The number of persons not in the labour force declined 2,500 from a year earlier.
In the Halifax region, the labour force posted an increase of 3,400 while employment has increased 7,700 compared to October 2020. The number of unemployed was down 4,200 and the unemployment rate fell 1.7 percentage points to 6.3%. The number of persons not in the labour force increased by 4,200 in Halifax from a year ago.
Provincial Comparisons
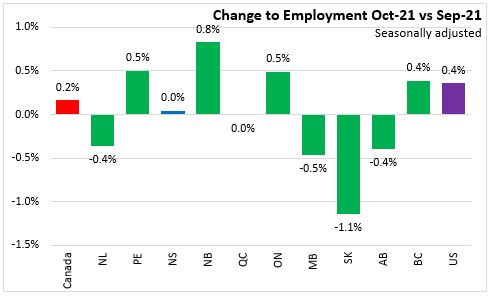
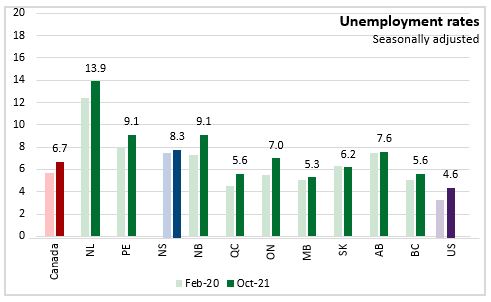
Employment increased month-over-month in four provinces in October with largest gains in New Brunswick (+0.8%) and Prince Edward Island and Ontario (both +0.5%). Western Canada and Newfoundland and Labrador reported declines.
Nationally, employment was up 0.2% from last month in October 2021.
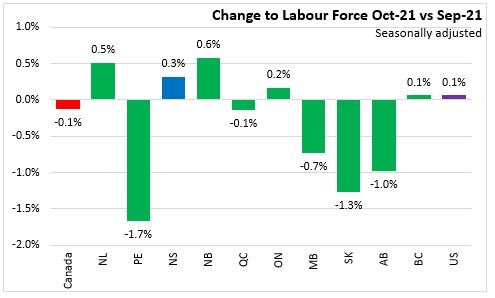
Canada's labour force declined 0.1% in October with declines in five provinces, led by Prince Edward Island (-1.7%) and in the Western provinces. New Brunswick reported largest increase with a 0.6% increase.
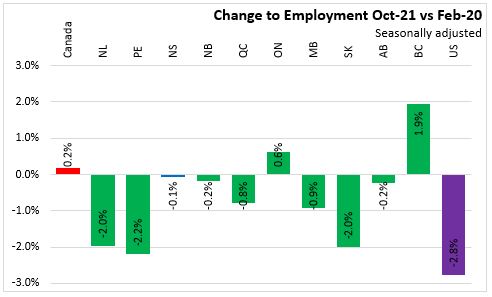
Employment was higher in British Columbia (+1.9%) and Ontario (+0.6%) compared to pre-pandemic levels. Canada employment level has risen (+0.2%) compared to February 2020. The largest employment declines since February 2020 were in Prince Edward Island (-2.2%) and Newfoundland and Labrador and Saskatchewan (both -2.0%).
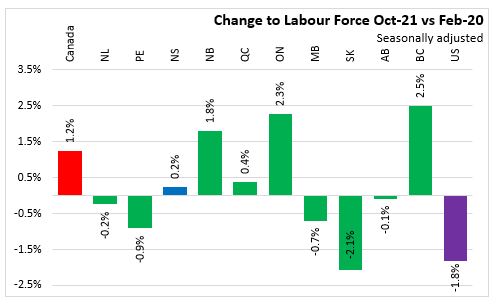
Compared to February 2020, the labour force has increased in five provinces including Nova Scotia. British Columbia (+2.5%) and Ontario (+2.3%) have seen the largest growth in labour force from pre-pandemic levels. The largest decline in the labour force since February 2020 to October 2021 was in Saskatchewan (-2.1%).
The highest unemployment rate for October 2021 was in Newfoundland and Labrador at 13.9% and the lowest rate was 5.3% in Manitoba. Canada’s unemployment rate was 6.7% in October 2021.
National Comparisons: Cities (Monthly, 3 month moving average)
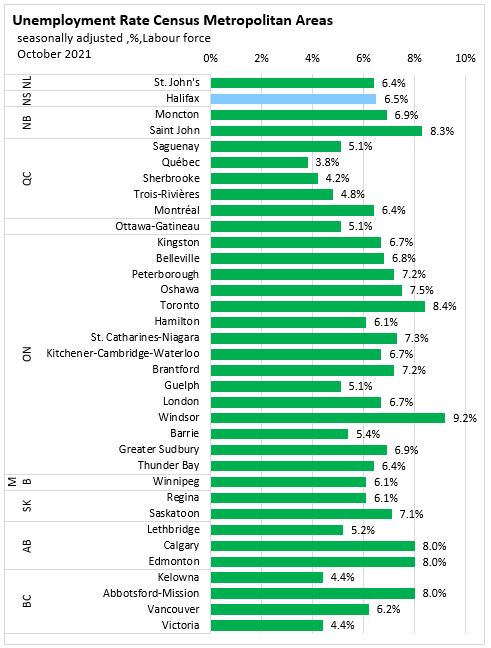
The unemployment rate for Halifax Census Metropolitan Area (CMA) in October 2021 was 6.5% (seasonally adjusted 3 month moving average). Quebec City at 3.8% had the lowest unemployment rate among CMAs while the highest was in Windsor (9.2%).
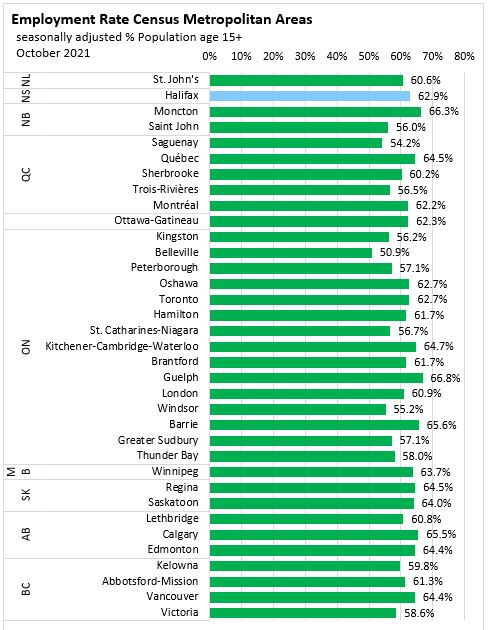
The seasonally adjusted employment rate for Halifax was 62.9%, up 0.3 percentage points compared to last month. Guelph (66.8%) had the highest employment rate while Belleville (50.9%) had the lowest among CMAs.
Halifax’s employment (3 month moving average) for October 2021 was up 0.8% compared to the September 2021 result. The employment level (Aug-Oct) average compared to previous average (Jul-Sep) was up by the largest amount in Oshawa (+2.6%) and decreased the most in Belleville (-5.0%).
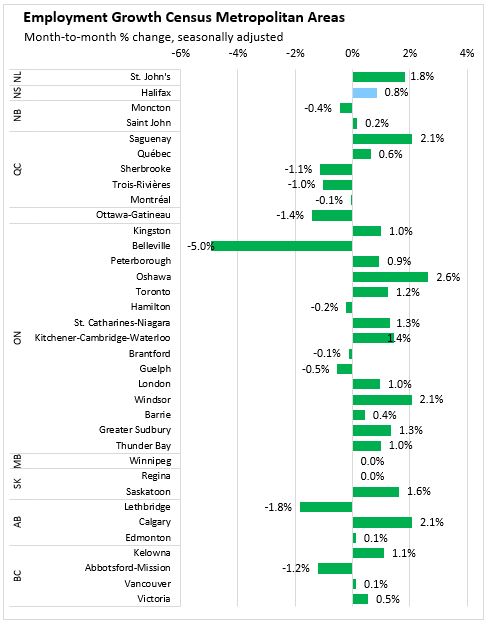

Note: Seasonally adjusted, 3 month average.
Sources:
Statistics Canada. Table 14-10-0287-01 Labour force characteristics, monthly, seasonally adjusted and trend-cycle, last 5 months
Statistics Canada. Table 14-10-0294-01 Labour force characteristics by census metropolitan area, three-month moving average, seasonally adjusted and unadjusted, last 5 months
Statistics Canada. Table 14-10-0293-01 Labour force characteristics by economic region, three-month moving average, unadjusted for seasonality, last 5 months
Statistics Canada. Table 14-10-0355-01 Employment by industry, monthly, seasonally adjusted and unadjusted, and trend-cycle, last 5 months (x 1,000)
Statistics Canada. Table 14-10-0288-01 Employment by class of worker, monthly, seasonally adjusted and unadjusted, last 5 months (x 1,000)
Statistics Canada. Table: 14-10-0380-02 Labour force characteristics, three month moving average, seasonally adjusted (x 1,000)
<--- Return to Archive