The Economics and Statistics Division maintains archives of previous publications for accountability purposes, but makes no updates to keep these documents current with the latest data revisions from Statistics Canada. As a result, information in older documents may not be accurate. Please exercise caution when referring to older documents. For the latest information and historical data, please contact the individual listed to the right.
<--- Return to Archive
For additional information relating to this article, please contact:
December 10, 2021CANADA NATIONAL BALANCE SHEET ACCOUNTS, Q3 2021 
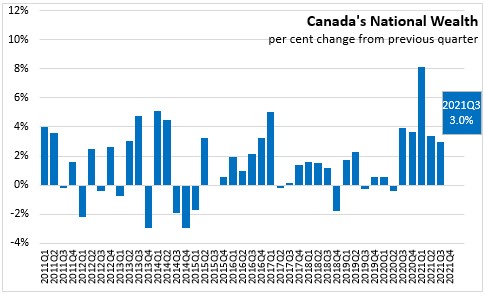
In the third quarter of 2021, Canadian national wealth increased 3.0% (or +$420.3 billion) to $14,575.0 billion. This follows a revised increase of 3.4% in the second quarter of 2021. As with the previous quarter, the growth was largely attributable to an increase in the value of residential real estate by $238.4 billion. Natural resource asset values remained stable compared with second quarter on the higher values of subsoil assets offset by a decline in the value of timber. Net foreign assets increased for the sixth consecutive quarter on exchange rates fluctuations in Q3 2021.
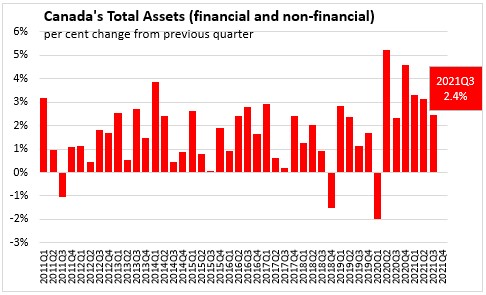
Total assets, including financial and non-financial assets increased by 2.4% to $56,409 billion at the end of Q3 2021, following a 3.1% increase in Q2 2021.
Household sector
In Q3 2021, Canada’s household sector net worth increased $292.2 billion to $15,117.3 billion on the continued appreciation of housing. Financial assets increased 1.1%, with its main contributors were listed and mutual fund shares. The Toronto Stock Exchange Composite Index edged down and the Standard and Poor’s 500 also remained flat. Financial liabilities increased $58.3 billion.
The value of residential real estate grew 3.0% in Q3 2021, largely attributable to higher value of residential land and structures. The national average selling price of a home edged down in summer and increased at the end of the third quarter as average selling price of a home increased 3.6% in September compared with July and August 2021.
Real estate as a percentage of disposable income increased to 528.2% in Q3 2021 from 463.9% in Q3 2020.
Household borrowing increased to $51.6 billion in Q3 2021, on higher mortgages. Mortgage lending increased to $45.9 billion. Non-mortgage lending increased to $5.7 billion.
Household saving rate was 11.0% in Q3 2021, down from 14.0% in Q2 2021. It has remained at double digit levels since Q2 2020.
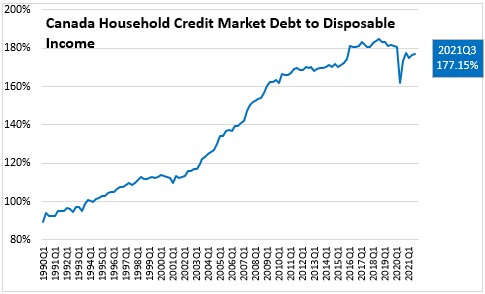
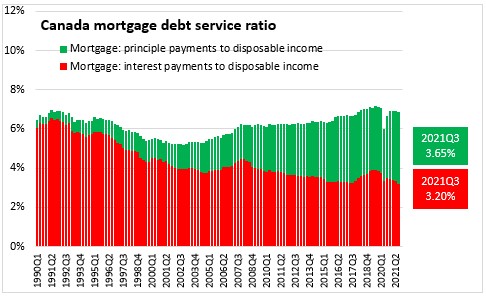
Household credit market debt as a proportion of household disposable income increased to 177.15% in Q3 2021.
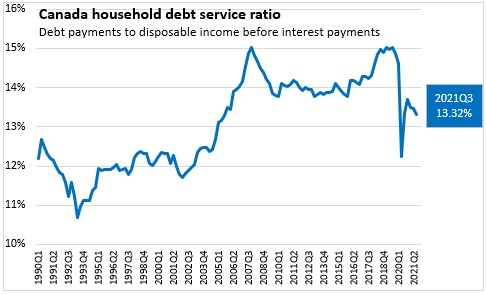
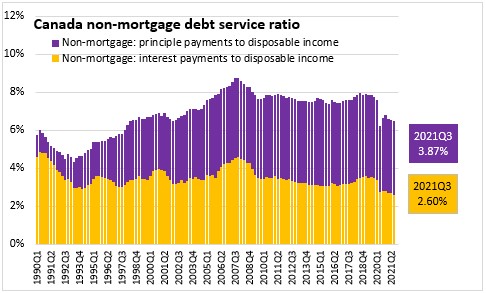
In Q3 2021, household debt payments decreased from 13.47% to 13.32% of disposable income. Even with the growth in borrowing for mortgages, interest payments declined while principal payments grew in the quarter.
Government sector
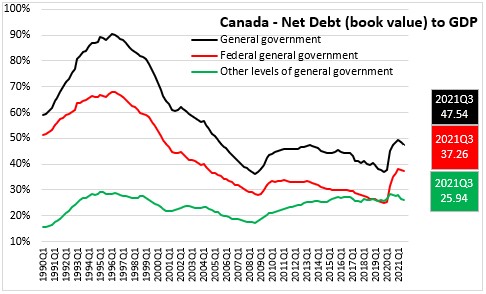
At the end of Q3 2021, general government net debt (book value) decreased to 47.54% of GDP. The federal government's net debt to GDP ratio decreased to 37.26%, as federal government net debt increase was impacted by COVID-19. Net debt of other levels of government decreased to 25.94% of GDP.
Corporate sector
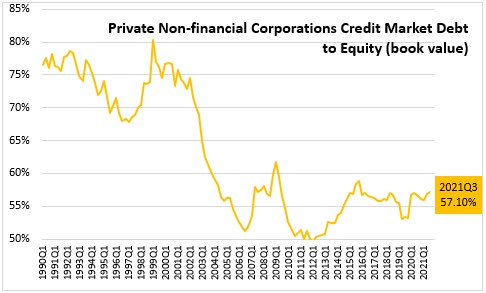
The credit market debt to equity ratio of non-financial private corporations increased to 57.10 cents of credit market debt for every dollar of equity in Q3 2021, up from 56.85 cents (revised) in Q2 2021.
Statistics Canada: Daily
Table 11-10-0065-01 Debt service indicators of households, national balance sheet accounts
Table 36-10-0580-01 National Balance Sheet Accounts (x 1,000,000)
Table 38-10-0235-01 Financial indicators of households and non-profit institutions serving households, national balance sheet accounts
Table 38-10-0236-01 Financial indicators of corporate sector, national balance sheet accounts
Table 38-10-0237-01 Financial indicators of general government sector, national balance sheet accounts
Table 38-10-0238-01 Household sector credit market summary table, seasonally adjusted estimates
<--- Return to Archive