The Economics and Statistics Division maintains archives of previous publications for accountability purposes, but makes no updates to keep these documents current with the latest data revisions from Statistics Canada. As a result, information in older documents may not be accurate. Please exercise caution when referring to older documents. For the latest information and historical data, please contact the individual listed to the right.
<--- Return to Archive
For additional information relating to this article, please contact:
January 06, 2022BUSINESS AND EMPLOYMENT DYNAMICS, NOVA SCOTIA 2019 Statistics Canada has released the 2019 results for provincial and territorial business and employment dynamics. This covers incorporated and unincorporated businesses in the private sector that issue at least one T4 slip in any given calendar year, but excludes self-employed individuals or partnerships where the participants do not draw salaries.
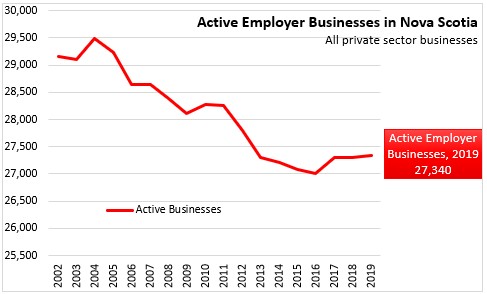
In 2019, there were a total of 27,340 active businesses in Nova Scotia's private sector, up 40 from the previous year.
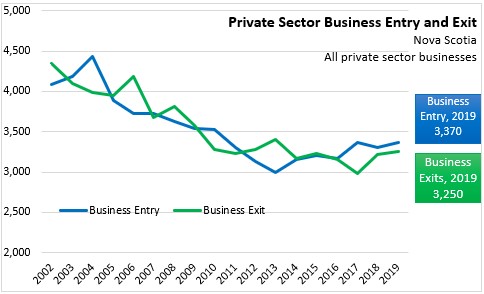
The 27,340 including 23,970 incumbents (continuing operations from previous years) as well as 3,370 new entrants. This was offset by exit of 3,250 firms from the numbers of previous incumbents. Entrants in any given year are enterprises that have current payroll data, but that did not have payroll data in the previous year. Similarly, exits in any given year are identified by the absence of current payroll data, where such data had existed in the previous year.
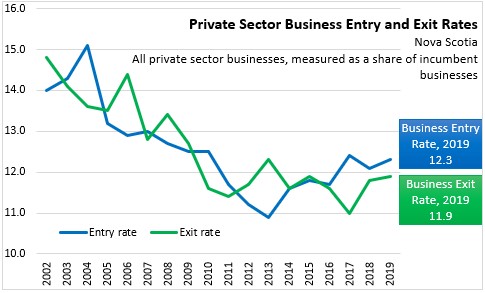
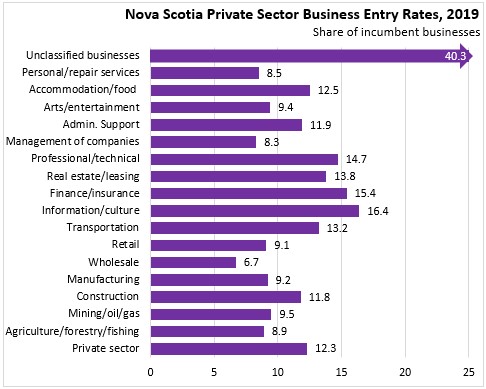
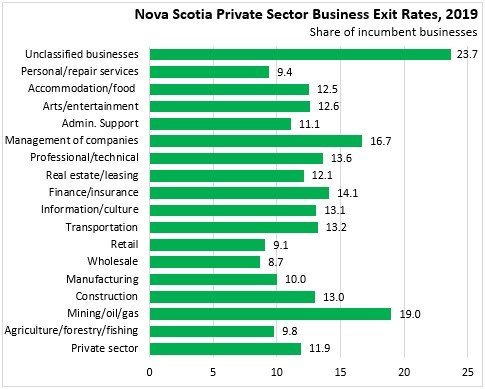
Measured in percentage terms (relative to an average of prior and current year totals), the entry rate for new firms was 12.3% in 2019, up from 12.1% in 2018. The exit rate for firms increased to 11.9% in 2019, up from 11.8% in 2018. Over time, the pace of business entry and exit has slowed in Nova Scotia, but these rates have stabilized in the last ten years.
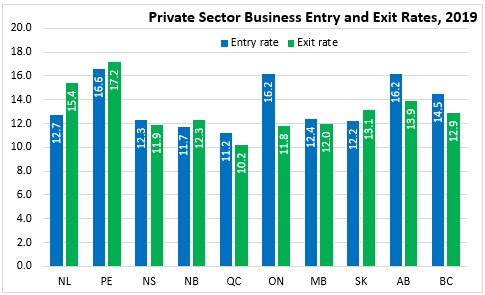
Compared to other provinces in 2019, Nova Scotia's Business Entry rate was lower than all provinces except New Brunswick, Quebec and Saskatchewan. Nova Scotia's exit rate was lower than all provinces except Quebec and Ontario. The highest entry and exit rates were in Prince Edward Island while the lowest business entry and exit rates were in Quebec.
By sector, unclassified businesses accounded for a notably faster entry rate. Among classified sectors, the fastest entry rates were reported in information/culture, finance/insurance and professional/technical services. Entry rates were slower for wholesale trade as well as for company management.
The fastest exit rates were also reported among unclassified businesses. Within those businesses classified to a sector, the fastest exit rates were reported in mining/oil/gas and management of companies, though these industries have very few firms. Among industries with larger numbers of firms, there were higher exit rates for finance/insurance, professional/technical services, transportation and construction. The slowest exit rates were observed in wholesale and retail trade.
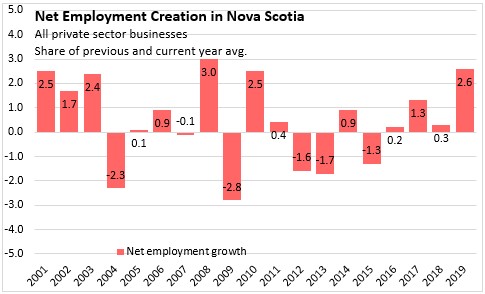
Statistics Canada's business employment dynamics data also examines employment changes in the private sector. In 2019, there was net private sector employment creation of 2.6% in Nova Scotia, up from 0.3% in 2018.
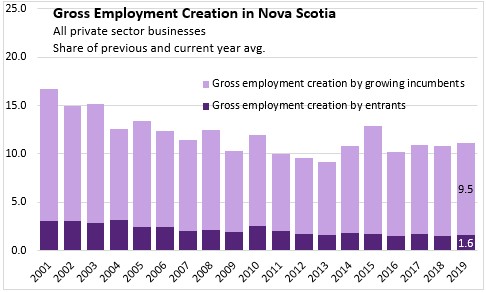
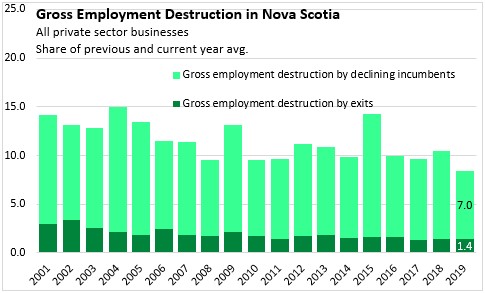
Net employment growth is broken down into four subcomponents of gross employment creation and destruction: employment creation by entrants (1.6%), employment creation by growing incumbents (9.5%), employment destruction by exits (1.4%), and employment destruction by declining incumbents (7.0%).
In all years since 2000, most net private sector employment change is explained by employment creation or destruction by incumbents rather than by new entrants or exiting firms. Employment turnover has been lower and more stable in recent years than it was prior to 2008.
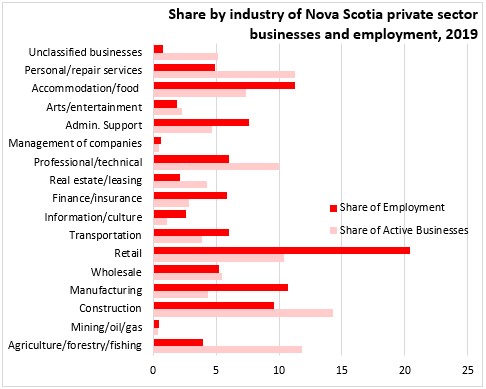
The contribution that each industry makes to overall employment dynamics depends on its share of overall employment and its gross employment creation or destruction. Industries such as manufacturing, retail, wholesale, finance/insurance, administrative and support services, information and culture, and accommodation/food account for a larger share of total employment than their share of active businesses (indicating a larger number of employees per business). Agriculture/forestry/fishing, construction, personal/repair services and professional/technical services are examples of industries with a greater share of active businseses than their share of employment (fewer employees per business).
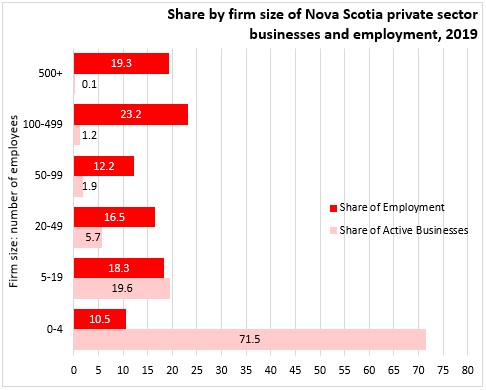
The share of businesses by firm size (as measured by number of employees) is highest for those firms employing fewer than 5 people. However, these small firms account for 10.5% of private sector employment. In contrast, firms with over 500 employees make up just 0.1% of all firms in Nova Scotia, but employ 19.3% of private sector employees.
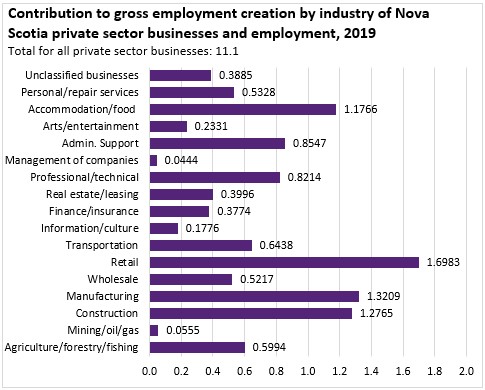
The largest contributions to gross employment creation in 2019 came from retail, construction, manufacturing and accommodation/food businesses.
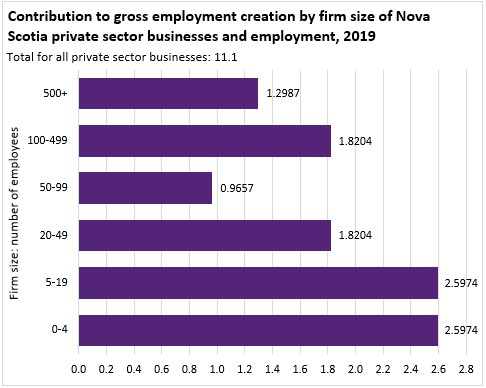
Gross employment creation had stronger contribution from firms with fewer than 20 employees as well as those from 20-49 employees and those from 100-499 employees. Contributions to employment creation from the largest firms as well as those with 50-99 employees was smaller.
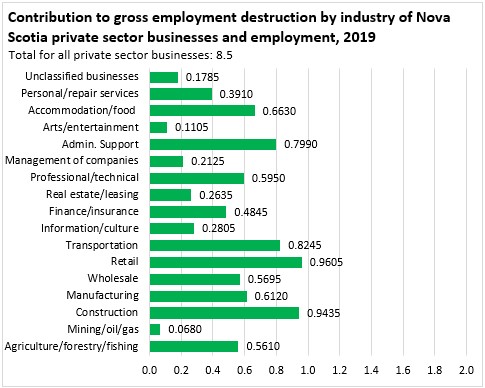
The largest contributions to gross employment destruction in 2019 were reported among construction, retail and transportation.
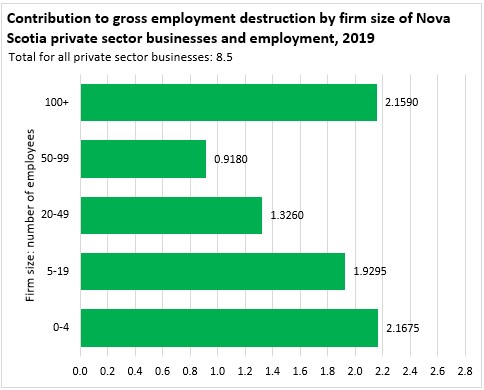
As with gross employment creation, there were higher contributions to employment destruction by firms with more than 100 employees (2019 results do not split businesses with 100-499 and 500+ employees). Firms with fewer than 5 employees contributed most to employment destruction in 2019.
Source: Statistics Canada. Table 33-10-0087-01 Business Dynamics measures, by industry, per province or territory; Table 33-10-0088-01 Business Dynamics measures, by firm size, per province or territory; Table 33-10-0090-01 Business Sector employment flow rates by firm size, provinces and the territories; Table 33-10-0089-01 Business Sector employment flow rates, by industry, provinces and the territories; Table 33-10-0091-01 Contribution to private sector employment, gross employment creation and destruction, by Industry, per province or territory; Table 33-10-0093-01 Contribution to private sector employment, gross employment creation and destruction by firm size, provinces and the territories
<--- Return to Archive