The Economics and Statistics Division maintains archives of previous publications for accountability purposes, but makes no updates to keep these documents current with the latest data revisions from Statistics Canada. As a result, information in older documents may not be accurate. Please exercise caution when referring to older documents. For the latest information and historical data, please contact the individual listed to the right.
<--- Return to Archive
For additional information relating to this article, please contact:
February 07, 2022EDUCATIONAL PROFILE OF LESBIAN, GAY AND BISEXUAL CANADIANS, 2015 - 2018 Statistics Canada recently published a new study that examines the educational participation and level of education of lesbian, gay, and bisexual (LGB) people in Canada using data from the Canadian Community Health Survey (2015 to 2018). This study is part of a series on LGB people in Canada that “Family and household characteristics of lesbian, gay and bisexual people in Canada” and a data table on socioeconomic characteristics. Future articles in this series will explore labour market outcomes and earnings related to educational attainment.
This article provides a statistical profile of the educational participation and attainment of the LGB population in Canada, compared with the heterosexual population.
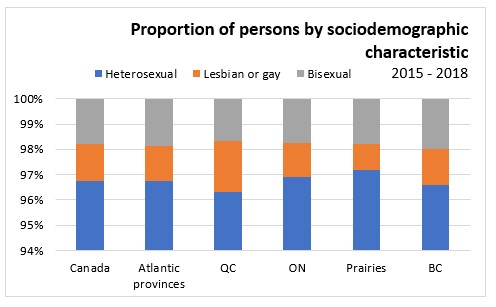
An estimated 900,000 LGB people aged 15 years and older were living in Canada between 2015 and 2018 which accounted for 3.3% of Canada’s total population. This percentage was significantly higher among younger people, with 6.4% of youth aged 15 to 24 indicating they were LGB compared to 3.0% among adults aged 25 to 64.
LGB youth were more likely to be women than men. Among youth aged 15 to 24, 8.5% of young women identified as LGB compared to 4.4% of men.
In Atlantic Canada, LGB population was estimated at 60,200 between 2015 and 2018, accounting for 3.3% of the region’s population. Over the same period, the largest share of Canada’s LGB population lived in Ontario.

An estimated 215,300 LGB people aged 15 and over attended school at all levels of study between 2015 to 2018. Across all age groups of students, a larger share of the LGB student population was bisexual than gay or lesbian.
The school attendance rate was similar between the LGB and heterosexual populations aged 18 to 29. Among the LGB population, men and women had similar school attendance rates. However, a larger share of heterosexual women (39.0%) attended school compared to that of men (33.5%) aged 18 to 29.
The number of youth not in employment, education or training (NEET) is one of the indicators for Sustainable Development Goal 8, pertaining to decent work and economic growth. According to CCHS data from 2015 to 2018, 10.8% of youth aged 18 to 29 were identified as NEET, across all sexual orientation groups. A larger share of youth that identify as bisexual (14.7%) were considered NEET, which is a statistically significant difference from the proportion that were NEET among heterosexual (9.9%) and gay and lesbian youth (5.3%).
77.4% of the gay and lesbian population aged 25 to 64 held a postsecondary qualification compared to 72% of the heterosexual population and 68.1% of bisexual population.
41.2% of the gay and lesbian population had a bachelor’s degree or higher while 34.2% of bisexual population and 32.6% of heterosexual population had the same qualification. Gay men were more likely to hold a bachelor’s degree or higher (43.2%) than heterosexual men (30.3%), bisexual women (33.5%) and heterosexual women (34.9%).
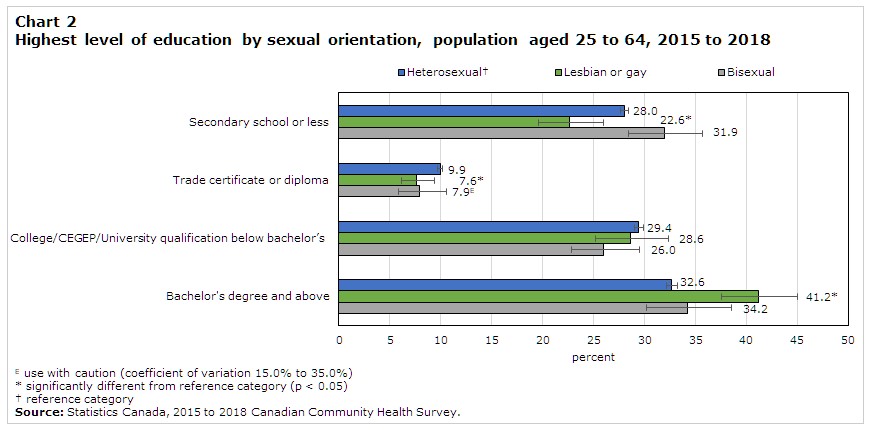
Between 2015 and 2018, 13.7% of heterosexual men aged 25 to 64 had a trade qualification as their highest level of education. This compared to 7.5% of gay men, 6.2% of heterosexual women, 7.7% of gay or lesbian women, and 6.0% bisexual women. Although bisexual men were more likely than heterosexual women to hold a trade qualification as their highest level of education, differences between bisexual men and all other groups were not statistically significant.
The level of education was generally higher among the population aged 25 to 64 than among older adults (aged 65 and over) across sexual orientation groups. However, older adults and those aged 25 to 64 had a similar educational attainment pattern between sexual orientation groups.
The share of adults aged 65 and over who completed a bachelor’s degree or higher was largest among lesbian or gay persons (33.0%) compared to that of bisexual (23.1%) and heterosexual (21.1%) population.
Source: Statistics Canada, Educational participation and attainment of lesbian, gay and bisexual people in Canada
<--- Return to Archive