The Economics and Statistics Division maintains archives of previous publications for accountability purposes, but makes no updates to keep these documents current with the latest data revisions from Statistics Canada. As a result, information in older documents may not be accurate. Please exercise caution when referring to older documents. For the latest information and historical data, please contact the individual listed to the right.
<--- Return to Archive
For additional information relating to this article, please contact:
April 08, 2022LABOUR MARKET TRENDS - MARCH 2022 Labour force survey results reflect the period from March 13 to 19. Many restrictions implemented to contain the Omicron variant of COVID-19 continued to be eased prior to this week. In Ontario, Manitoba, Alberta and Quebec, all capacity limits and proof-of-vaccination requirements were lifted. In Nova Scotia, moved to Phase 2 of reopening on March 7 and to Phase 3 after the LFS March survey period.
Ages 15+ (March 2022 vs February 2022, seasonally adjusted)
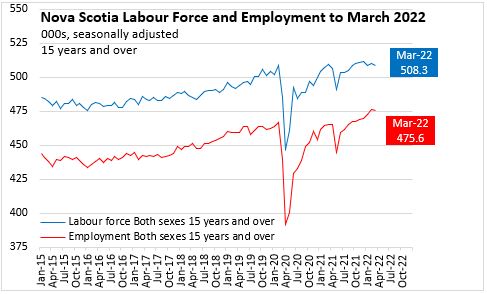
Nova Scotia's seasonally adjusted employment fell by 700 (-0.1%) from February 2022 to 475,600 in March 2022. This follows four consecutive months of employment gains in Nova Scotia.
The decline in employment was attributable to lower full-time employment (-1,700) while part-time employment rose by 900. These changes include variations in hours within the same job.
Nova Scotia’s labour force fell by 1,500 (-0.3%) to 508,300 in March 2022.
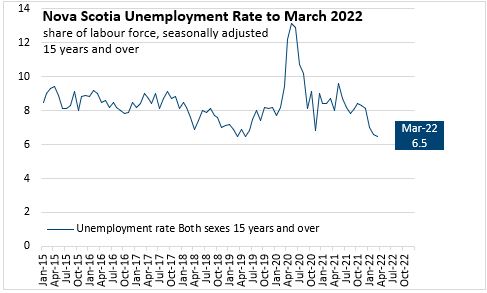
With the labour force falling faster than employment, Nova Scotia's unemployment rate declined from 6.6% in February 2022 to 6.5% in March 2022. This is the lowest unemployment rate in the monthly Labour Force Survey records dating back to 1976. March and May of 2019 reported the same monthly unemployment rate (6.5% each). Annual unemployment rates were lower in the 1960s and early 1970s.
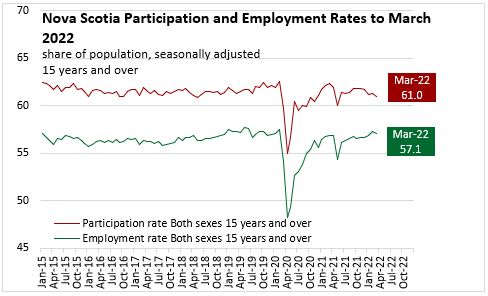
Nova Scotia's labour force participation rate fell by 0.3 percentage points to 61.0% in March 2022. The employment rate fell 0.2 percentage points to 57.1% in March 2022. Although employment levels have returned to pre-COVID benchmarks, the participation rate remains below the level observed in February 2020 (62.6%).

Ages 15+ (March 2022 vs March 2021, seasonally adjusted)
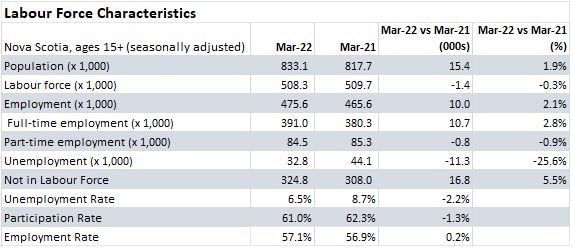
Compared with the same month last year, Nova Scotia's population increased by 15,400 while the labour force fell by 1,400 and employment increased by 10,000. The unemployment rate decreased by 2.2 percentage points while the participation rate declined by 1.3 percentage points. The employment rate increased by 0.2 percentage points.
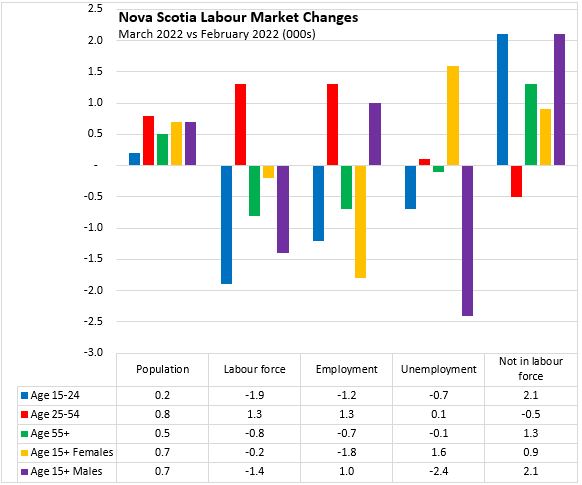
Age Cohorts (March 2022 vs February 2022, seasonally adjusted)
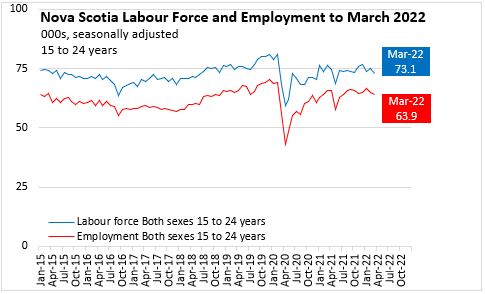
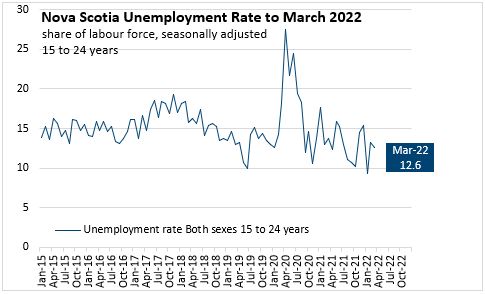
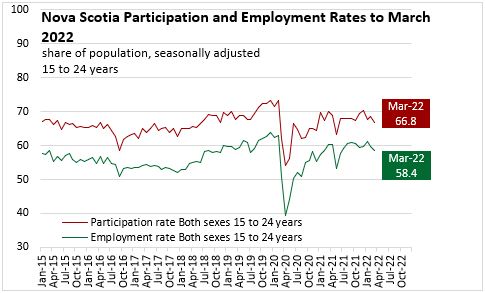
Among youth (ages 15-24), employment decreased 1,200 (-1.8%) while the labour force decreased by 1,900 (-2.5%). The fall in labour force resulted in the youth participation rate falling to 66.8% while the employment rate was down to 58.4%. The faster fall in labour force than employment moved the youth unemployment rate down to 12.6%.
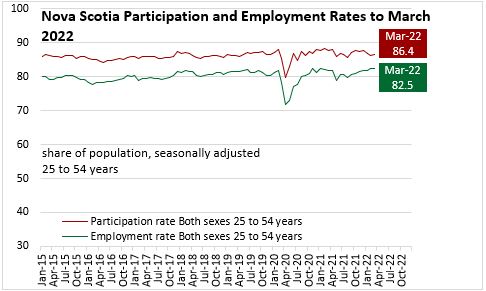
The population aged 25-54 makes up the largest part of the labour force. In the core age group, employment increased by 1,300 (+0.4%) and the labour force rose by 1,300 (+0.4%). The core aged unemployment rate edged up by 0.1 percentage points to 4.6% in March. This is the second lowest core aged unemployment rate (the lowest was February 2022) than at any time since the start of the monthly labour force survey in 1976; this monthly unemployment rate had not previously been below 5.0%.


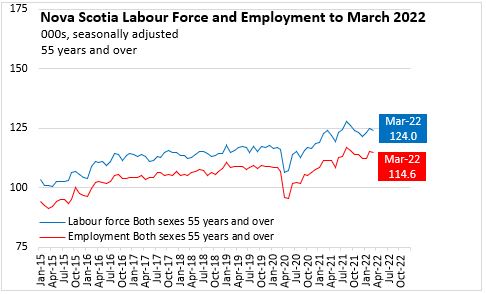
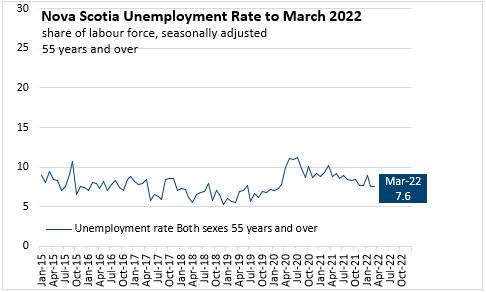
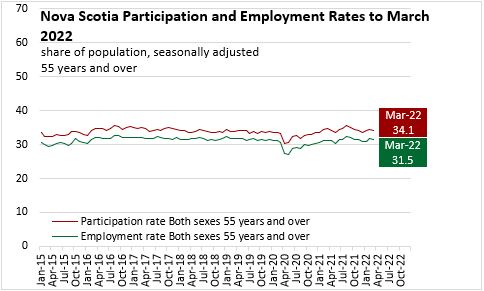
Older workers (aged 55+) reported declines in both labour force (-800 or -0.6%) and employment (-700 or -0.6%). The participation rate fell to 34.1% but the unemployment rate for older workers was unchanged at 7.6%.
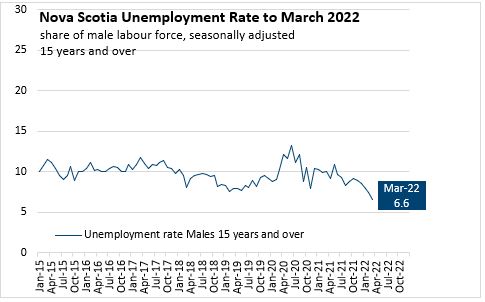
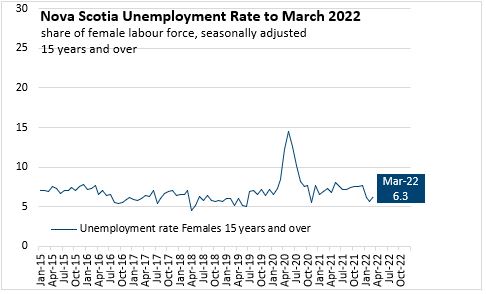
Males and Females (Ages 15+, March 2022 vs February 2022, seasonally adjusted)
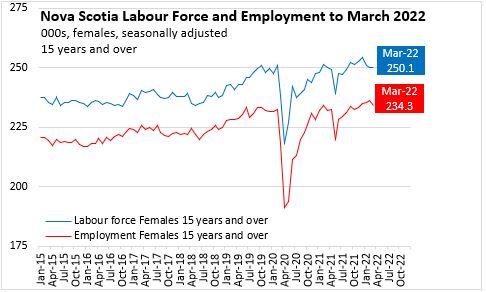
The monthly decline was concentrated among females, with rising employment for males partially offsetting declines in female employment. The male labour force declined by 1,400 (-0.5%) while male employment was up by 1,000 (+0.4%). Female employment fell by 1,800 (-0.8%) while female labour force was down by only 200 (-0.1%).

The male unemployment rate fell by 0.9 percentage points to 6.6% as employment grew against a declining labour force. The female unemployment rate rose by 0.6 percentage points to 6.3% in March 2022 as employment fell faster than the labour force.
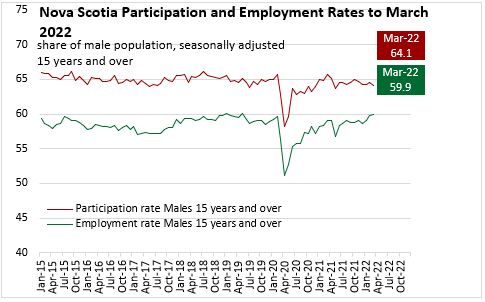
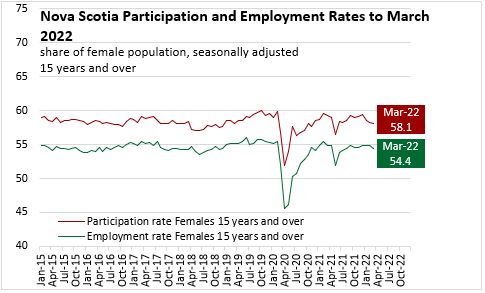
Male participation rates declined to 64.1% in March 2022 while female participation rates edged down to 58.1%. The employment rate for males was 59.9% while the female employment rate was 54.4%.
Overall, last month's decline in employment was concentrated among females as well as those aged 15-24 and 55+. The fall in labour force was concentrated among those aged 15-24 and 55+.
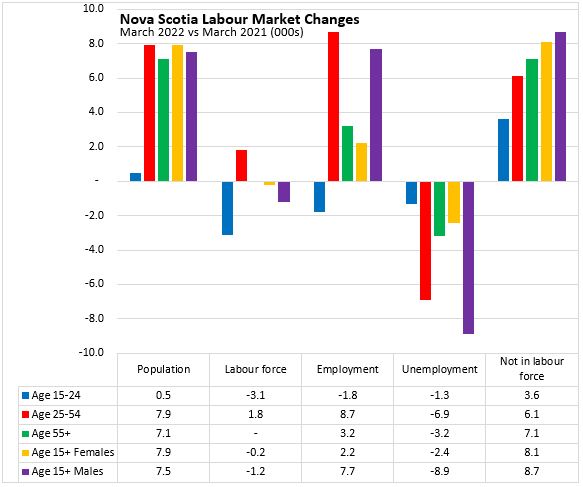
Age and sex cohorts (March 2022 vs March 2021, seasonally adjusted)
Since March 2021, employment gains were reported in each age cohort except youth. Growth in male employment was notably faster than for females. Males and core aged workers reported larger decreases in unemployment. The labour force contracted for those aged 15-24 as well as for women.
Class of Worker (March 2022 vs February 2022, seasonally adjusted)
The March 2022 employment decline was primarily among public sector employees (-1,800 or -1.5%) with only a small change in private sector employment (-200 or -0.1%). Self-employment rose (1,200 or +2.0%) to partially offset these declines.
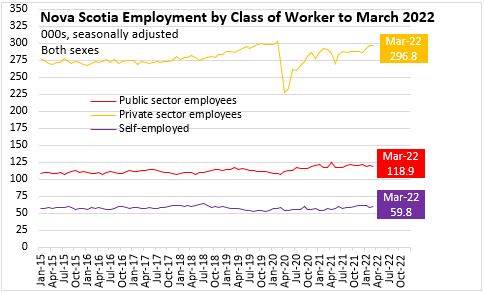
Class of Worker (March 2022 vs March 2021, seasonally adjusted)
Compared with March 2021, there were substantial gains in employment for private sector workers (+5,600 or +1.9%), public sector workers (+1,200 or +1.0%) and the self-employed (+3,200 or +5.7%).
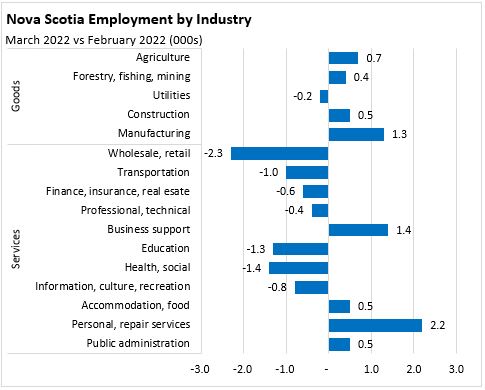
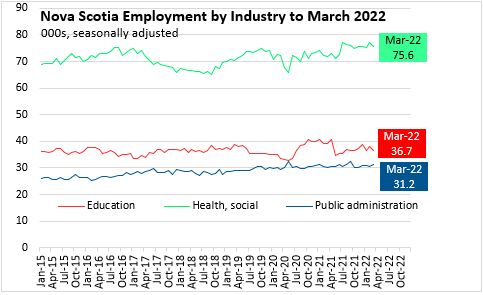
Industry of Employment (March 2022 vs February 2022, seasonally adjusted)
The employment decline from February to March was notably concentrated in services, with notable declines in wholesale/retail, health/social assistance, and education. These declines were partially offset by notable increases reported in personal/repair, business support services and manufacturing employment.
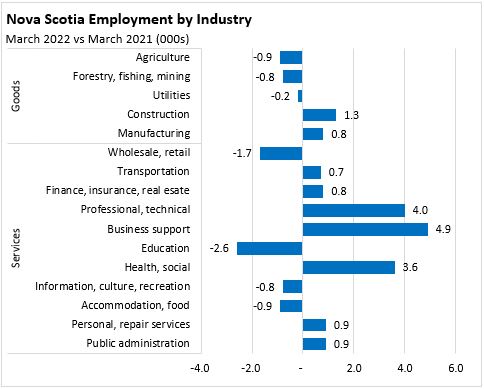
Industry of Employment (March 2022 vs March 2021, seasonally adjusted)
Over the last 12 months, employment has risen notably in business support services, professional/technical services, and health/social assistance. These increases were partially offset by lower employment in education, wholesale/retail, accommodation/food services and agriculture.

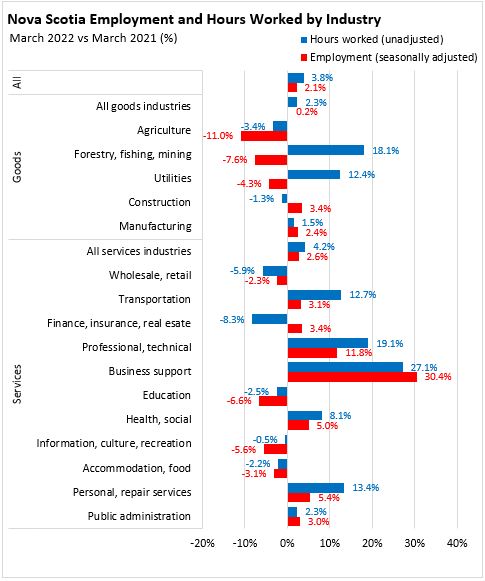
Hours worked (March 2022 vs March 2021, unadjusted)
Changes in hours worked (unadjusted) show different variations than changes in seasonally adjusted employment from March 2021 to March 2022. Overall employment was up 2.1% from March 2021 to March 2022, while hours worked increased by 3.8%. Increases in hours worked significantly outpaced employment growth or more than offset employment decline in several industries, notably: personal/repair services, health/social, education, professional/technical services, transportation/warehousing, utilities and forestry/fishing/mining. Only in construction, wholesale/retail and finance/insurance were there larger declines in hours compared to the change in employment.
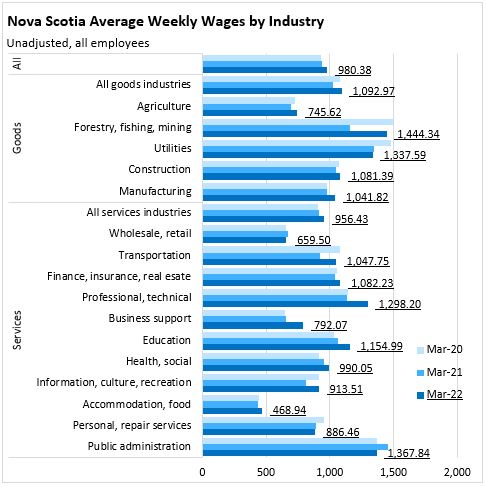
Average weekly earnings (unadjusted, both full time and part time, March 2022 vs March 2021)
Average weekly earnings increased by 4.8% from March 2021 to March 2022. Earnings were up by double digits across several industries: forestry/fishing/mining, business support services, professional/technical services, transportation/warehousing and information/culture/recreation. Average weekly earnings were down in public administration, personal/repair services, wholesale/retail and utilities.

Average weekly earnings across all employees were $980.38 in March 2022. The highest average weekly earnings (both full and part time employees) were reported in forestry/fishing/mining, public administration, utilities and professional/technical services. The lowest average weekly earnings were in accommodation/food and wholesale/retail.
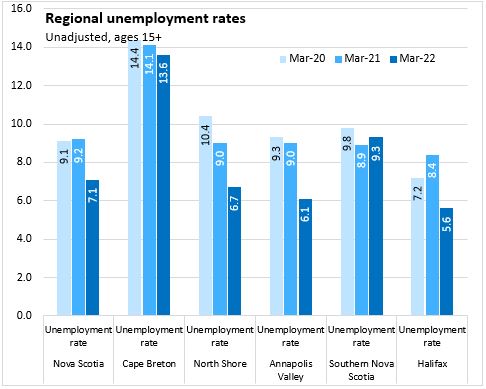
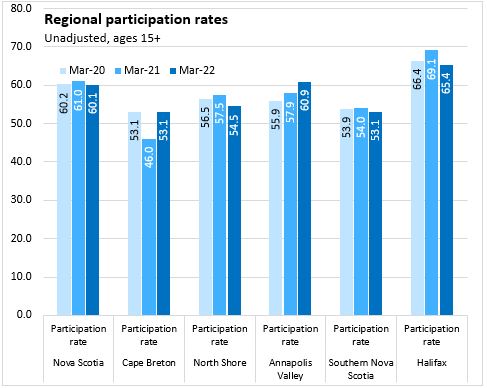
Regions (March 2022 vs March 2021, unadjusted 3 month moving average)
Compared with March 2021, all regions reported lower unemployment rates except for Southern Nova Scotia (where employment fell faster than the labour force). In Cape Breton and the Annapolis Valley, employment growth was proportionally faster than growth in labour force while in the North Shore economic region, the labour force declined faster than employment and in Halifax employment grew while labour force contracted.


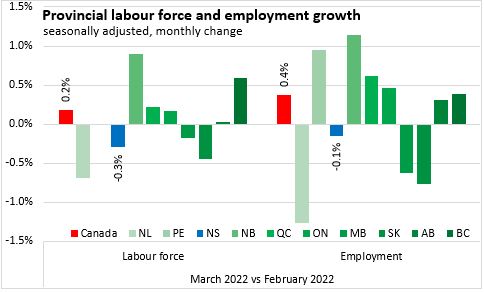
Provincial Comparisons (March 2022 vs February 2022, seasonally adjusted)
Canada's employment increased by 72,500 (+0.4%) from February to March, as many restrictions to contain the Omicron variant of COVID-19 continued to ease. The largest percentage employment gains were in Prince Edward Island and New Brunswick. Employment declined in Newfoundland and Labrador, Nova Scotia (not statistically significant), Manitoba and Saskatchewan.
The labour force was up 0.2% nationally with increases in 5 of 10 provinces. The largest increases in labour force were reported in New Brunswick and British Columbia, while the largest declines were in Newfoundland and Labrador and Saskatchewan.
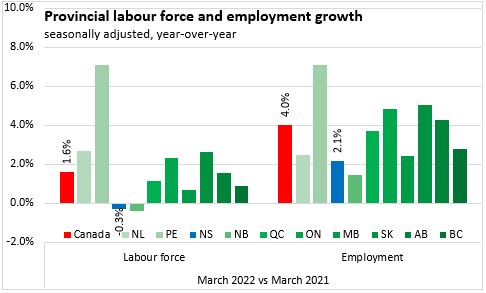
Provincial Comparisons (March 2022 vs March 2021, seasonally adjusted)
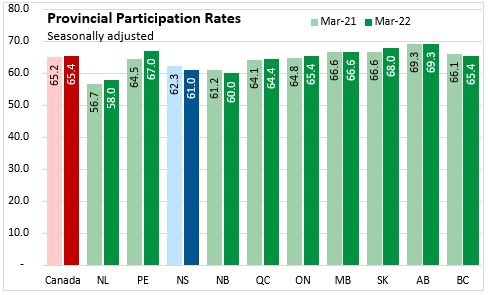
Compared with March 2021, national employment was up 4.0% while labour force increased by 1.6%. Only Nova Scotia and New Brunswick reported a decline in the labour force over this period, though both reported rising employment. All other provinces reported both rising labour force as well as employment. The fastest gains in employment and labour force were reported in Prince Edward Island.
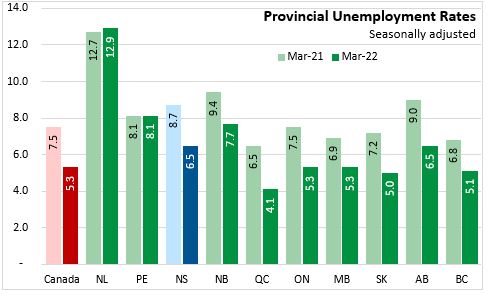
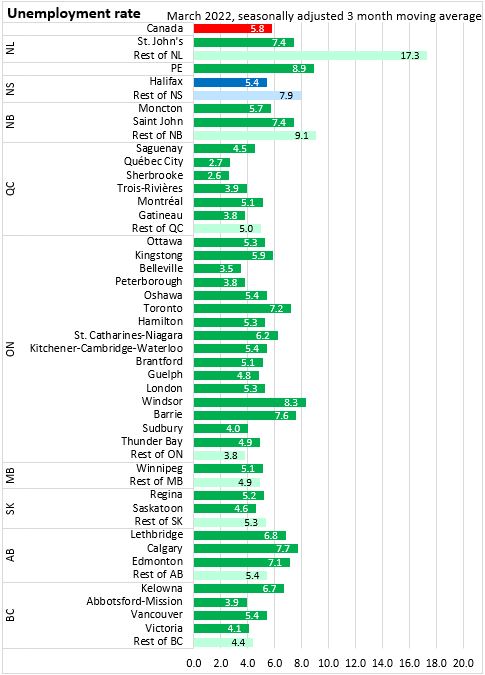
The national unemployment rate was 5.3% in March 2022, down from 5.5% in February 2022 and 7.5% in March 2021. This was the lowest unemployment rate for Canada in the monthly Labour Force Survey results that started in 1976. Newfoundland and Labrador reported the highest unemployment rate while the lowest unemployment rates were reported in Quebec.
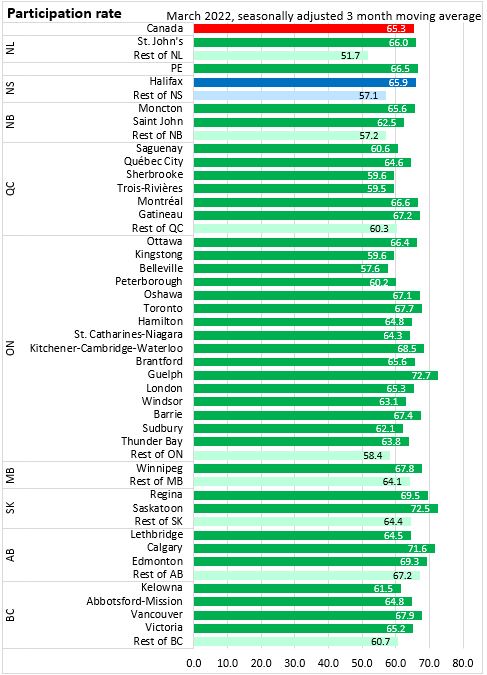
The national participation rate was 65.4% in March 2022. The highest participation rates were in Alberta while the lowest were in Newfoundland and Labrador.
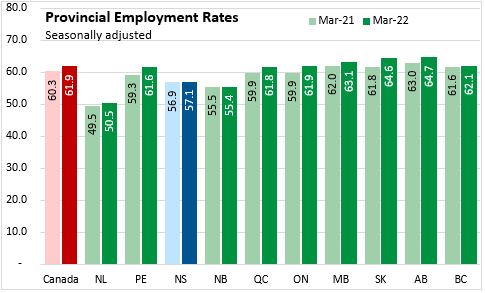
The national employment rate was 61.9% in March 2022. Alberta and Saskatchewan reported the highest employment rates while Newfoundland and Labrador reported the lowest.
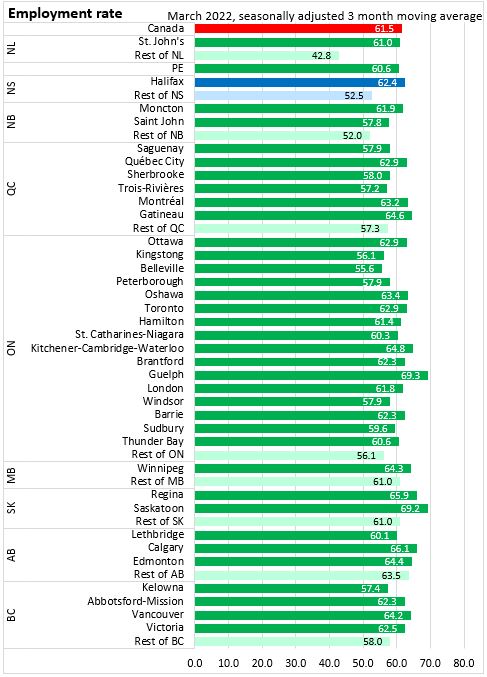
Census Metropolitan Areas (March 2022, seasonally adjusted 3 month moving average)
Data for Census Metropolitan Areas are three month moving averages from January 2022 to March 2022. As restrictions changed over these months, the three month moving averages may not reflect the volatility observed from month to month.
The Halifax unemployment rate was 5.4% in the March 2022 three month moving average. This was similar to other Census Metropolitan Areas, but lower than in the rest of Nova Scotia (7.9%). Generally, unemployment rates in Census Metropolitan Areas are similar to unemployment rates outside CMAs; the Atlantic Provinces are the exception with substantially higher unemployment rates outside CMAs.
Halifax's participation rate was 65.9% in the March 2022 three month moving average.
Halifax reported an employment rate of 62.4% in the March 2022 three month moving average.
Sources: Statistics Canada. Table 14-10-0036-01 Actual hours worked by industry, monthly, unadjusted for seasonality; Table 14-10-0063-01 Employee wages by industry, monthly, unadjusted for seasonality; Table 14-10-0287-01 Labour force characteristics, monthly, seasonally adjusted and trend-cycle, last 5 months; Table 14-10-0294-01 Labour force characteristics by census metropolitan area, three-month moving average, seasonally adjusted and unadjusted, last 5 months; Table 14-10-0293-01 Labour force characteristics by economic region, three-month moving average, unadjusted for seasonality, last 5 months; Table 14-10-0355-01 Employment by industry, monthly, seasonally adjusted and unadjusted, and trend-cycle, last 5 months (x 1,000); Table 14-10-0288-01 Employment by class of worker, monthly, seasonally adjusted and unadjusted, last 5 months (x 1,000); Table: 14-10-0380-02 Labour force characteristics, three month moving average, seasonally adjusted (x 1,000)
<--- Return to Archive