The Economics and Statistics Division maintains archives of previous publications for accountability purposes, but makes no updates to keep these documents current with the latest data revisions from Statistics Canada. As a result, information in older documents may not be accurate. Please exercise caution when referring to older documents. For the latest information and historical data, please contact the individual listed to the right.
<--- Return to Archive
For additional information relating to this article, please contact:
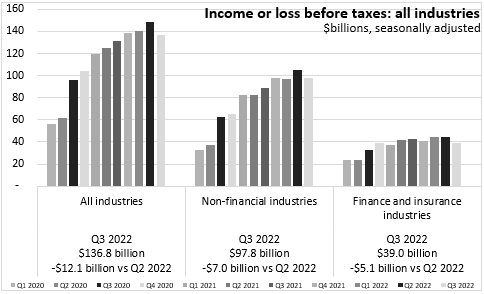
November 23, 2022QUARTERLY FINANCIAL STATISTICS FOR ENTERPRISES, Q3 2022 In Q3 2022, Canadian enterprise net income before taxes (seasonally adjusted) decreased by $12.1 billion from the previous quarter to $136.8 billion. Net income before taxes was down $7.0 billion for non-financial corporations to $97.8 billion and was down $5.1 billion to $39.0 billion in finance and insurance corporations. Rising interest rates, labour shortages, falling commodity prices and currency depreciation all contributed to weaker corporate net income.
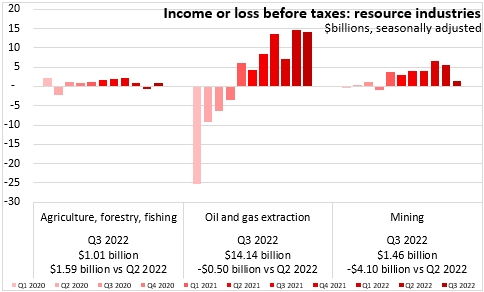
Among resource extraction industries, agriculture/forestry/fishing returned to positive net income before taxes while oil and gas extraction net income declined slightly and mining net income contracted sharply.
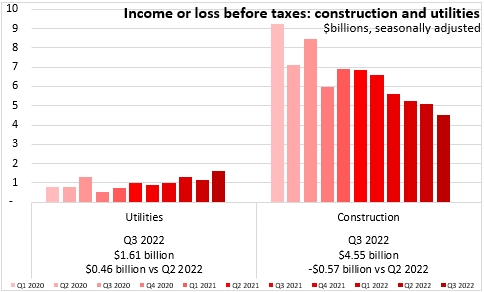
Construction net income before taxes contracted for the 6th consecutive quarter while utility net income was up.
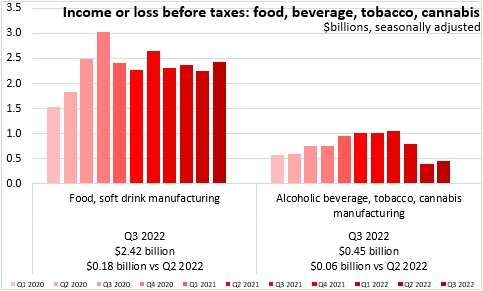
Within manufacturing industries, food and soft drink manufacturing net income before taxes rose, as did net income for alcohol/tobacco/cannabis manufacturers, though net income for these industries remains substantially lower than at the same time in 2021.
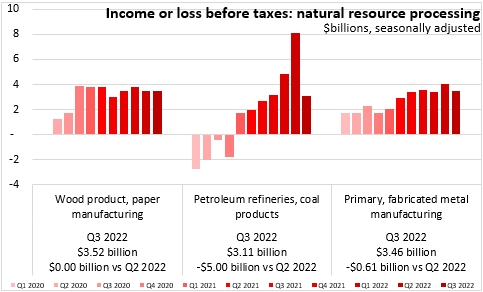
Among primary processing manufacturers, net income was little changed in forest products and down substantially for petroleum and coal product manfaucturing. Net income also contracted for primary/fabricated metal manufacturers.
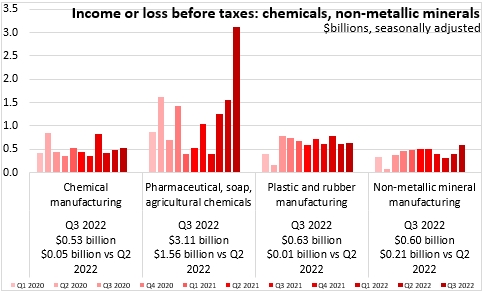
In Q3 2022, there was a sharp rise in net income before taxes for pharmaceutical/soap/agricultural chemical manufacturers as well as for non-metallic mineral product manufacturers (including concrete). Increases were more modest for chemical as well as plastics/rubber product manufacturers.
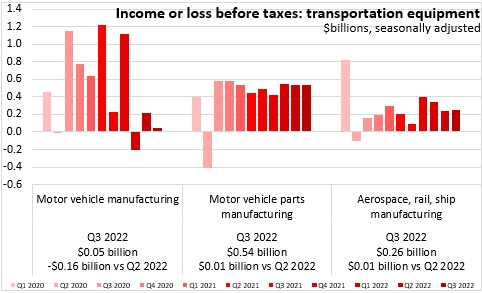
Net income before taxes was down for motor vehicle manufacturers, steady for motor vehcile parts manufacturers and up slightly for other transportation equipment manufacturing industries.
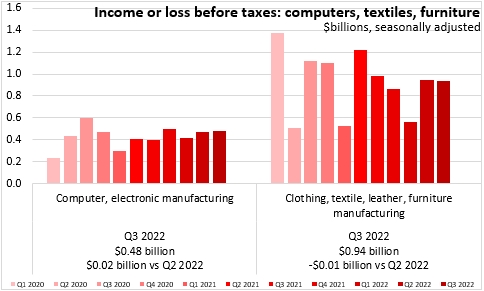
Net income were little changed among Canada's computer/electronics manufacturers and clothing/textile/furniture manufacturers.
Net income increased in Q3 for the range of Canadian wholesale businesses.
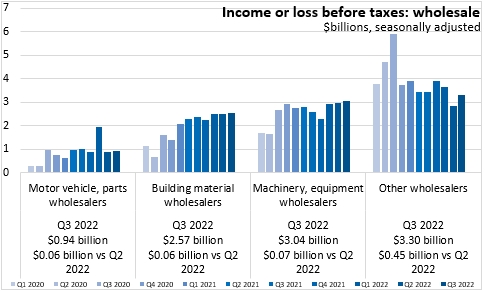
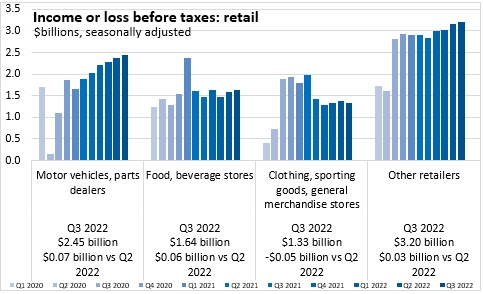
Retail net income was up for most categories (exception: clothing/sporting goods/general merchandise stores).
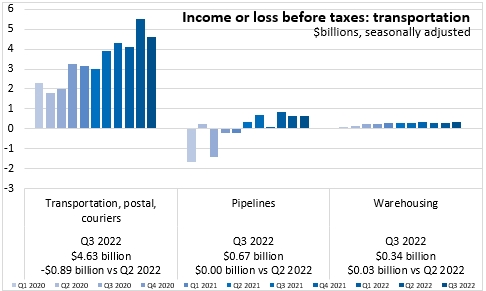
Net income for transportation businesses was down, though there were slight gains in pipelines and warehousing.
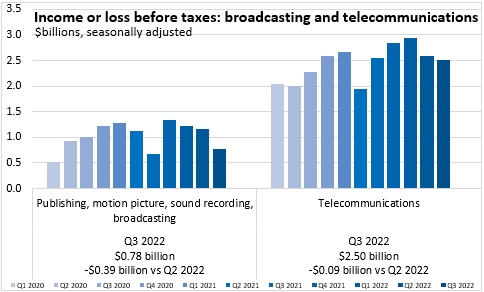
Net incomes were down for broadcasting/content creation as well as for telecommunications providers.
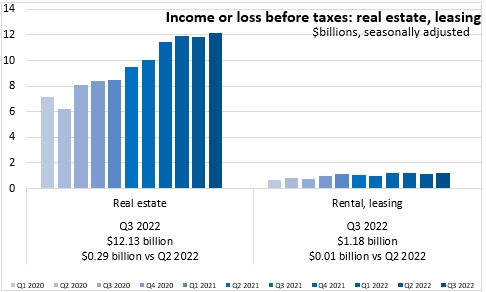
Net incomes before tax in real estate and rentals/leasing were both up in the last quarter.
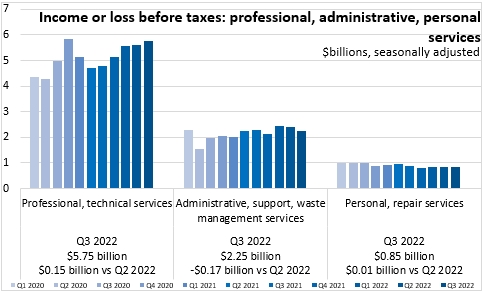
Net incomes continue to rise for professional/technical service industries - up for the 5th consecutive quarter. Net incomes were down for administrative/support/waste management services and little changed in personal/repair service industries.
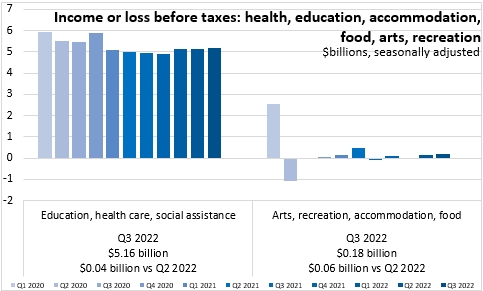
Net incomes were up slightly for businesses in health, education and social assistance. Net incomes in arts/recreation/accommodation/food services were also up, but remain substantially lower than in Q1 2020.
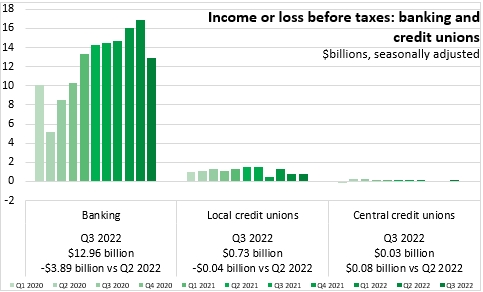
Within financial industries, there was a sharp decline in net income before taxes for banking, along with small changes in net income for credit unions.
Net incomes were also up for credit card/consumer lending companies as well as for other non-depository credit intermediation activities.
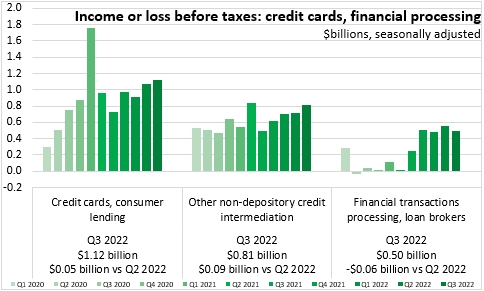
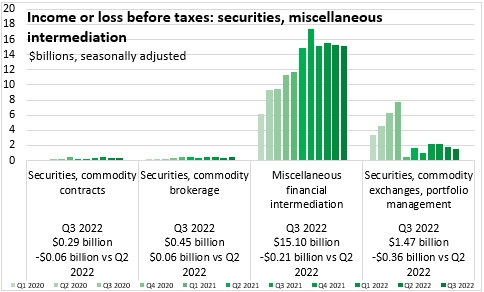
Net incomes were down for miscellaneous financial intermediation activities.
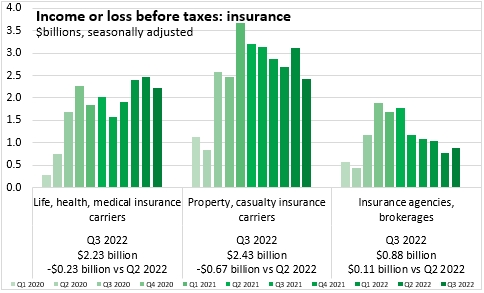
Net incomes contracted for insurance carriers in Q3.
Source: Statistics Canada. Table 33-10-0226-01 Quarterly balance sheet and income statement, by industry, seasonally adjusted (x 1,000,000)
<--- Return to Archive