The Economics and Statistics Division maintains archives of previous publications for accountability purposes, but makes no updates to keep these documents current with the latest data revisions from Statistics Canada. As a result, information in older documents may not be accurate. Please exercise caution when referring to older documents. For the latest information and historical data, please contact the individual listed to the right.
<--- Return to Archive
For additional information relating to this article, please contact:
May 13, 2024BUILDING PERMITS, MARCH 2024 Monthly (seasonally adjusted, March 2024 vs February 2024)
Changes in monthly building permit values are typically very volatile, with large swings from one month to the next.
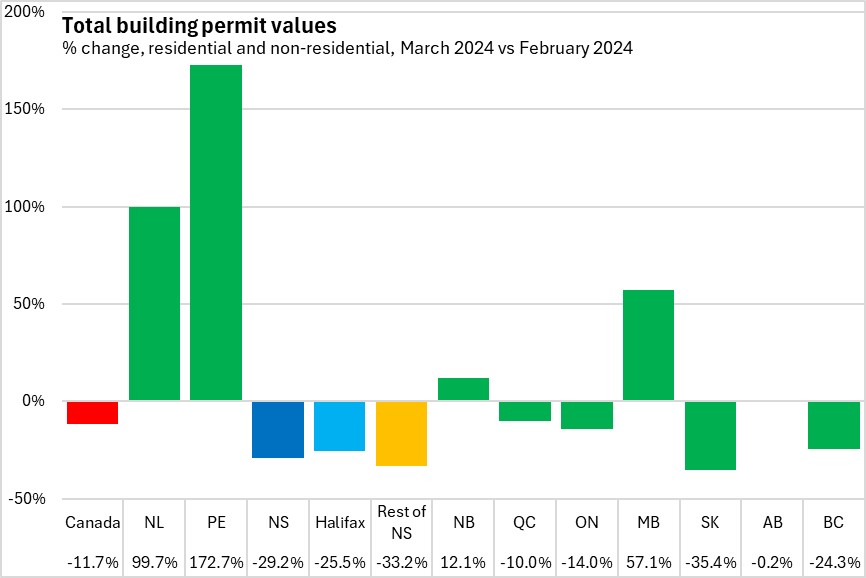
Nova Scotia's total building permits (residential and non-residential) declined by 29.2% to $235.0 million. Halifax permits fell by 25.5% to $127.6 million while permits outside the city decreased 33.2% to $107.4 million. National permits fell 11.7% to $10.53 billion. Building permit values were down in 6 of 10 provinces, with Saskatchewan reporting the steepest decline (followed by Nova Scotia). Newfoundland and Labrador and Prince Edward Island reported the largest monthly increases in building permit values.
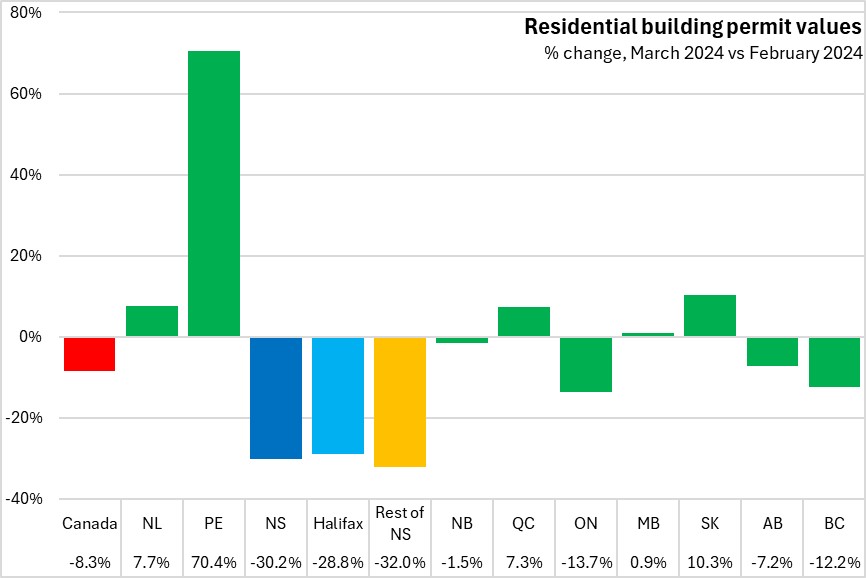
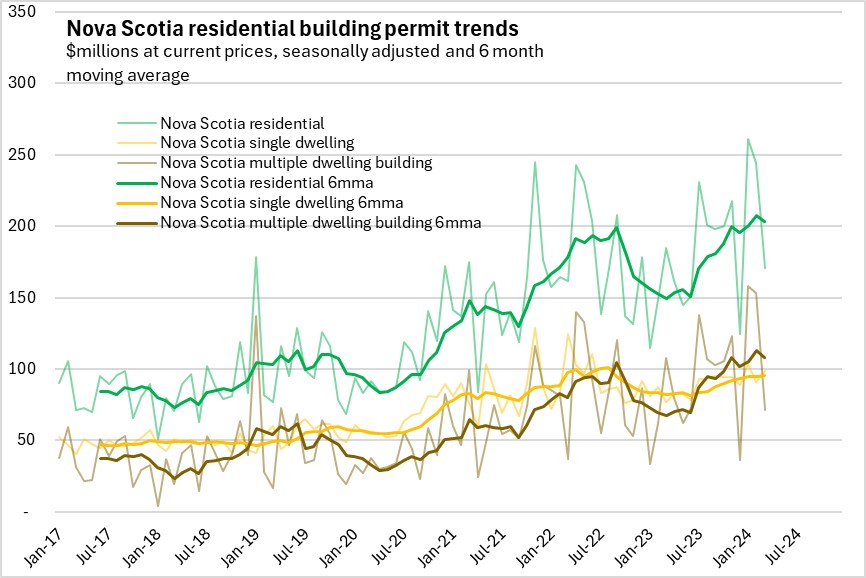
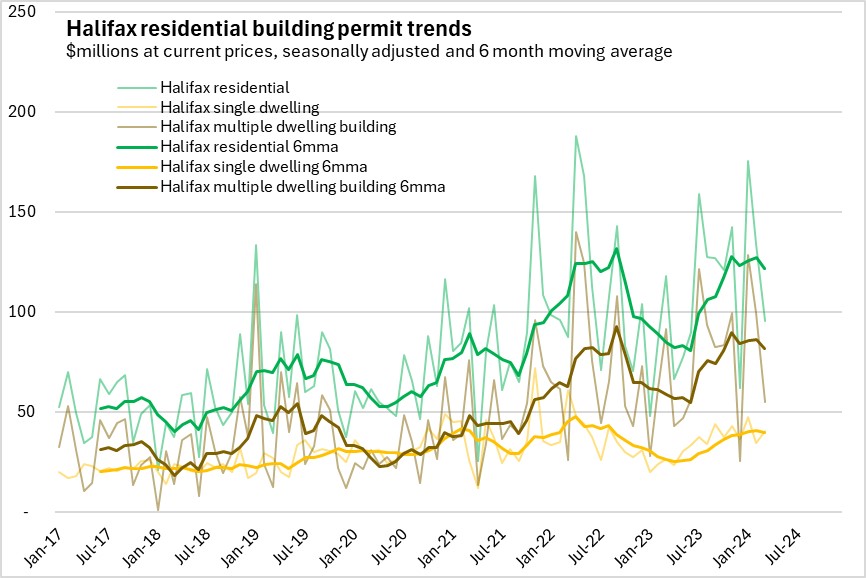
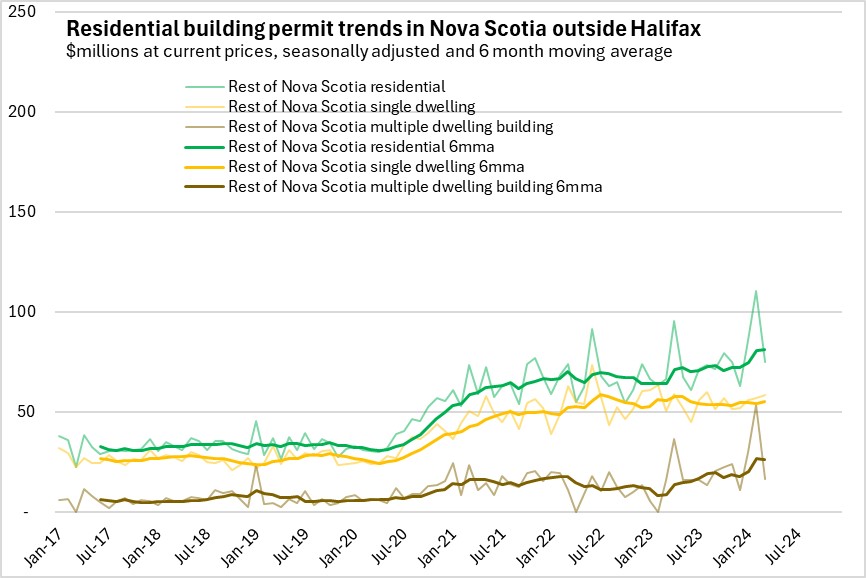
Nova Scotia's residential building permits dropped 30.2% to $170.4 million. Halifax residential permits fell 28.8% to $95.3 million. Outside the city, residential permit values decreased 32.0% to $75.0 million. National residential building permit values decreased 8.3% to $6.53 billion. Residential permit values were up in 5 of 10 provinces, led by Prince Edward Island. Nova Scotia reported the largest decline among provinces.
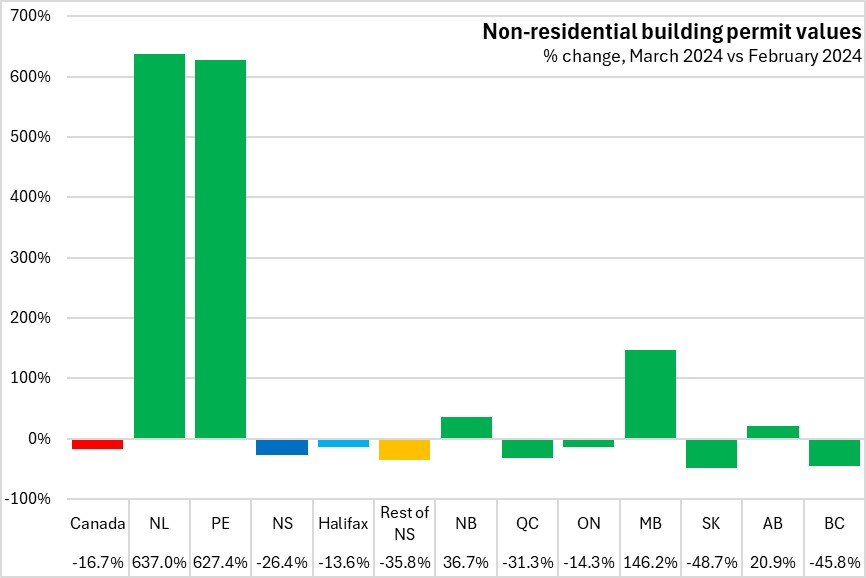
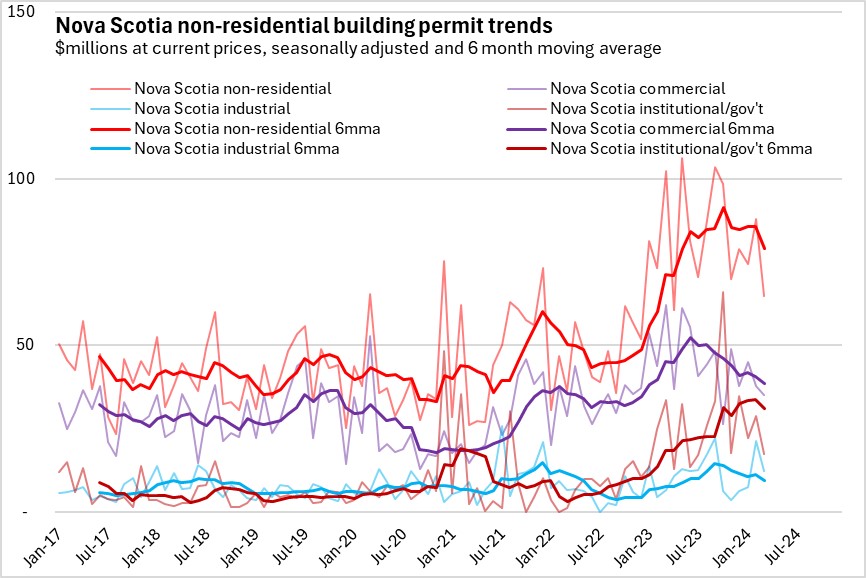
Nova Scotia's non-residential building permits decreased 26.4% to $64.7 million. Halifax permits decreased 13.6% to $32.3 million. Outside the city, non-residential permit values decreased 35.8% to $32.4 million. National non-residential building permit values decreased 16.7% to $4.00 billion. Non-residential permit values were up in 5 of 10 provinces, with Prince Edward Island and Newfoundland and Labrador reporting sharp increases. Saskatchewan and British Columbia reported the steepest declines.
Year-to-date (January-March 2024 vs January-March 2023)
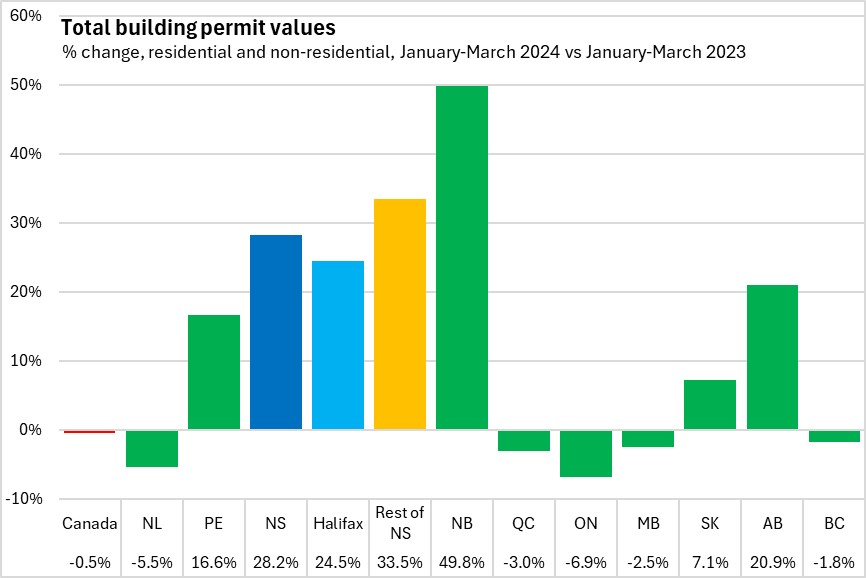
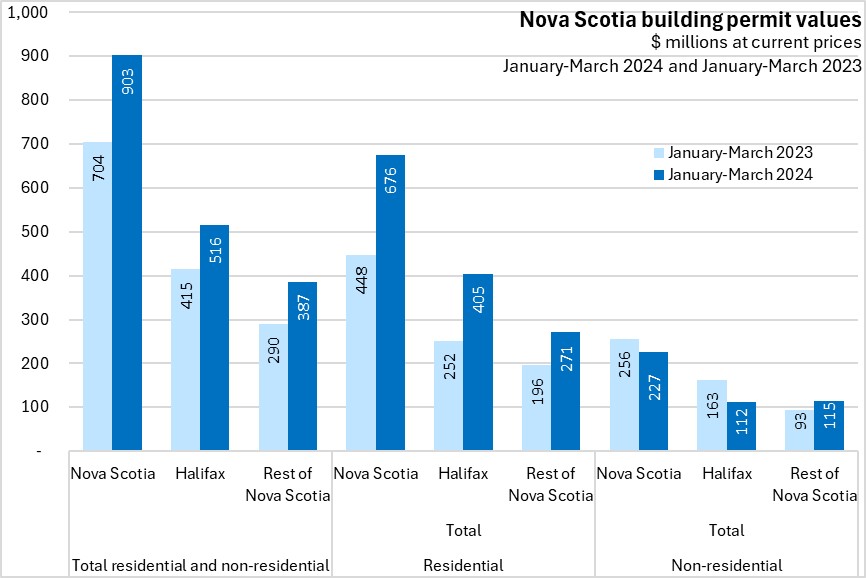
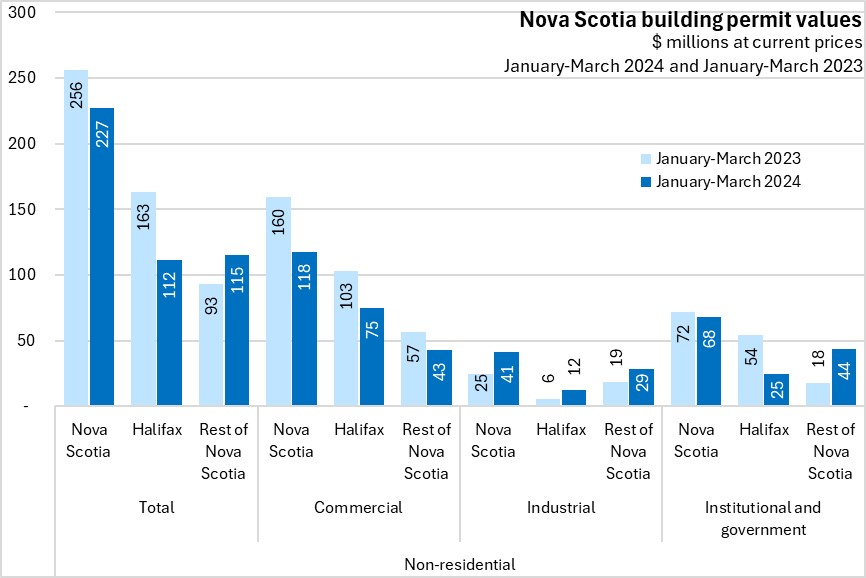
Nova Scotia reported notably high building permit values in both January and February before a pull-back in March. Despite the decline in the last month, Nova Scotia's total building permits (residential and non-residential) were up 28.2% in comparing the first quarter of the year with the same period in 2023. Halifax permits increased 24.5% and outside the city permit values increased 33.5%. National permits were down 0.5%. Building permit values were up in 5 of 10 provinces, led by New Brunswick (followed by Nova Scotia). Ontario reported the largest decline.
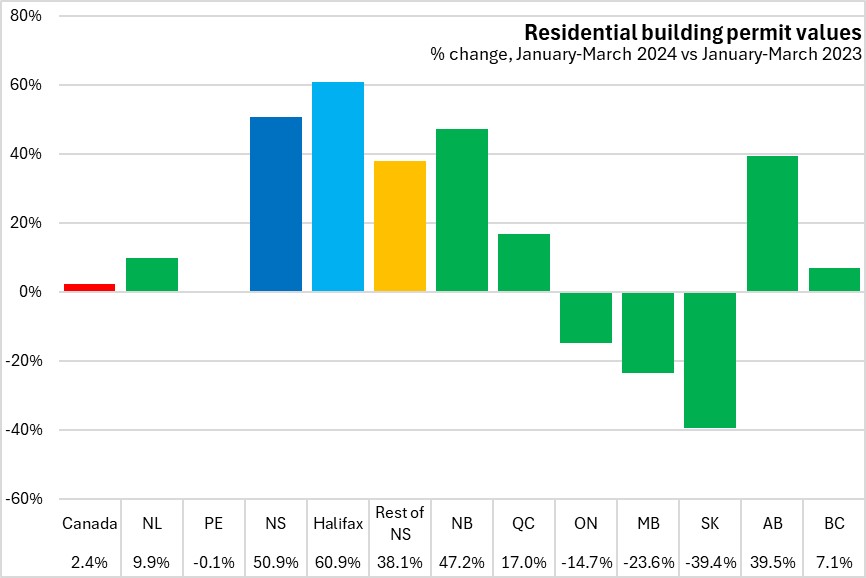
In the first three months of 2024, Nova Scotia's residential building permits increased 50.9% compared to the same period in 2023 - the fastest increase among provinces. Halifax residential permits increased 60.9% and outside the city residential permit values increased 38.1%. National residential building permit values increased 2.4%. Residential permit values were up in six provinces. Saskatchewan reported the largest decline.
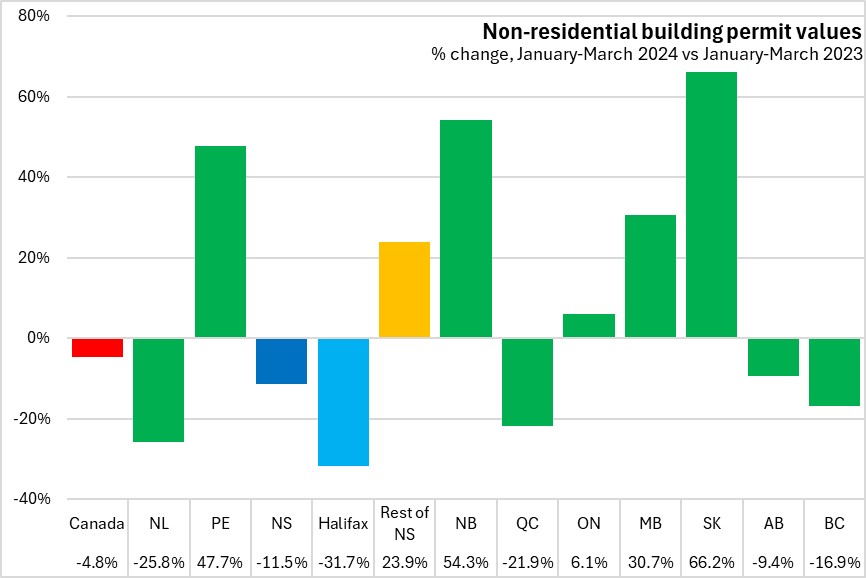
Nova Scotia's non-residential building permits decreased 11.5% in the first three months of 2024 (compared with the same period in 2023). Halifax permits decreased 31.7% while non-residential permits outside the city rose 23.9%. National non-residential building permit values decreased 4.8%. Non-residential permit values were up in 5 of 10 provinces, led by Saskatchewan. Newfoundland and Labrador reported the largest decline.
Rising residential permit values boosted overall building permit values in Nova Scotia in the first three months 2024 (compared with same months of 2023), offsetting the decline in non-residential permits.
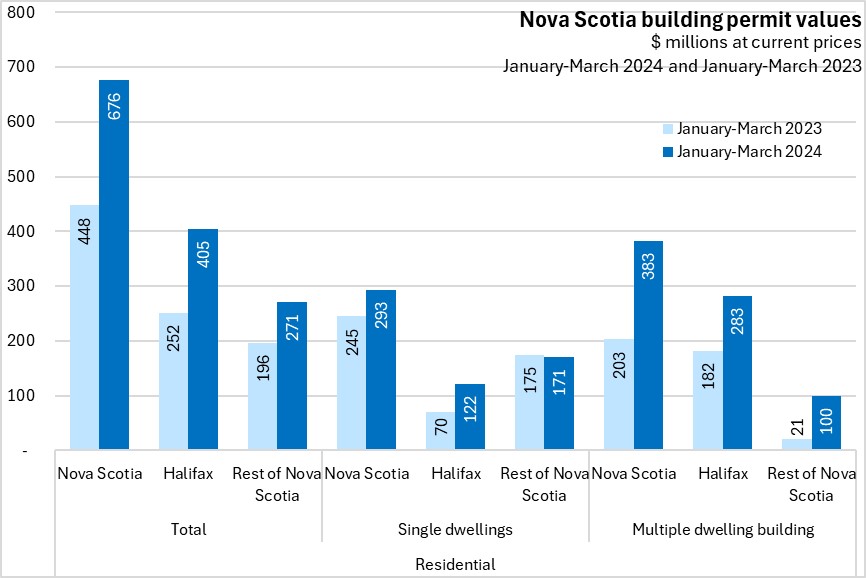
There was an increase in single dwelling unit permits in Halifax, but single dwelling unit expenditures fell outside the city. Multiple unit residential permits rose across the province.
Non-residential permit values were down in commercial projects across the province. Institutional and government building permits were down in Halifax as well. These declines were only partially offset by rising institutional and government project permits outside Halifax and higher industrial permits across the province.
Trends
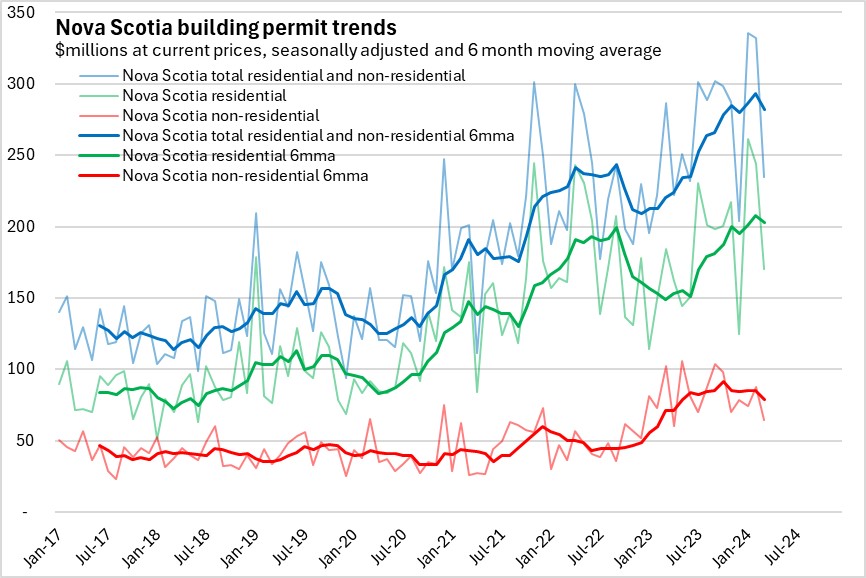
Overall building permit values have generally been on a rising trend since the middle of 2021, though there have been periods of declining values over this period. Rising permit values are mostly driven by higher residential permits within Halifax as well as outside the city.
After trending down in late 2022 and early 2023, residential permit values started to rise again in Halifax in the middle of last year. Residential permit values outside the city have been consistently above pre-pandemic levels since 2022.
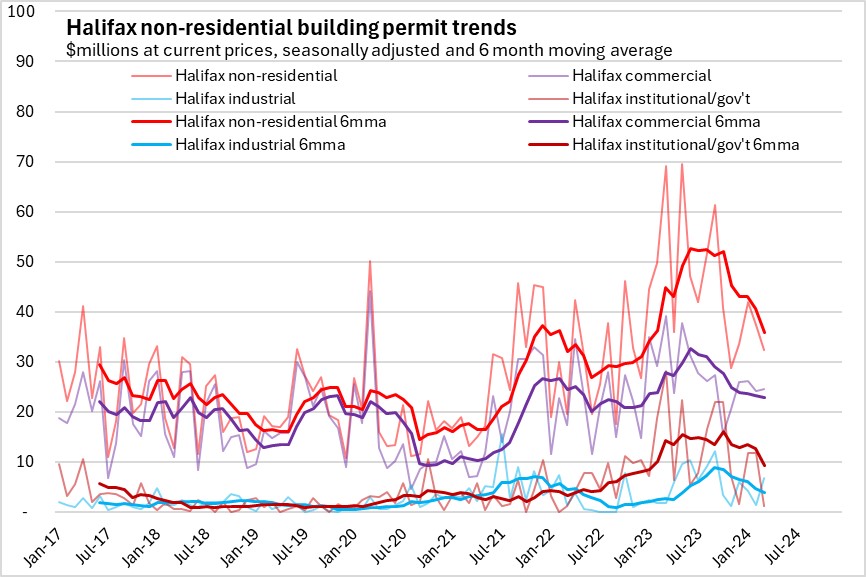
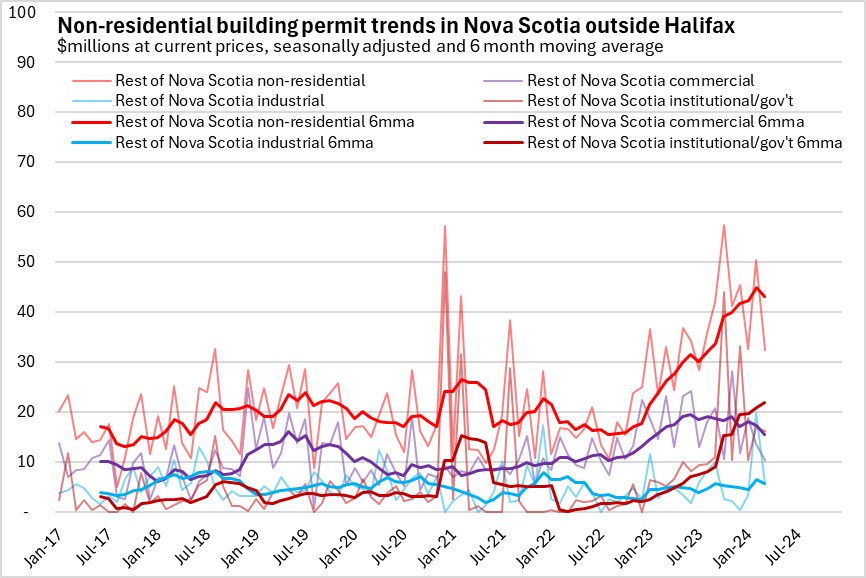
Nova Scotia's non-residential building permit values started to rise in early 2023 before reaching a plateau through the end of the year. Non-residential permit values have reached a peak in recent months in Halifax with an upward trend since the middle of 2022 in the rest of the province.
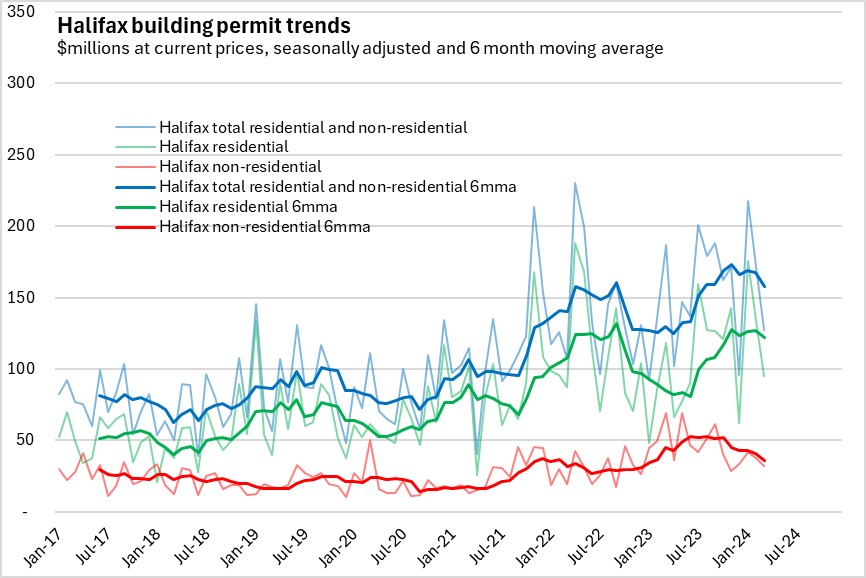
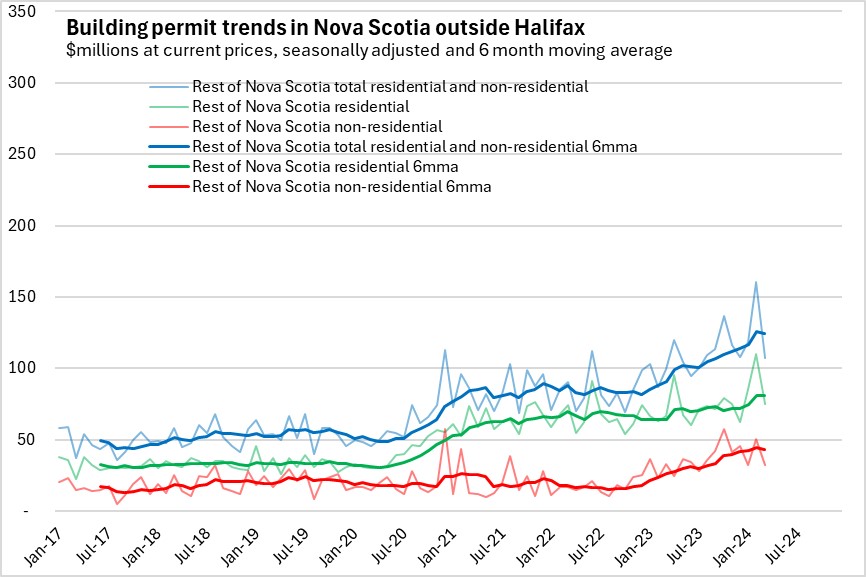
Trends in residential permit values reflect the differences in housing markets for Halifax and the rest of the province. In Halifax, growth in permit values for multi-unit dwellings has outpaced growth in single-dwelling unit permits. Outside the city the situation is reversed, where single dwelling unit permits are more common than permits for multi-unit structures.
Non-residential building permits have lower values than residential permits. After rising in early 2023, Halifax values for industrial building permits have peaked. Halifax commercial building permits have been trending down while institutional/government projects have picked up. Outside the city, permits have continued to trend upward particularly on a recent rise in institutional/government permits.
Source: Statistics Canada. Table 34-10-0285-01 Building permits, by type of structure and type of work (x 1,000)
<--- Return to Archive