The Economics and Statistics Division maintains archives of previous publications for accountability purposes, but makes no updates to keep these documents current with the latest data revisions from Statistics Canada. As a result, information in older documents may not be accurate. Please exercise caution when referring to older documents. For the latest information and historical data, please contact the individual listed to the right.
<--- Return to Archive
For additional information relating to this article, please contact:
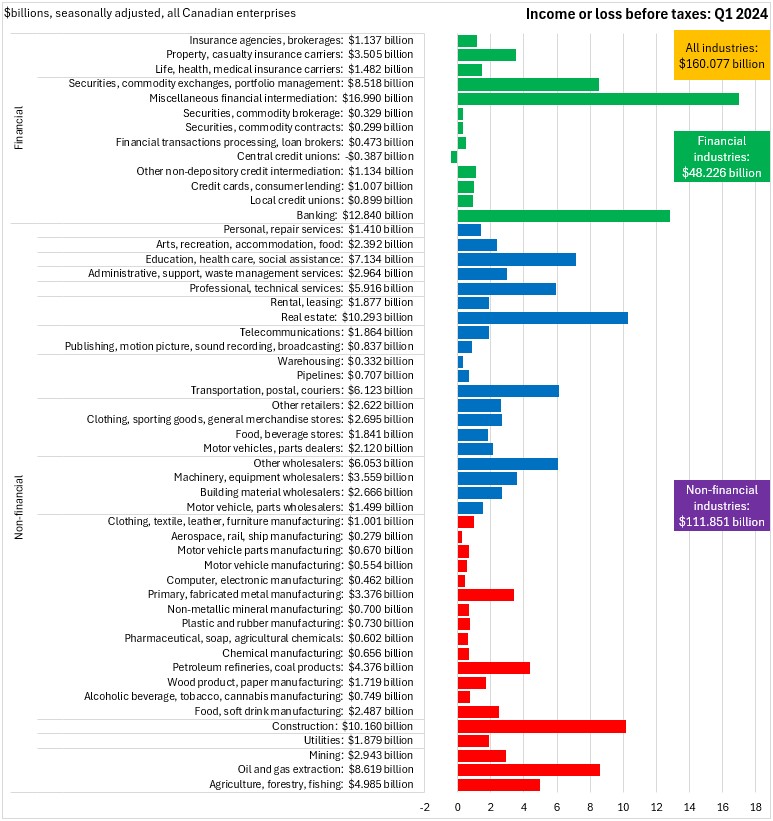
May 24, 2024CANADA FINANCIAL STATISTICS FOR ENTERPRISES, Q1 2024 In Q1 2024, Canadian enterprise net income before taxes (seasonally adjusted) was $160.077 billion. All broad industry categories except central credit unions reported positive income before taxes in Q1 2024 . The largest values of net income before taxes were reported in miscellaneous financial intermediation ($16.990 billion), banking ($12.840 billion), real estate ($10.293 billion), construction ($10.160 billion), oil/gas extraction ($8.619 billion) and securities/exchanges/portfolio management ($8.518 billion).
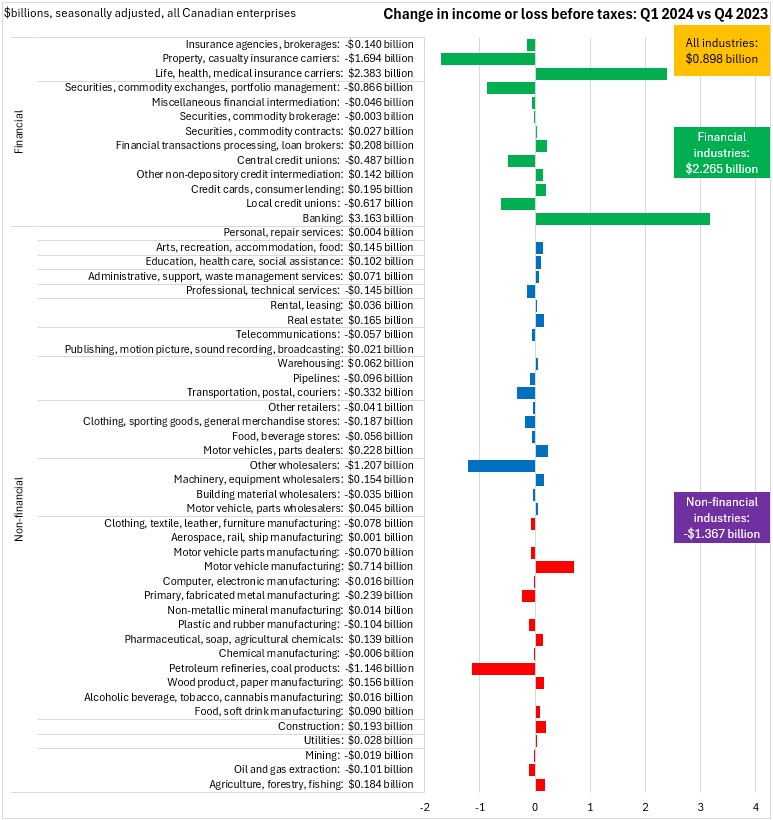
Compared with Q4 2023, net income before taxes increased by $0.898 billion across all industries. Net income grew by $2.265 billion for financial/insurance industriesNet income for non-financial industries declined by $1.367 billion. Banking and life/health/medical insurance carriers reported the largest gains in net income before taxes. Petroleum refineries and coal product manufacturers along with property/casualty insurers and other wholesalers reported the largest declines in net income before taxes.
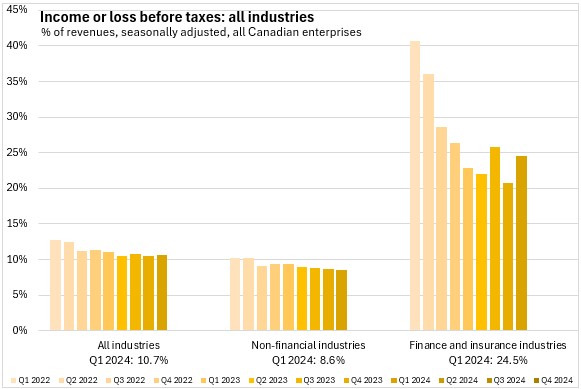
Measured as a share of revenue, income before taxes averaged 10.7% across all industries; 24.5% for financial industries and 8.6% for non-financial industries. Income as a share of revenues was down for non-financial industries and up for financial industries.
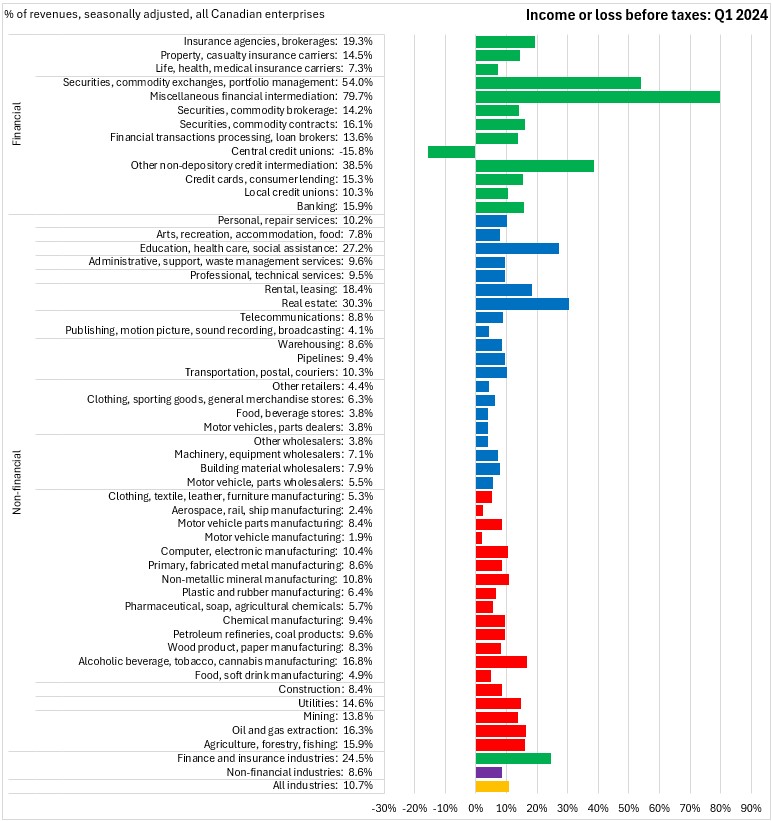
Measured as a share of revenue, income before taxes was highest in miscellaneous financial intermediation (79.7% of revenues), followed by securities/exchanges/portfolio management (54.0%) and other non-depository credit intermediation (38.5%). Outside of financial industries, income before taxes as a share of revenue was highest in: real estate (30.3%), education/health/social assistance (27.2%, including daycares) and rentals/leasing (18.4%).
Source: Statistics Canada. Table 33-10-0226-01 Quarterly balance sheet and income statement, by industry, seasonally adjusted (x 1,000,000)
<--- Return to Archive