The Economics and Statistics Division maintains archives of previous publications for accountability purposes, but makes no updates to keep these documents current with the latest data revisions from Statistics Canada. As a result, information in older documents may not be accurate. Please exercise caution when referring to older documents. For the latest information and historical data, please contact the individual listed to the right.
<--- Return to Archive
For additional information relating to this article, please contact:
June 24, 2024VALUE ADDED IN EXPORTS, 2020 Statistics Canada has updated its estimates of value added and employment embodied in Canadian exports.
Value-added represents the contribution of labour and capital to the production process. Its components are labour income, gross operating surplus (or profits and depreciation) and taxes net of subsidies on production. The sum of value-added by all industries plus taxes net of subsidies on products is equal to GDP.
Exports only generate income (GDP) within Nova Scotia when value is added to either the domestically-produced or imported outputs. However, exports are typically reported on a gross basis, including the cost of imported inputs. Statistics Canada’s supply and use tables allow for the calculation of the proportion of exports that represent value added, and therefore, income generated within the provincial economy.
Statistics Canada's estimates calculate a value added amount within each sector that generates the exports. Statistics Canada further estimates the amount of value added created by upstream sectors within a province that supply an exporting sector. Statistics Canada also estimates the number of jobs associated with exports - both within exporting sectors and upstream sectors that supply them.
These estimates allow examination of the relative significance of trade for each province and sector. As the data are constructed using supply and use tables, there is a considerable lag in their production and they have only been updated to 2020 (along with revisions to prior years).
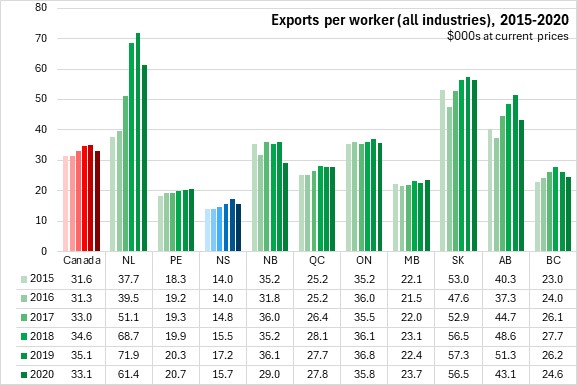
Overall, Nova Scotia's economy generated the least amount of exports (scaled to total employment in all industries) at $15,726 per worker. This value was down 8.5% from 2019. Across Canada, 7 of 10 provinces reported declining exports per worker in 2020, when pandemic-related economic distortions were most acute.
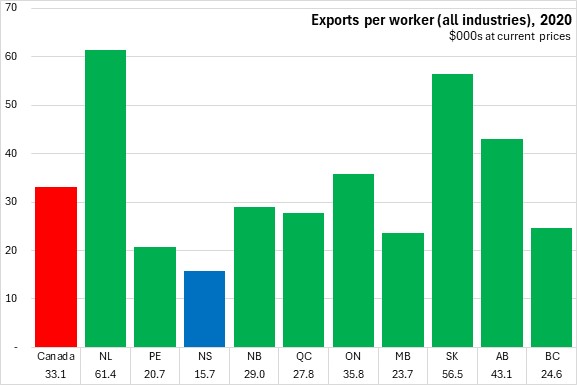
Resource-producing provinces (Newfoundland and Labrador, Saskatchewan, Alberta) still reported the highest exports per worker in 2020. Exports in New Brunswick, Newfoundland and Labrador and Alberta all exhibited the strongest declines in exports per worker in 2020, when crude oil prices contracted sharply during the pandemic. Manitoba, Prince Edward Island and Québec were the only provinces reporting rising exports per workers in 2020.
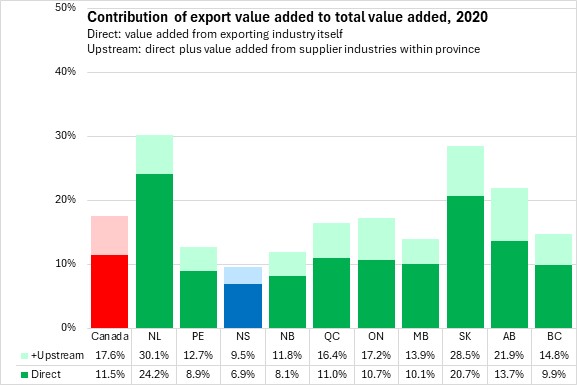
Of the total value added in the economy, Nova Scotia relied the least on exports to generate value added, with 9.5% of provincial value added (ie: GDP) accounted for by value added in exports (either directly or in upstream in supplier industries within the province). Newfoundland and Labrador generated the largest portion of its provincial value added from exports at 30.1%. The share of provincial value added created from exports sectors was also higher for Alberta and Saskatchewan. The Maritime provinces reported the lowest shares of GDP accounted for by value added in exports.
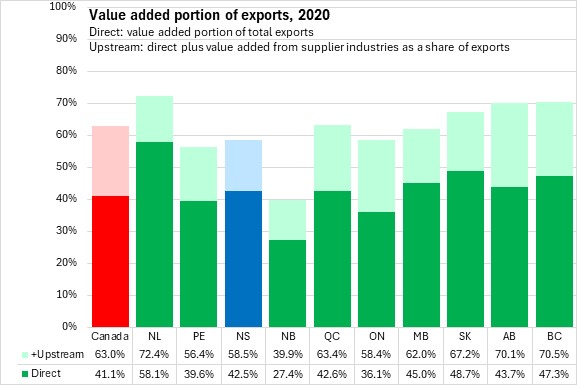
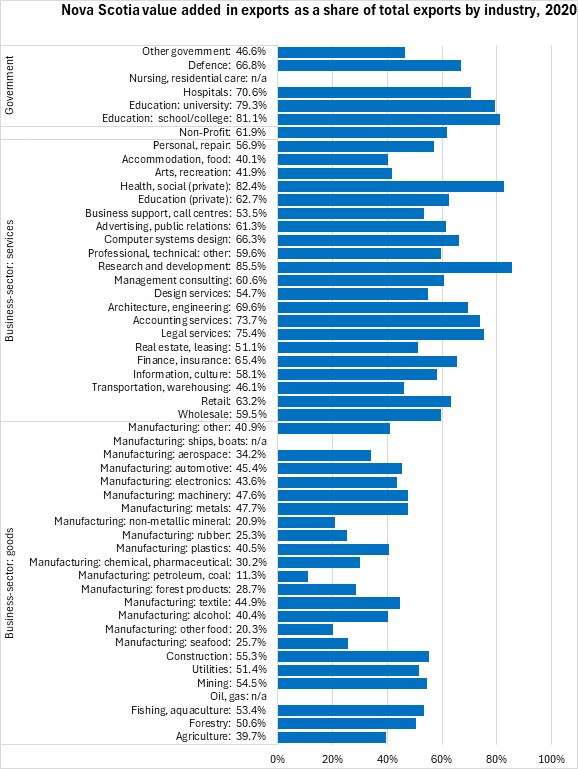
Despite its relatively low export intensity, the amount of direct value added measured as a share of total exports in Nova Scotia (42.5%) was comparable to the national average (41.1%). Counting the value added in exports created in upstream supplier industries of the exporting sector, 58.5% of Nova Scotia's exports represented value added that generated income within the province. New Brunswick's value added share of exports was lower because of the large value of imported content in its sizable petroleum refining industry.
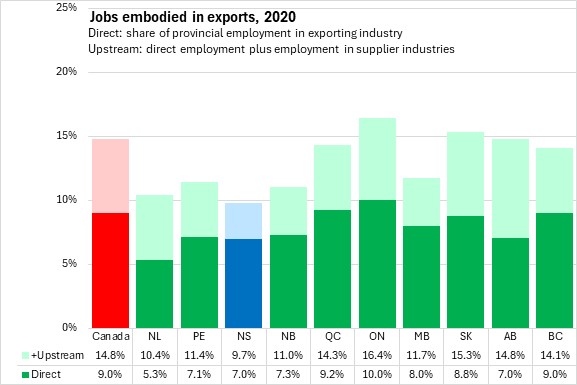
Nova Scotia's employment was comparatively less dependent on international exports as only 7.0% of jobs were attributable directly to exports. Including upstream jobs embodied in exports, Nova Scotia's share of employment connected to exports was 9.7% (lowest among provinces). The national average share of employment from exports was 14.8%. The highest share was in Ontario at 16.4%.
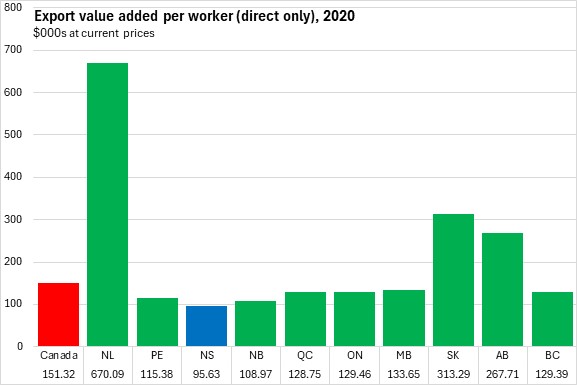
The amount of export value added per worker (directly within exporting industries) was $95,632 for Nova Scotia, well below the national average of $151,321. The national average of direct value added per worker was higher oil-producing provinces where export values are high relative to low labour intensity for oil and gas industries.
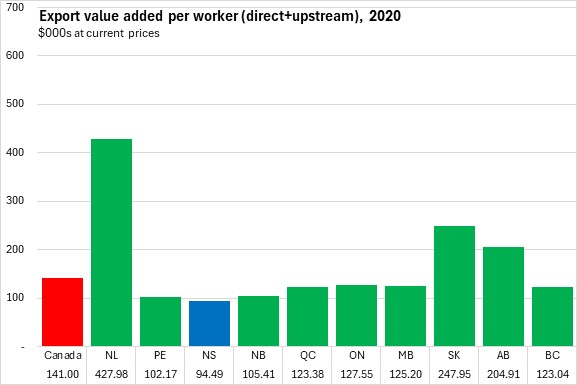
Including upstream value added to exports and upstream employment, Nova Scotia's export value added per worker was slightly lower at $94,487 per worker. However, export value added per worker in provinces with resource-intensive economies was considerably lower after including upstream workers as upstream industries are more labour-intensive than oil and gas extraction.
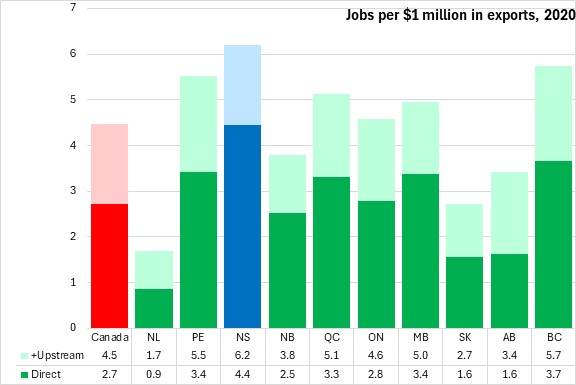
Calculating the number of workers required to generate $1 million in exports offers another perspective on the relationship between exports and employment. Nova Scotia's exports were the most labour intensive in the country requiring 6.2 jobs to generate $1 million in exports.
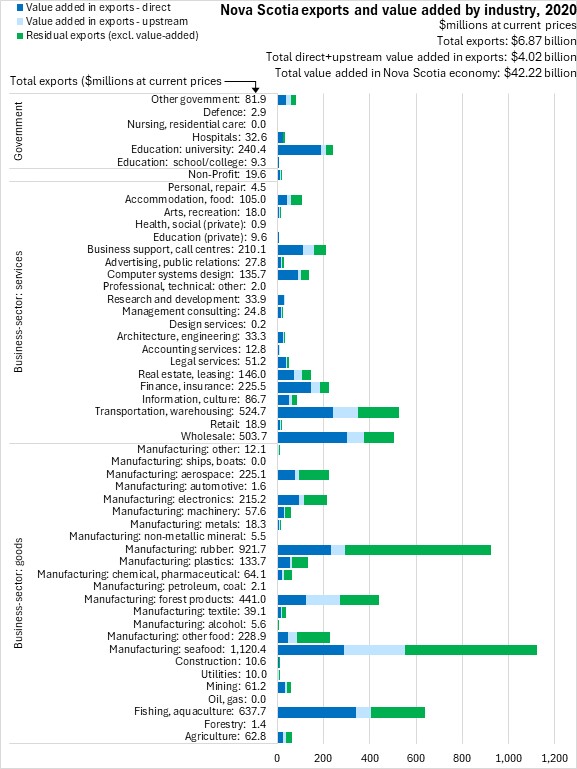
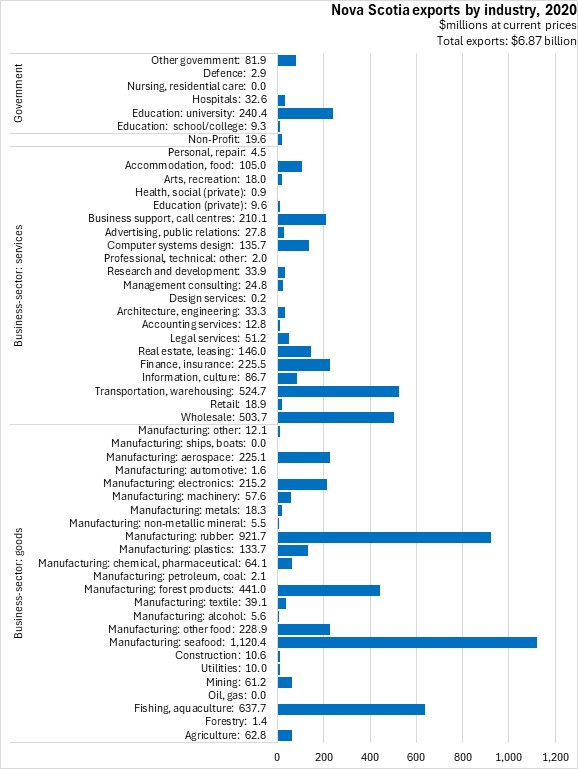
The value added in exports data also provides the most detailed information on the value of exports from all industries, including services. Of the total value of $6.87 billion in exports from Nova Scotia in 2020, the largest values were from manufacturing, notably seafood products ($1,120.4 million, not including unprocessed), rubber products ($921.7 million) and fishing/aquaculture products ($637.7 million). Transportation services ($524.7 million), wholesale trade ($503.7 million), forest products ($441.0 million) and university education ($240.4 million) contributed the next largest exports. Accommodation and food services exports were down notably due to the pandemic's restrictions.
From its exports, Nova Scotia generated $4.02 billion in added value, including the exporting industry as well as upstream industries within the province.
The chart below illustrates the amount of value added generated within each exporting industry as well as the value added generated in upstream industries.
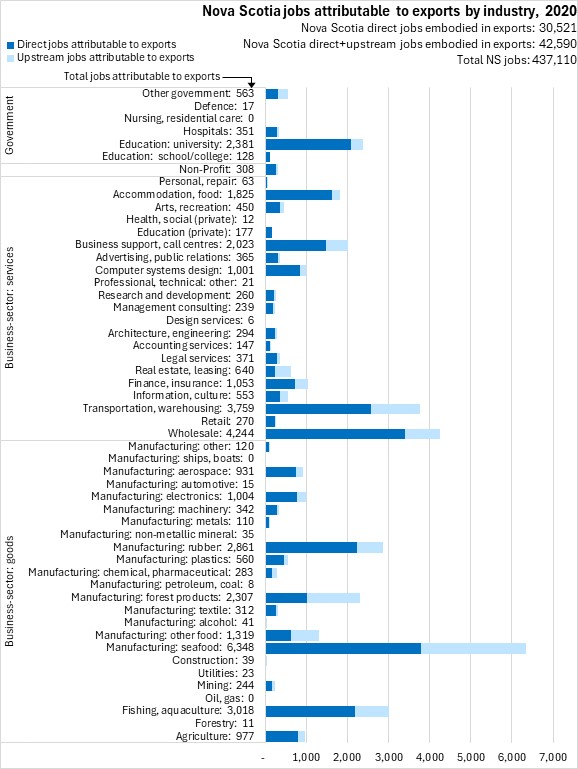
Statistics Canada estimates that in 2020 30,521 jobs were directly attributable to exports from all industries. Including upstream industries, 42,590 jobs in Nova Scotia depended on exports. Seafood processing exports generated 6,348 jobs in 2020. The next largest contributions of exports to employment were reported in wholesale trade (4,244), transportation/warehousing (3,759), fishing/aquaculture (3,018), rubber products manufacturing (2,861) university education (2,381) and forest products (2,307).
With fewer imported inputs, exports of services generally had higher value added portions of total exports than exports of goods.
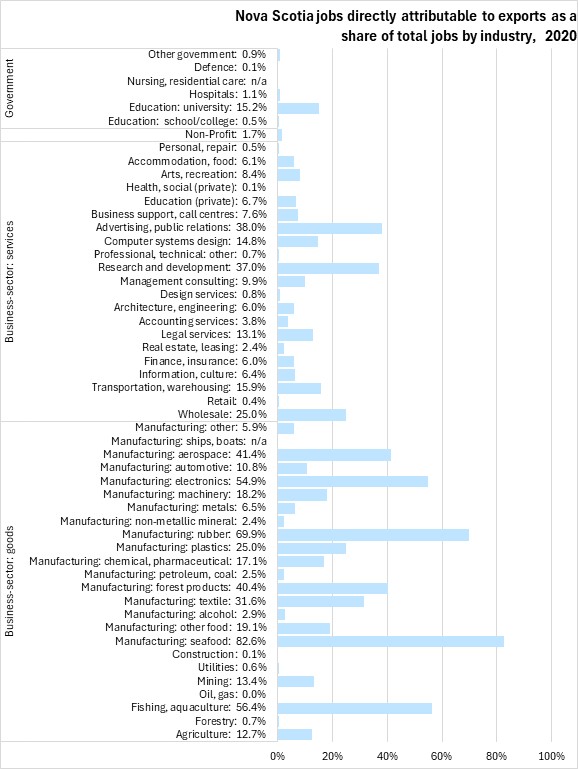
Measured by the share of total employment directly attributable to exports, the most export intensive industries in Nova Scotia were seafood product manufacturing, rubber product manufacturing, fishing/aquaculture and electronics manufacturing.
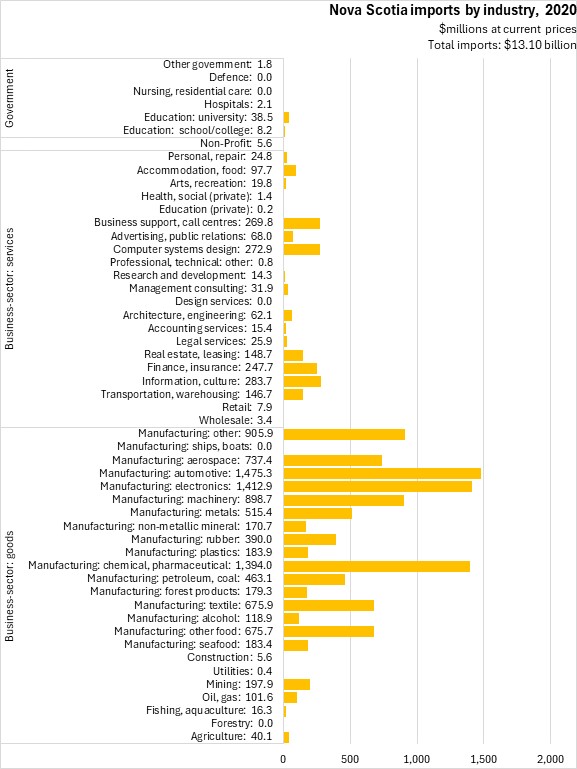
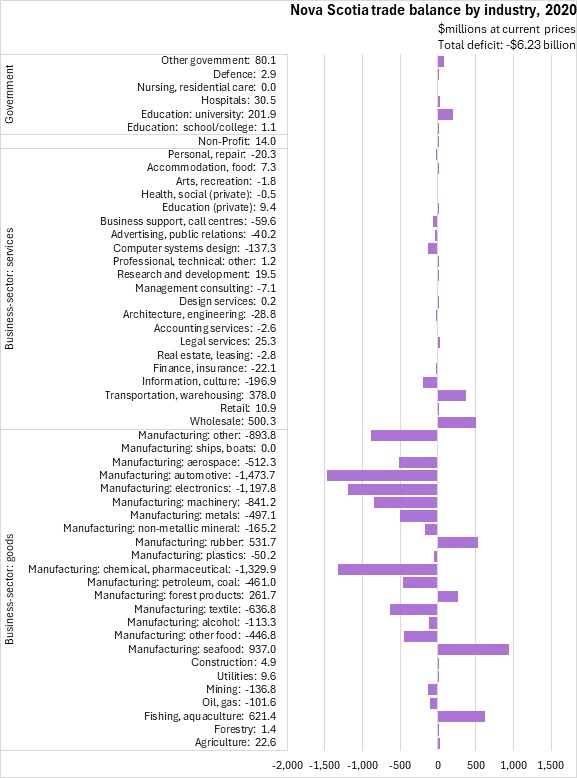
Statistics Canada's value added in exports also provides data on imports by sector as well, allowing the assessment of a trade balance by industry. Nova Scotia's imports are heavily concentrated in manufactured products, notably: automotive, electronics, chemical/pharmaceutical, machinery, metals, food and refined petroleum. With relatively little production in these industries (except food), Nova Scotia has a substantial trade deficit in these products, with imports in excess of exports. Nova Scotia's products and services with trade surplus include: agriculture, fishing/aquaculture, seafood processing, forest products, rubber products, wholesale trade, transportation/warehousing and university education. Accommodation and food services typically reports a trade surplus as well, but this was distorted in 2020 by pandemic restrictions.
Statistics Canada: Table 12-10-0100-01 Value added in exports, by industry, provincial and territorial
<--- Return to Archive