The Economics and Statistics Division maintains archives of previous publications for accountability purposes, but makes no updates to keep these documents current with the latest data revisions from Statistics Canada. As a result, information in older documents may not be accurate. Please exercise caution when referring to older documents. For the latest information and historical data, please contact the individual listed to the right.
<--- Return to Archive
For additional information relating to this article, please contact:
May 01, 2026PROVINCIAL GDP BY INDUSTRY 2025 [PRELIMINARY] Statistics Canada released preliminary estimates of real GDP by industry for the provinces and territories in 2025. Real GDP growth is measured at the industry level with chained 2017 dollars at basic prices (sellers' prices before taxes less subsidies on products) that removes the effect of price changes.
2025 vs 2024
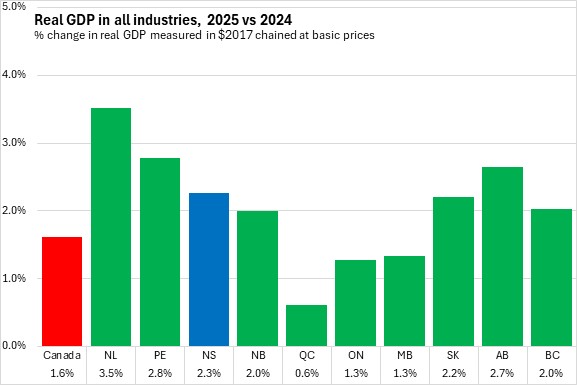
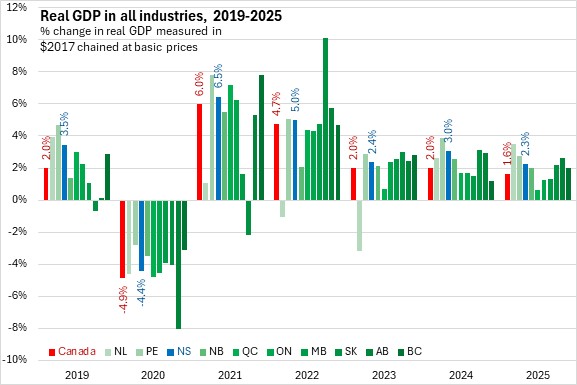
Nova Scotia's real GDP increased 2.3% in 2025. Nationally, real GDP grew by 1.6%. All provinces reported rising real GDP in 2025 with the fastest gain in Newfoundland and Labrador. Québec reported the slowest real GDP growth.
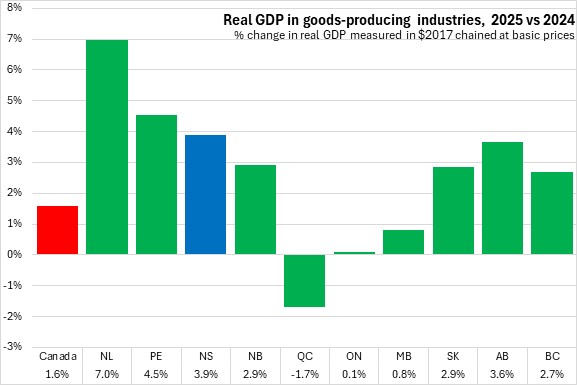
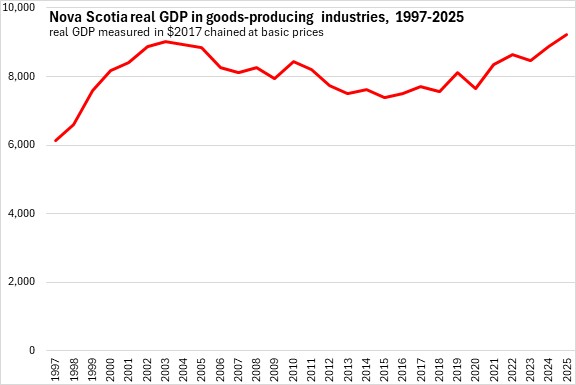
Real GDP from goods industries rose 3.9% in Nova Scotia in 2025. Real GDP from goods industries was up 1.6% nationally with gains in all provinces except Québec. Newfoundland and Labrador reported the fastest increase in real GDP from goods industries in 2025.
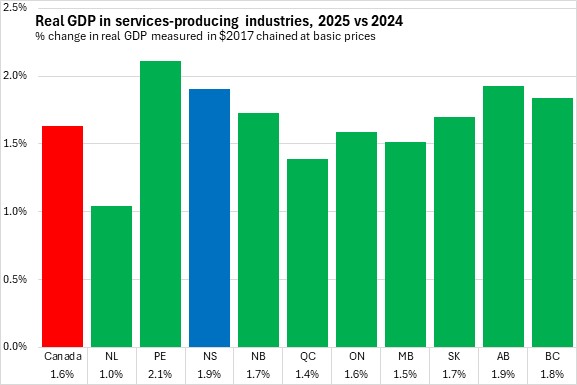
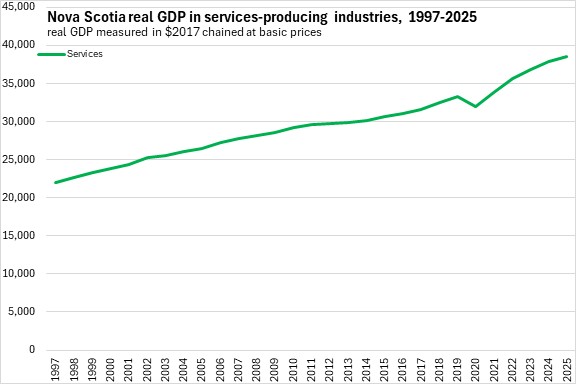
Nova Scotia's real GDP from services-producing industries was up 1.9% in 2025, tied with Alberta for second fastest growth (after Prince Edward Island). Real GDP from services-producing industries was up for every province, with a national increase of 1.6%. Newfoundland and Labrador reported the slowest real GDP growth from services-producing industries.
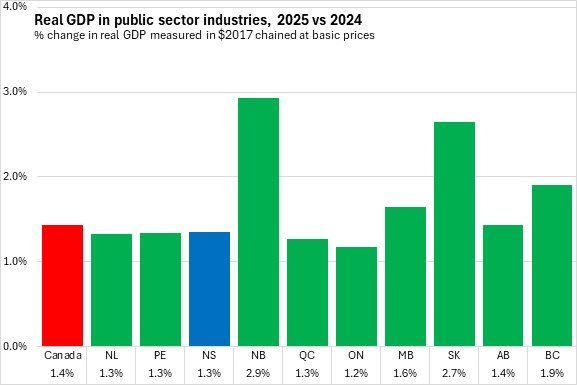
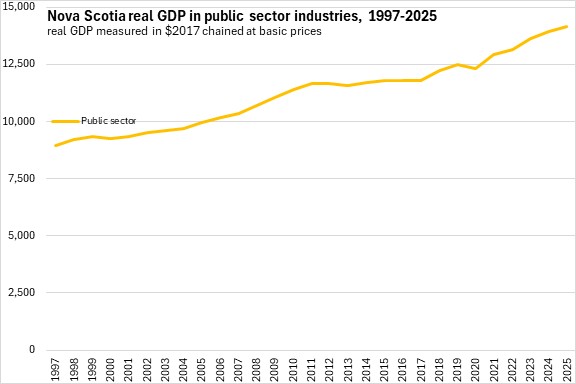
Nova Scotia's real GDP from public sector industries (which are a subcomponent of services-producing industries) was up 1.3% in 2025. Nationally, real GDP from the public sector increased by 1.4% with gains in all provinces. New Brunswick and Saskatchewan reported the fastest rise in real GDP from the public sector while Ontario reported the slowest gain.
Trends
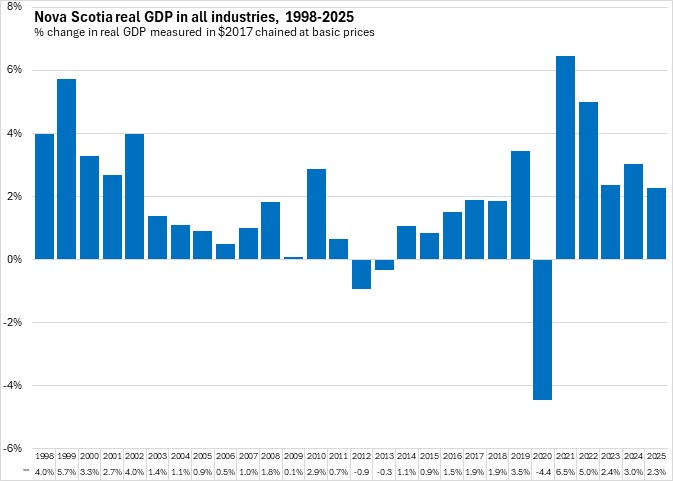
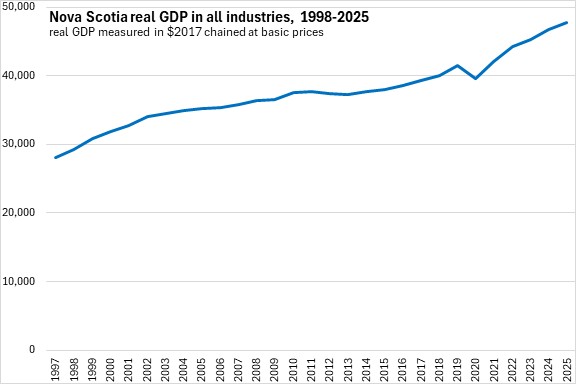
Nova Scotia's real GDP growth was distorted during the pandemic and recovery periods. Real GDP growth has normalized from 2023-2025.
Nova Scotia's real GDP growth in the last two years remains slightly above pre-pandemic trends.
Real GDP per capita
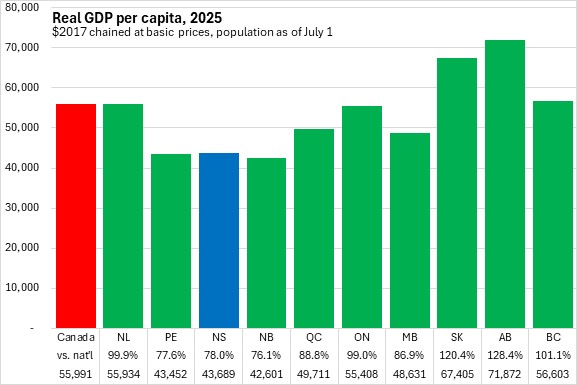
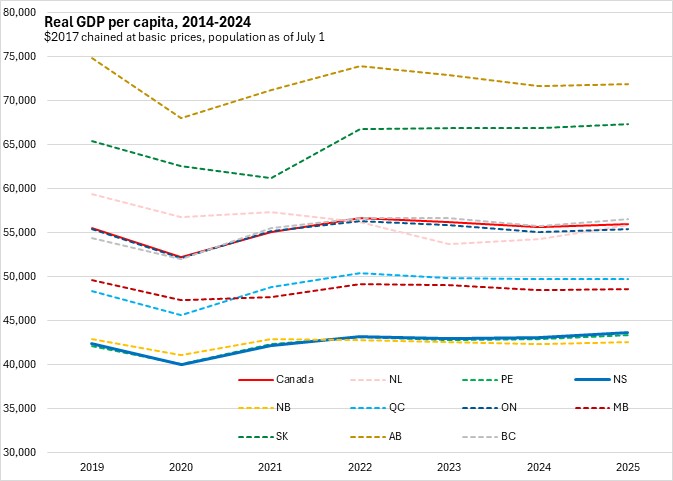
Nova Scotia has the third lowest real GDP per capita among provinces in 2025, about 78.0% of the national average. The Maritime provinces have the lowest real GDP per capita, followed by Manitoba and Québec. Saskatchewan and Alberta report the highest levels of real GDP per capita among provinces. Real GDP per capita is similar to the national average in Newfoundland and Labrador, Ontario and British Columbia.
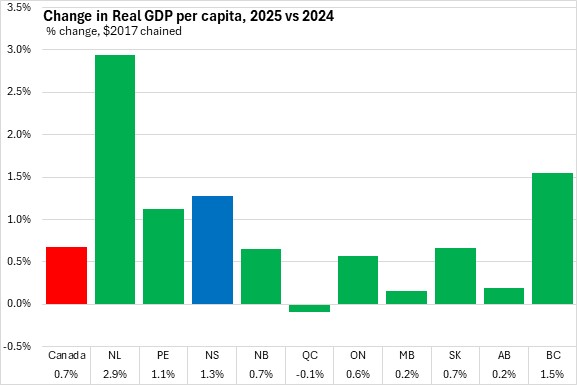
With real GDP growth outpacing slowing population gains, Nova Scotia's real GDP per capita grew 1.3% in 2025. All provinces except Québec reported growth in real GDP per capita. Nationally, real GDP per capita grew by 0.7%. Newfoundland and Labrador had the fastest increase in real GDP per capita in 2025.
Disparity in real GDP per capita have been persistent for many years with Alberta and Saskatchewan always reporting substantially higher real GDP per capita. Newfoundland and Labrador, Ontario and British Columbia all have real GDP very close to the national average. Manitoba and Québec report real GDP per capita values somewhat lower than the national average (87-89%) while the three Maritime provinces all report real GDP per capita substantially lower than the national average (<80%).
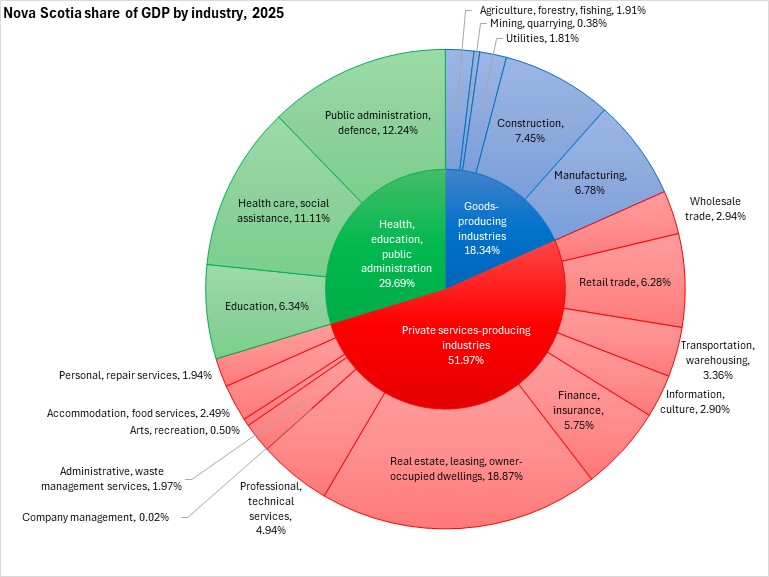
Nova Scotia GDP by industry
In 2025, goods production accounted for 18% of Nova Scotia's GDP while largely-private service producing industries accounted for 52% of Nova Scotia's GDP. Largely-public services (health, education, public administration) accounted just under 30% of Nova Scotia's GDP.
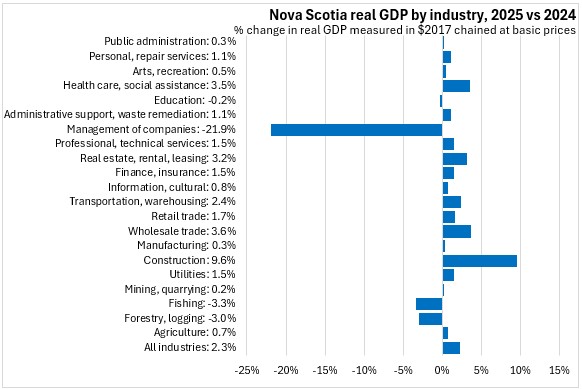
The fastest growing industry in Nova Scotia's economy in 2025 was construction. There were declines in forestry/logging, fishing, company management (a small industry) and education.

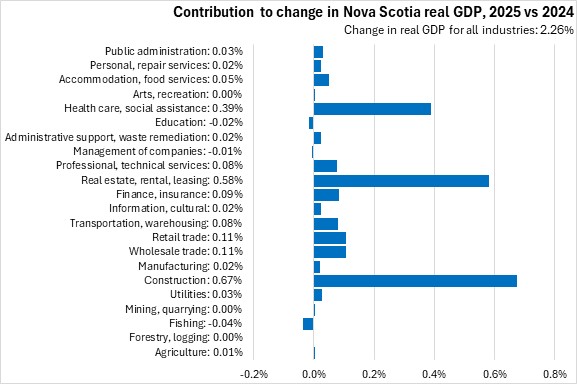
Based on size as well as change, construction, real estate (including imputed rental GDP from owner-occupied dwellings) and health care/social assistance made the largest positive contribution to Nova Scotia's real GDP growth in 2025.
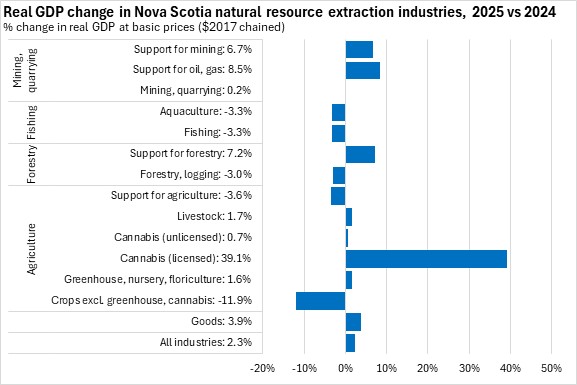
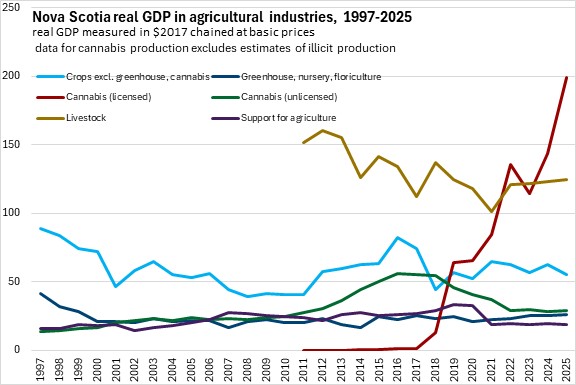
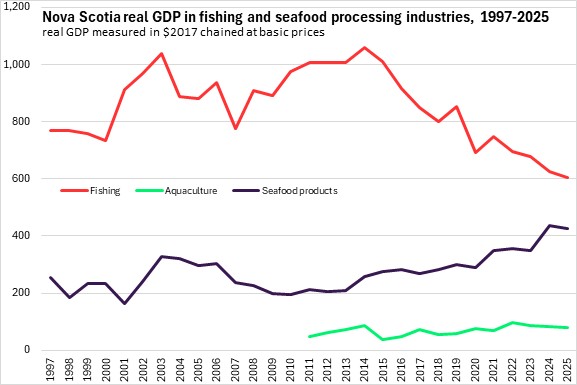
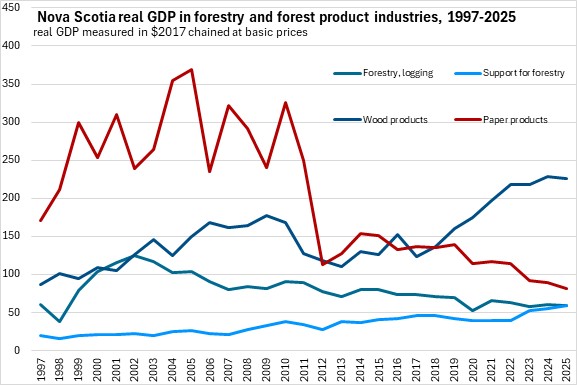
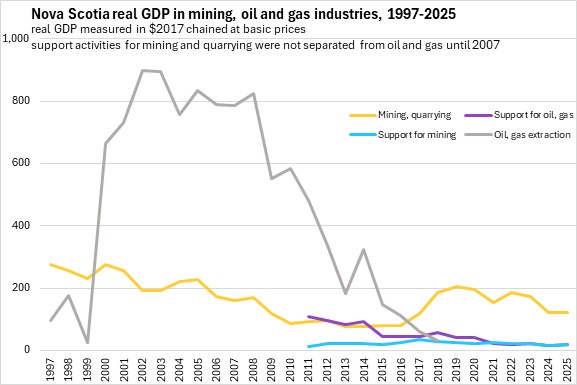
Real GDP in agriculture increased substantially for licensed cannabis growers, while other crops (excluding greenhouse and floriculture) reported declining real GDP. Although forestry and logging real GDP decreased, there was a rise in support activities for forestry (such as silviculture). Both fishing and aquaculture reported lower real GDP in 2025. Mining and quarrying real GDP was little changed, though there were increases in associated support activity real GDP.
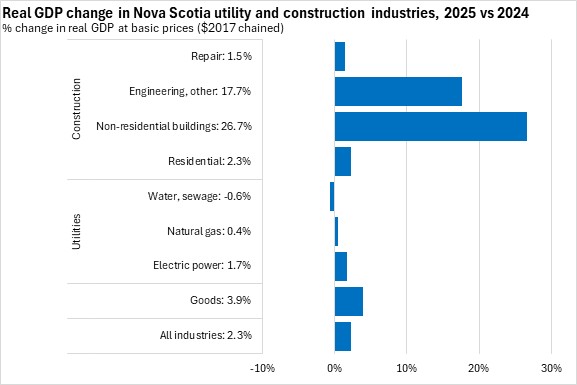
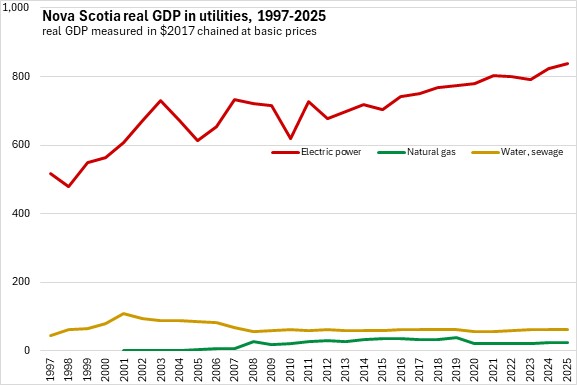
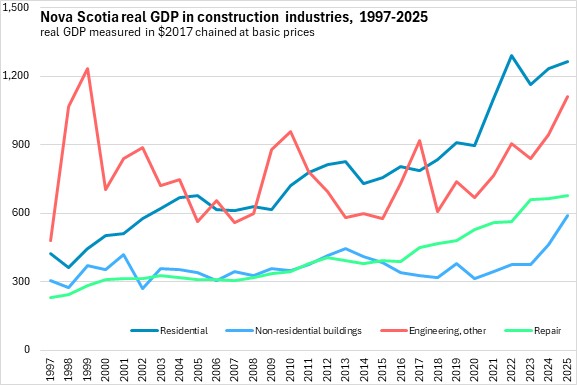
Nova Scotia's utilities real GDP was up for electric power and natural gas while water/sewage real GDP contracted. GDP was up among all construction industries, with the strongest growth in non-residential building construction as well in engineering construction.
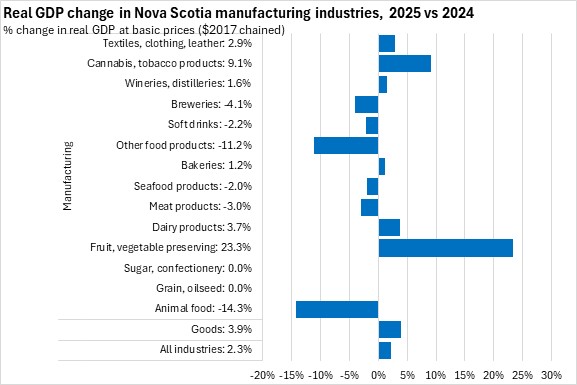
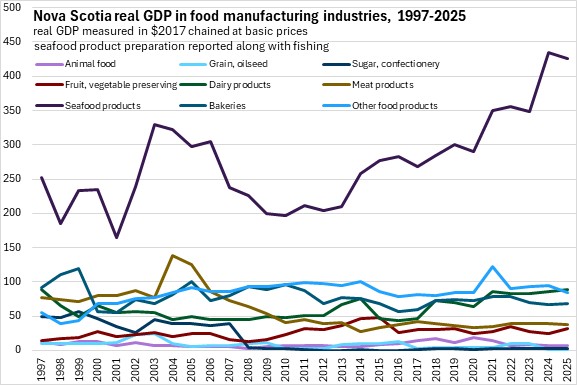
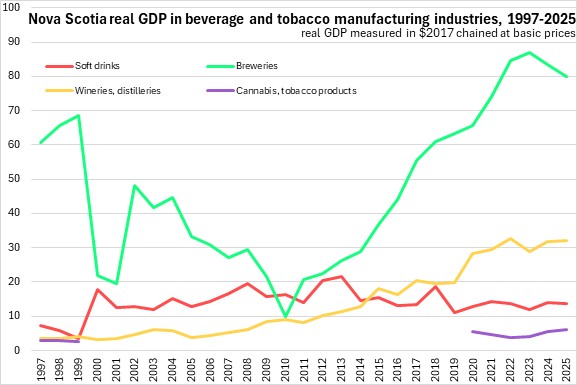
Real GDP was down in 2025 for some of Nova Scotia's food and beverage manufacturing industries (animal food, meat, seafood, other food products). There were notable gains in manufacturing real GDP from fruit/vegetable preservation and cannabis products.
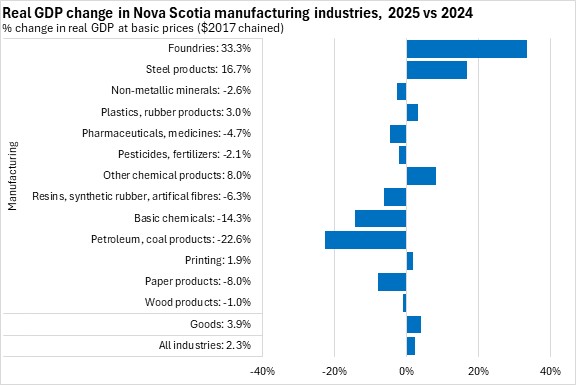
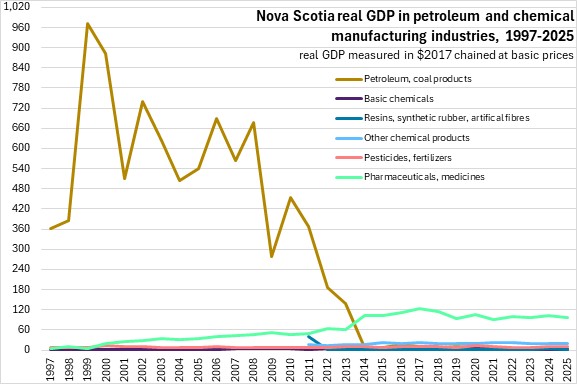
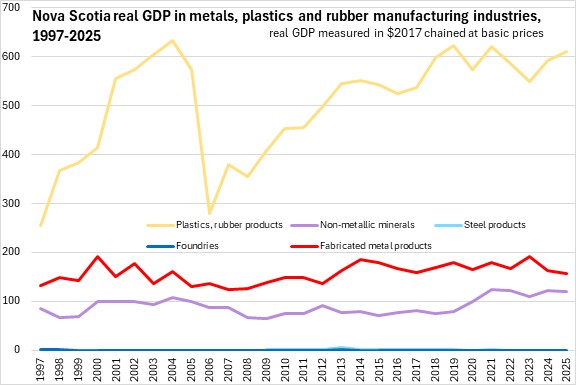
Plastic/rubber products, foundries and steel product manufacturing real GDP increased in Nova Scotia in 2025 while there were declines in real GDP from chemicals, pharmaceuticals, non-metallic mineral products and petroleum/coal products. Real GDP was down for both wood and paper products.
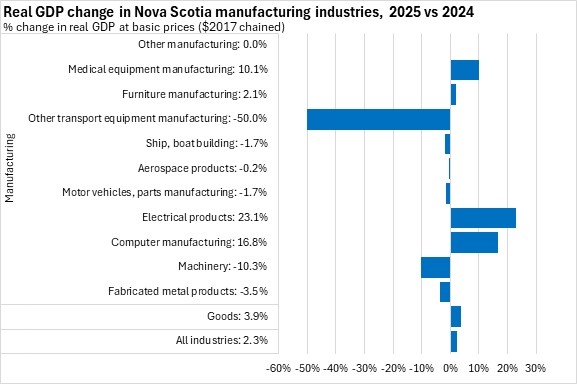
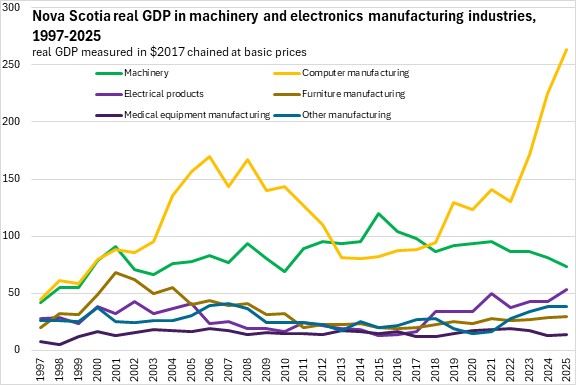
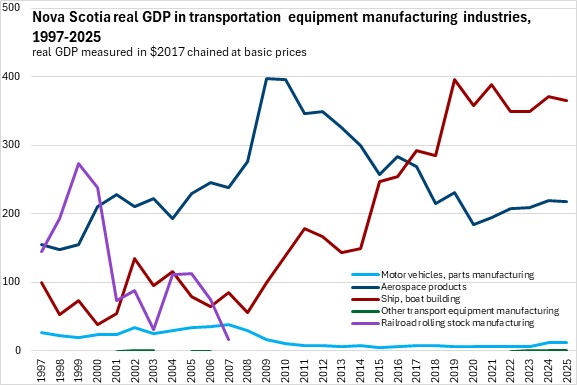
Real GDP was down for all of Nova Scotia's transportation equipment manufacturing subsectors as well as from machinery and fabricated metal products. There were increases in real GDP from medical equipment manufacturing, furniture manufacturing, computer manufacturing and electrical products manufacturing.
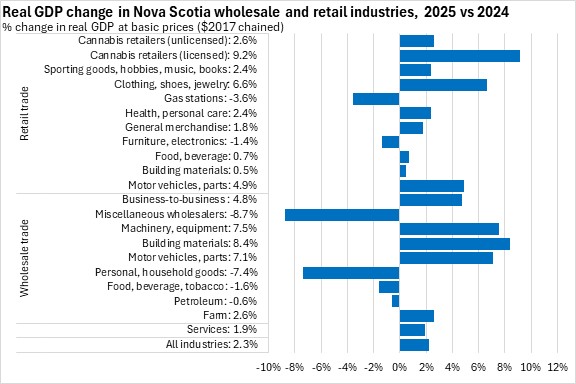
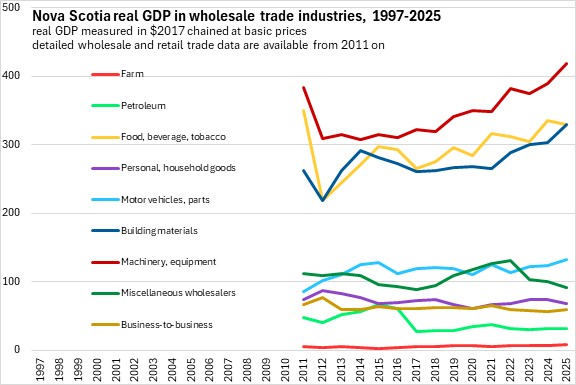
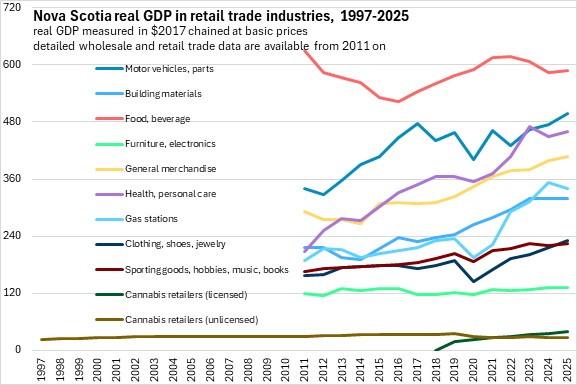
Some wholesale subsectors reported real GDP declines in 2025, with the steepest drops in personal/household goods and miscellaneous wholesalers. There were strong increases in real GDP from machinery, building materials and motor vehicles/parts wholesalers. Retail trade real GDP was up for all categories except gas stations and furniture/electronics stores. There was notably faster growth in real GDP for licensed cannabis retailers as well as for clothing/shoe/jewelry stores.
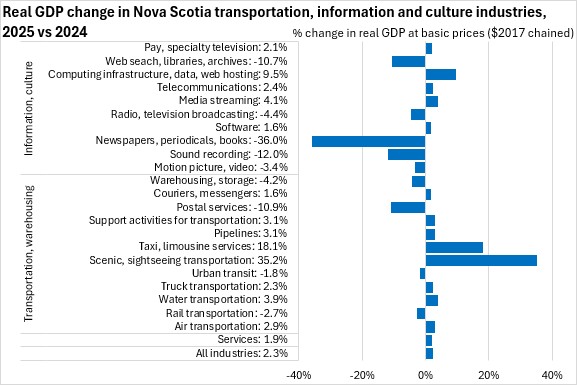
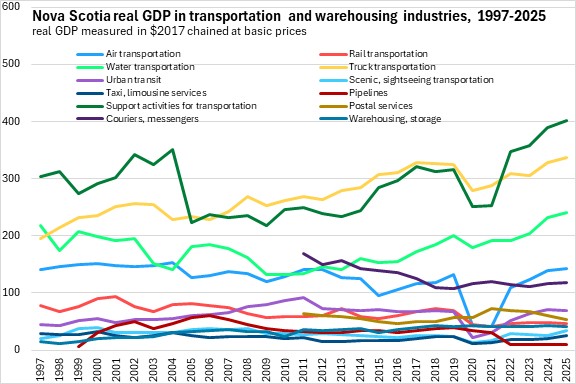
In transportation and warehousing, there were real GDP gains for all subsectors except rail, warehousing, urban transit and postal services. Sightseeing and taxi transportation reported stronger gains in real GDP in 2025.
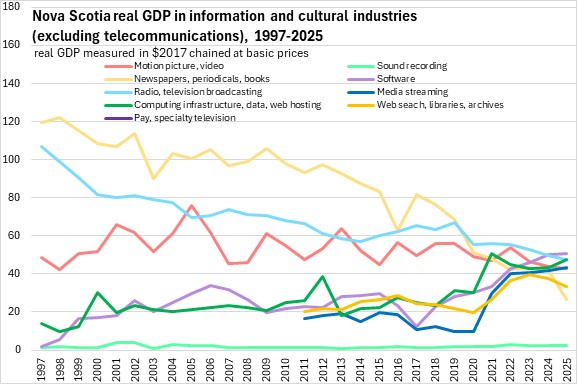
In information/culture industries, newspaper/periodical/books publishers, sound recording, motion picture/video (including exhibition), radio/television broadcasting and web search/libraries/archives all posted lower real GDP in 2025. Computing infrastructure real GDP increased.
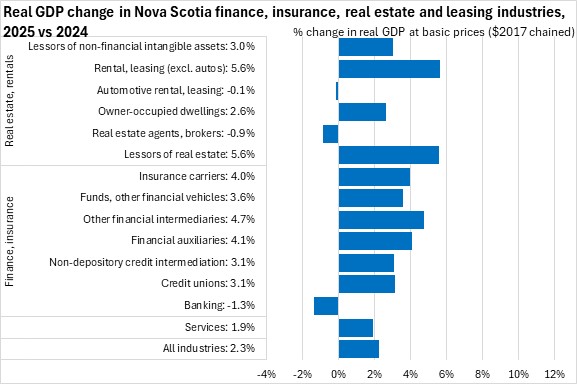
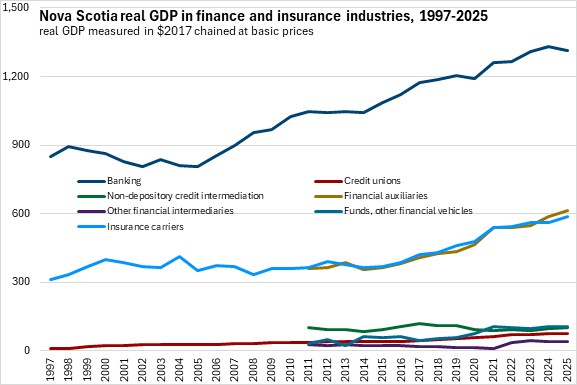
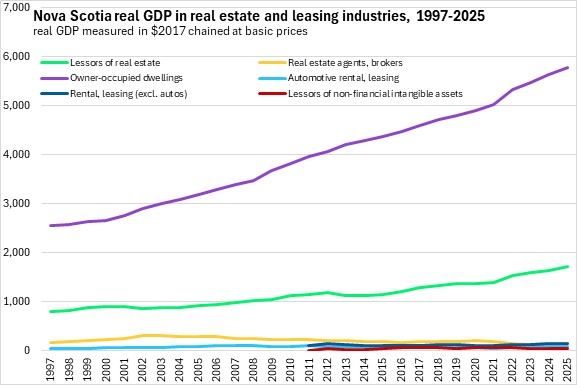
Most finance and insurance industries in Nova Scotia posted gains in real GDP 2025, with the notable exception of banking. In real estate, rentals and leasing, there were substantial gains for lessors of real estate and other (non-auto) rentals and leasing. Real GDP from owner-occupied dwellings (an imputed value) was also up. There were declines in real GDP from auto leasing as well as from offices of real estate agents/brokers.
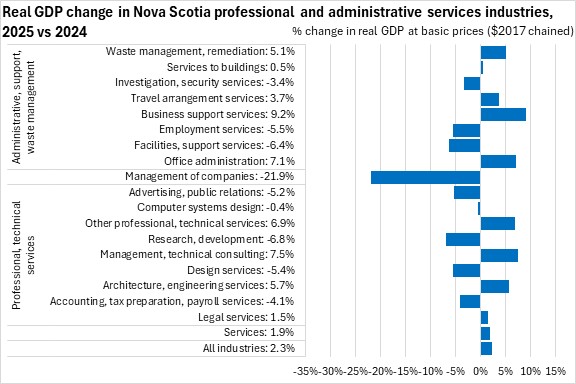
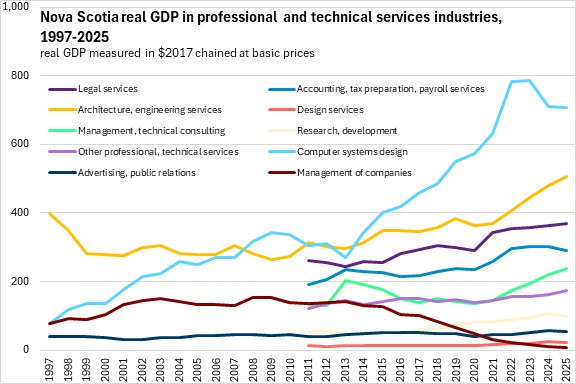
Real GDP from company management posted a substantial decline in 2025 (though this industry is very small and changes includes reclassification of activities into different industries).
Among professional services, there was notable real GDP growth for architecture/engineering, management/technical consulting and other professional services. These were offset by real GDP declines in advertising/public relations, computer systems design, scientific research/development, specialized design services and accounting/tax preparation/payroll services.
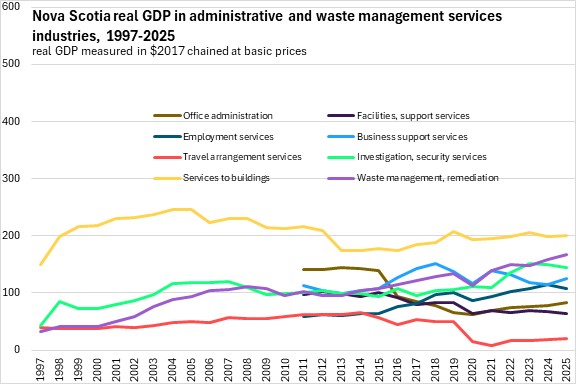
In administrative/support industries (which includes call centres) there was growth in real GDP from travel arrangements, office administration, business support and waste management/remediation. Real GDP declined in 2025 for facilities/support services, employment services and investigation/security services.
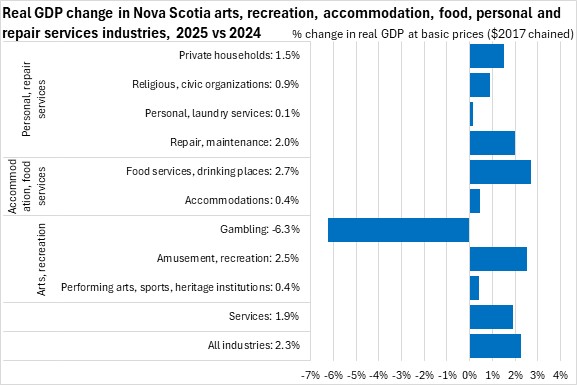
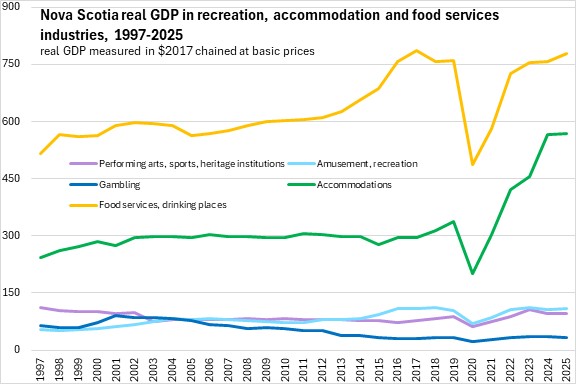
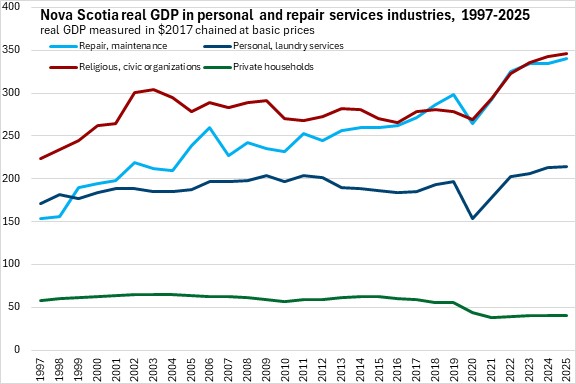
Real GDP contracted sharply in gambling industries in the arts/recreation industries while there were gains in real GDP from all other categories of arts/recreation, accommodation/food services and personal/repair services.
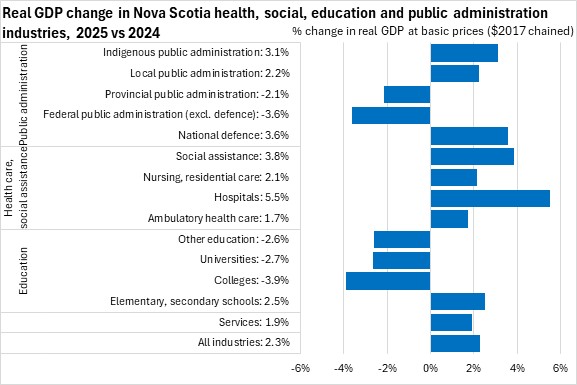
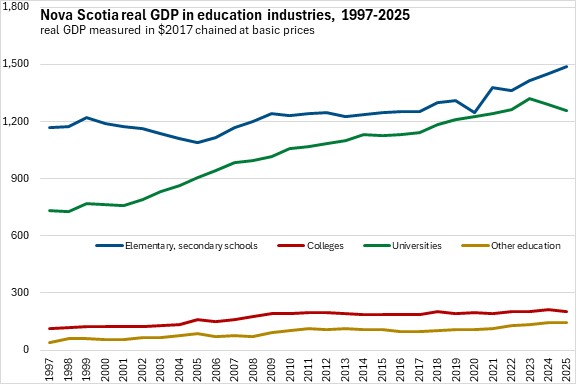
In education industries, only elementary/secondary schools reported higher real GDP. All subsectors of health care and social assistance reported rising real GDP in 2025. In public administration, real GDP declined for both the Federal government (non-defence) and the Provincial government. Real GDP was up from national defence, local government and Indigenous government.
Trends in Nova Scotia real GDP by industry
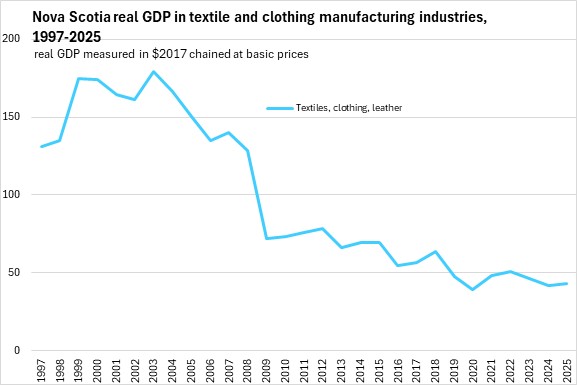
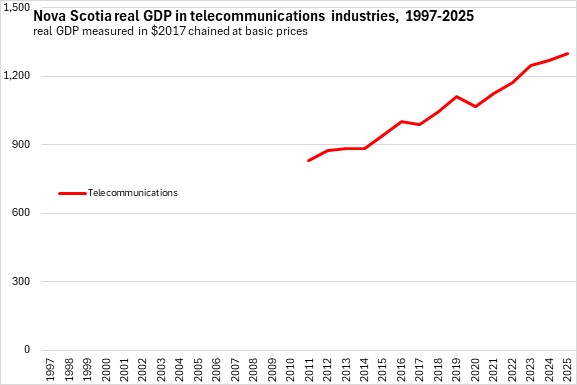
In the 28 years of data from 1997 to 2025, there have been notable changes in the real GDP generated by specific industries. These charts show the value of real GDP from 1997-2025 for most industries in the Nova Scotia economy. Real GDP is measured in 2017 (chained) dollars at basic prices. Changes in the level of real GDP for each industry indicate how its real output has changed, absent the effects of changes in output prices.
Nova Scotia's real GDP grew more rapidly from 1997-2002 as new production facilities (natural gas, supercalendered paper) were built and brought into production. Real GDP growth slowed, but remained largely positive from 2002-2011. In 2012 and 2013, Nova Scotia's real GDP contracted with industrial closures in forest products and petroleum refining as well as reductions in real GDP from the Federal government. Growth started to accelerate again from 2014 to 2019 before the contractions of the first waves of COVID-19 in 2020. Nova Scotia's real GDP rebounded quickly from the COVID recession of 2020 with stronger growth in both 2021 and 2022 before slowing from 2023 to 2025.
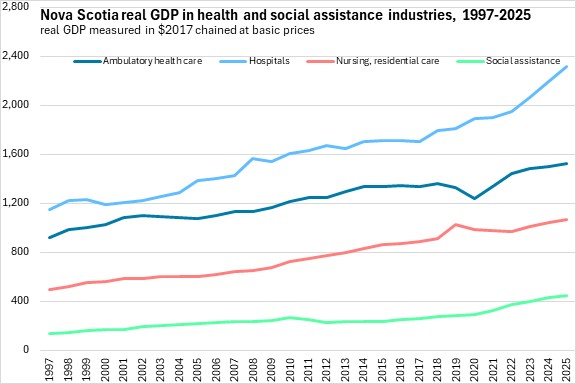
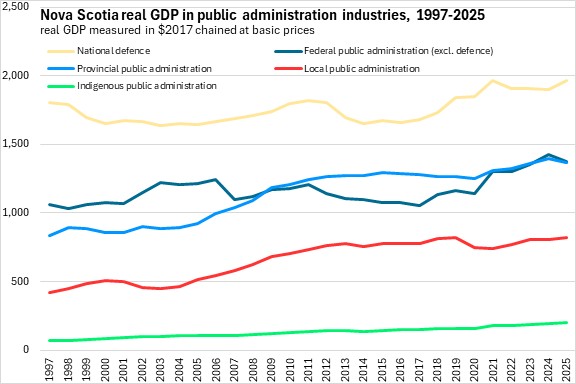

Source: Statistics Canada. Table 36-10-0711-01 Gross domestic product (GDP) at basic prices, by industry, provinces and territories (x 1,000,000); Table 36-10-0400-01 Gross domestic product (GDP) at basic prices, by industry, provinces and territories, percentage share
<--- Return to Archive


