The Economics and Statistics Division maintains archives of previous publications for accountability purposes, but makes no updates to keep these documents current with the latest data revisions from Statistics Canada. As a result, information in older documents may not be accurate. Please exercise caution when referring to older documents. For the latest information and historical data, please contact the individual listed to the right.
<--- Return to Archive
For additional information relating to this article, please contact:
February 15, 2018EMPLOYMENT INSURANCE, DECEMBER AND ANNUAL 2017 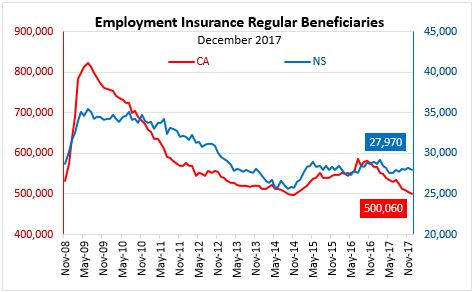
In December 2017, the number (seasonally adjusted) of Nova Scotians receiving regular Employment Insurance (EI) benefits decreased by 250 persons (-0.9 per cent) from the previous month to 27,970 and decreased by 1,020 persons (-3.5 per cent) from December 2016.
Following an increase through much of 2016, the number of EI beneficiaries in Nova Scotia declined until the middle of 2017 and has been relatively flat since. Looking at the longer-term trends, the number of beneficiaries has been relatively stable since 2015 after reaching historic lows in 2014.
The number (seasonally adjusted) of Canadians receiving regular EI benefits in December 2017 decreased 1.1 per cent (5,470 persons) from the previous month to 500,060. The number of regular EI beneficiaries decreased by 67,500 (-11.9 per cent) from December 2016.
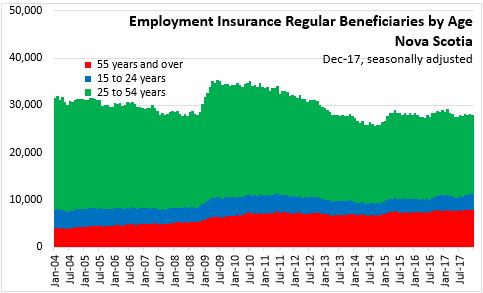
AGE
The bulk of EI beneficiaries in Nova Scotia are aged 25 to 54, who also account for the largest share of the labour force. In the December results, the number of beneficiaries aged 25-54 was down 210 while the number of beneficiaries aged 55 and older was down 80. The number of beneficiaries aged 15-24 was up 140 in December.
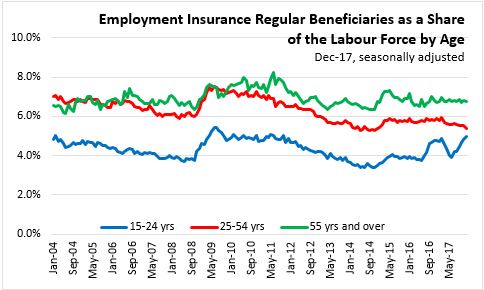
Measured as a share of the labour force, EI usage is more prevalent among older workers (6.8 per cent) than it is among youth (5.0 per cent) or core aged workers (5.4 per cent).
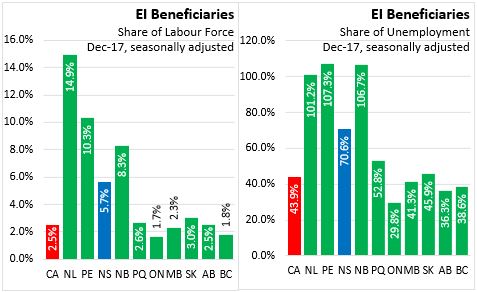
EI BENEFICIARIES AS A SHARE OF THE UNEMPLOYED BY PROVINCE
The number (seasonally adjusted) of Nova Scotians receiving regular EI benefits in December 2017 accounted for 5.7 per cent of the total labour force. In Canada, the number of EI beneficiaries accounted for 2.5 per cent of the total labour force.
In Nova Scotia, EI beneficiaries accounted for 70.6 per cent of the unemployed, compared to a Canadian rate of 43.9 per cent. Across the country, EI beneficiaries accounted for the highest shares of the unemployed in the Atlantic provinces, led by PEI, followed by New Brunswick and Newfoundland and Labrador. EI beneficiaries accounted for the lowest shares of the unemployed in Ontario, followed by Alberta and British Columbia.
Note that due to differences in estimation methodology, it is possible for the reported number of EI beneficiaries to exceed the reported number of unemployed in a given jurisdiction.
ANNUAL
PROVINCES
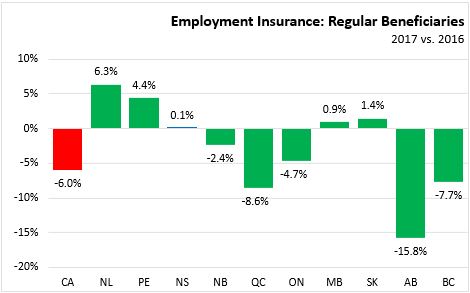
Across the country, average annual EI usage (seasonally adjusted) is down 6.0 per cent in 2017 compared to 2016. The largest declines in EI usage were reported in Alberta, British Columbia and Quebec. Newfoundland and Labrador, PEI, Nova Scotia, Manitoba and Saskatchewan all reported higher EI usage than in 2016. Nova Scotia's EI usage is up 0.1 per cent in 2017 compared to 2016.
COUNTIES
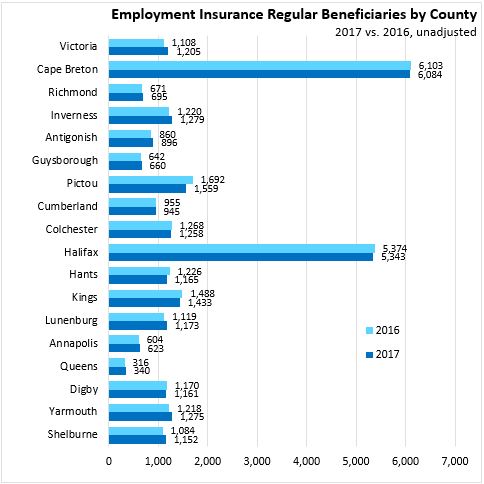
In 2017, average EI usage (unadjusted) was up in ten counties. Decreases were seen in Digby, Kings, Hants, Halifax, Colchester, Cumberland, Pictou, and Cape Breton. Largest declines in percentage terms were in Pictou (-7.8%) and Hants (-5.0%).
OCCUPATION
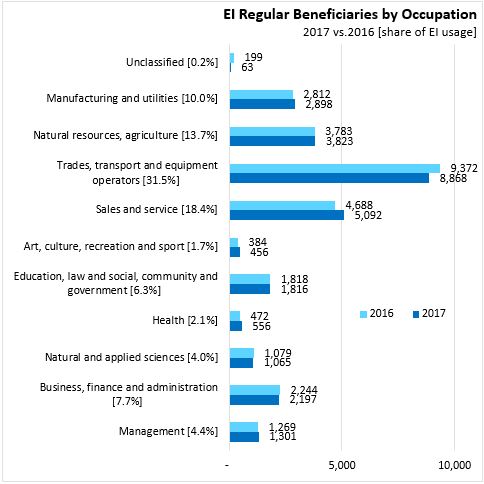
Nova Scotia's EI usage by occupation (unadjusted) is highest among trades/transport/equipment operators, but the annual average usage is down for this sector when compared with 2016. Average annual usage is up for the next three largest occupational categories: sales and service, natural resources/agriculture and manufacturing/utilities. Usage is also up in management and health care. Proportionally, the largest rise in EI usage is in occupations related to art/culture/recreation/sport, though this is a relatively small share of overall EI usage. Usage is down (marginally) in natural/applied sciences and business/finance/administration.
Legislative changes to the EI program came into effect in July 2016. While some of these changes affected all EI regions across Canada, eligible claimants in the 15 regions that posted notable increases in unemployment received additional weeks of regular benefits starting in July. More information on the 2016 EI changes is available on Employment and Social Development Canada's (ESDC) website. As a result of the changes to the EI program, historical comparisons are not recommended, except in areas outside of the 15 EI regions where eligible claimants received additional weeks of benefits. These 15 EI regions are Newfoundland and Labrador, Northern Ontario, Sudbury, Northern Manitoba, Southern Saskatchewan, Northern Saskatchewan, Saskatoon, Southern Alberta, Northern Alberta, Calgary, Edmonton, Southern Interior British Columbia, Northern British Columbia, Whitehorse and Nunavut.
Statistics Canada CANSIM 276-0022 (Age, Province), 276-0043 (Occupation), 276-0035 (County level)
<--- Return to Archive