The Economics and Statistics Division maintains archives of previous publications for accountability purposes, but makes no updates to keep these documents current with the latest data revisions from Statistics Canada. As a result, information in older documents may not be accurate. Please exercise caution when referring to older documents. For the latest information and historical data, please contact the individual listed to the right.
<--- Return to Archive
For additional information relating to this article, please contact:
March 14, 2018NEW MOTOR VEHICLE SALES, JANUARY 2018 YEAR-TO-DATE: JANUARY 2018 vs. JANUARY 2017
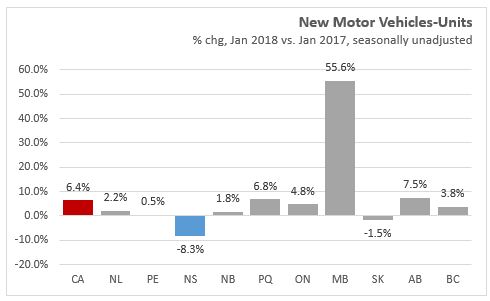
In January 2018, Nova Scotia motor vehicle unit sales decreased 8.3 per cent over January 2017. The 2,671 new vehicles sold in January 2018 represented a value of $96.9 million, down 14.4 per cent compared with motor vehicle sales values in January 2017. In Canada, the number of units increased 6.4 per cent and value increased 10.2 per cent compared to the previous January.

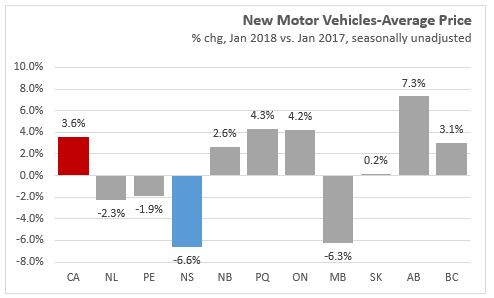
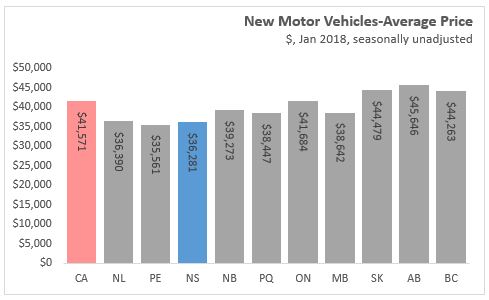
The average unit price of a new motor vehicle was lower by 6.6 per cent to $36,281 in Nova Scotia in January 2018. Canada's average price increased 3.6 per cent to $41,571.
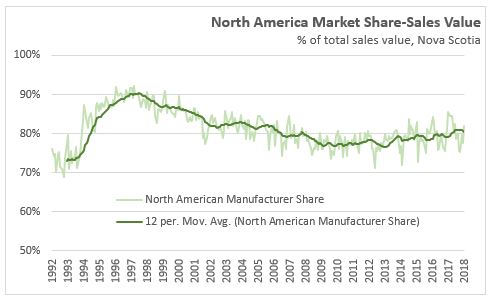
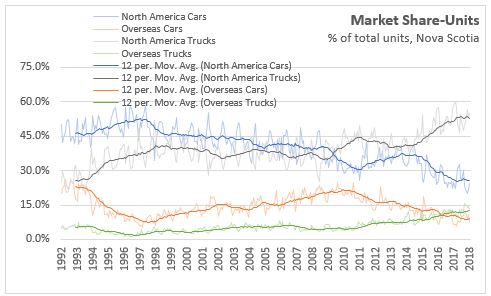
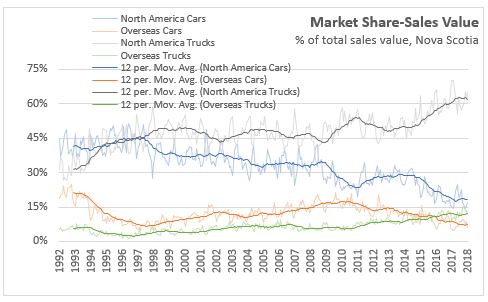
MARKET SHARE TRENDS: ORIGIN OF MANUFACTURER
New motor vehicles from North American manufacturers account for around 80 per cent of units and sales value in Nova Scotia market. North American manufactures previously had around 90 per cent of sales in the late 1990s, but saw a gradually decline in market share until 2009. From 2010 to 2017, the share of sales to North American manufacturers increased from 77 per cent to 81 per cent.

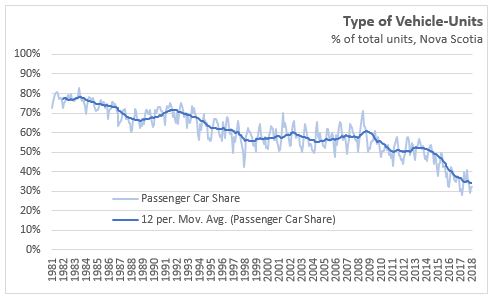
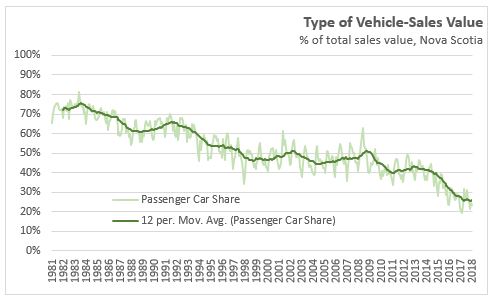
MARKET SHARE TRENDS: TYPE OF VEHICLE
Passenger cars continue to make up a smaller share of new motor vehicle purchases in Nova Scotia. As a share of unit sales, passenger cars declined steadily from 77 per cent in 1981 to around 50 per cent in 2014, before falling to be only 34 per cent of unit purchases in 2017. In terms of sales value, passenger cars now account for less than 30 per cent of total sales.

MARKET SHARE TRENDS: RELATIVE PRICE
The ratio of new motor vehicle prices between North American and overseas manufacturers was mostly steady from 1992 through 2004 with North American vehicles selling for around 10 per cent more per unit. The price ratio fell from 2010 to 2014 before climing back to over 110 per cent in 2017. The relative price of trucks compared to passenger cars has remained stable at around 150 per cent over the past 20 years.
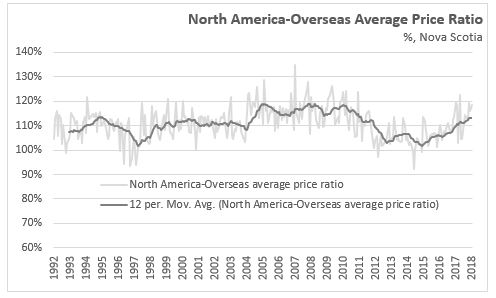
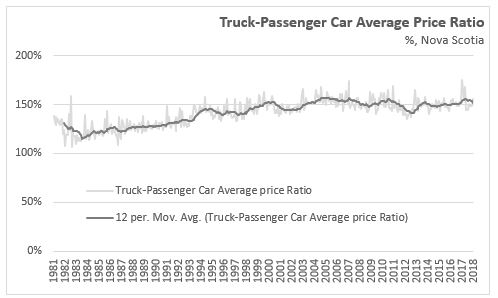
For passenger cars, the relative price between North American and overseas manufacturers rose from 97 per cent in 1992 to around 105 per cent in 2008. Since 2010, overseas passenger cars have sold for less than North American cars with the price ratio moving below 90 per cent in recent years. North American and overseas average truck prices were generally similar at around 100 per cent from 1998 through 2012, the North American price would occasional rise above the oversea price for a period of time before the prices moved back to parity. Since 2012, the average unit price for North American manufacturers' trucks have increased relative to overseas’ manufacturers truck prices, resulting in around a 20 per cent higher average unit price in 2017.


Note: New motor vehicle data for British Columbia includes sales in the territories.
Statistics Canada, CANSIM table 079-0003
<--- Return to Archive