The Economics and Statistics Division maintains archives of previous publications for accountability purposes, but makes no updates to keep these documents current with the latest data revisions from Statistics Canada. As a result, information in older documents may not be accurate. Please exercise caution when referring to older documents. For the latest information and historical data, please contact the individual listed to the right.
<--- Return to Archive
For additional information relating to this article, please contact:
September 18, 2018MANUFACTURING SHIPMENTS, JULY 2018 Nova Scotia
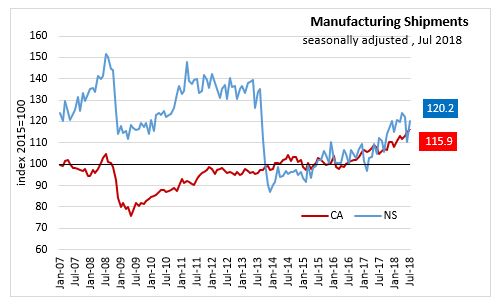
In Nova Scotia July 2018, seasonally adjusted Manufacturing Shipments increased 8.7% to $772.2 million over June 2018, and increased 7.1% over July 2017.
Unadjusted year-to-date (Jan-July 2018), Manufacturing Shipments increased 13.8% ($638.1 million) over the same period last year.
- Non-durable goods shipments , accounting for 70% of Manufacturing Shipments , increased 19.4% ($598.9 million),
- Food with a 30% share increased 14.5% ($198.2 million),
- Plastic and rubber products with a 22% share increased 26.2% ($245.0 million).
- Durable manufacturing, accounting for 30% of Manufacturing Shipments , increased 2.6% ($39.2 million)
- Wood product with a 5% share increased 4.6% ($12.8 million)
- Fabricated metal with a 3% share decreased 2.0% (-$3.7 million)
- Machinery with a 2% share increased 21.7% ($19.3 million)
- Computer & electronic with a 1% share decreased 6.8% (-$5.7 million)
- Transportation equipment with a 13% share decreased 0.6% (-$4.2 million)
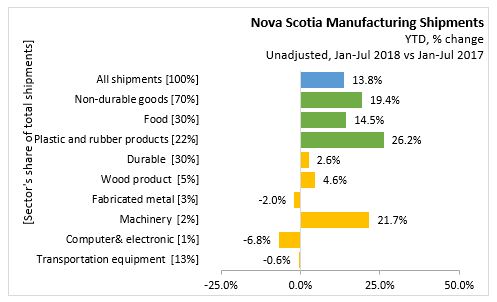
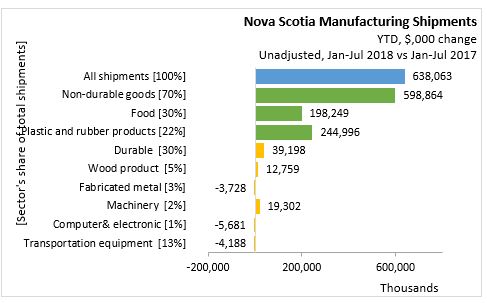
Note: Computer and Electronic is Jan-June YTD comparison, as July 2018 figures are suppressed.
CANADA
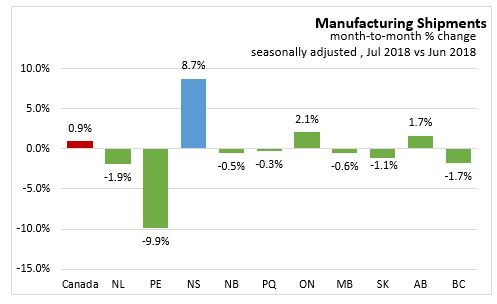
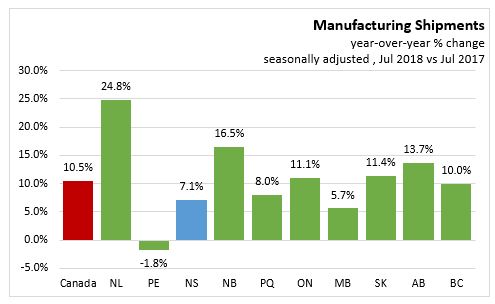
In Canada July 2018, seasonally adjusted Manufacturing Shipments increased 0.9% to $58.6 billion over June 2018, and increased 10.5% over July 2017.
Compared to June 2018, overall sales increased in 1 of 21 industries representing 81% of all manufacturing sectors (unadjusted).
Higher sales in the Ontario transportation equipment industry were mainly responsible for gains at the national level in July. Declines in British Columbia partially offset the increase in the primary metals and wood product industries.
Month to month, non-durable goods rose 1.4% to $27.7 billion, while durable goods increased 0.5% to $30.9 billion.
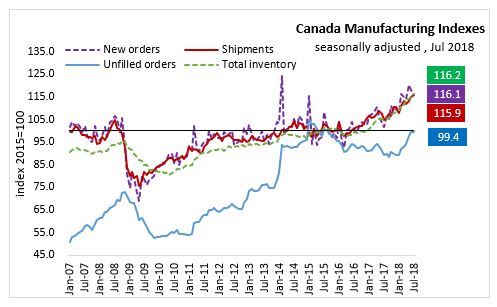
Inventory levels increased 1.2% to $82.9 billion in July. The gains were led by higher inventories in the machinery (+3.0%) and the petroleum and coal product (+3.5%) industries.
The inventory-to-sales ratio was unchanged at 1.41 in July.
Unfilled orders were unchanged at $94.4 billion in July, following five consecutive monthly gains. The largest increase in unfilled orders was posted by the motor vehicle industry, followed by the electrical equipment, appliance
and component industry.
New orders decreased for a second consecutive month, down 1.8% to $58.6 billion in July, reflecting lower new orders in aerospace and machinery industries.
PROVINCES
On a seasonally adjusted, month-over-month basis, Manufacturing sales increased in 3 provinces in July 2018 over June 2018.
Nova Scotia had the largest growth at 8.7 per cent, while Prince Edward Island had the sharpest decline at 9.9 per cent.
On a seasonally adjusted year-over-year basis, manufacturing shipments are up 10.5% in Canada, with nine provinces recording positive year-over-year growth.
Manufacturing shipments were 24.8% higher in Newfoundland Labrador over July 2017. Prince Edward Island manufacturing shipments are down 1.8%. Nova Scotia shipments increased 7.1% over July 2017.
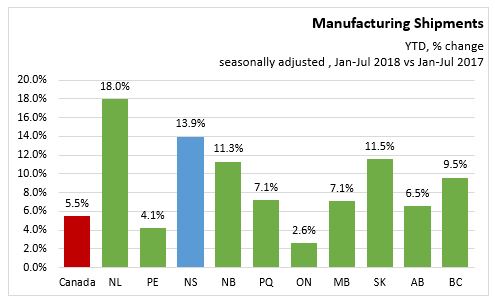
On a seasonally adjusted, year-to-date basis, manufacturing shipments growth was positive in all provinces.
Canada reported +5.5% growth compared with the first seven months of 2017. The largest gains was reported in Newfoundland and Labrador (18.0%) and Ontario reported the lowest seven-month increase (2.6%). Nova Scotia seasonally adjusted year-to-date growth was 13.9% over Jan-July 2017.
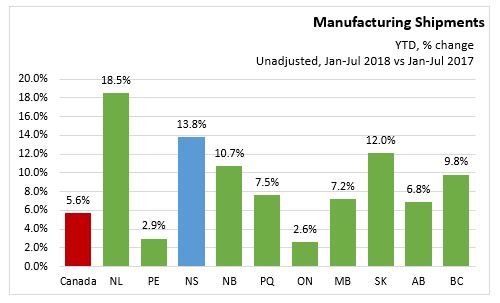
YEAR-TO-DATE UNADJUST DATA
On an unadjusted year-to-date basis, manufacturing shipments growth was positive in all provinces. Canada reported +5.6% growth and Nova Scotia was up 13.8 per cent. Newfoundland and Labrador recorded the greatest increase (18.5%) and Ontario the lowest year-to-date increase (2.6%) over Jan-July 2017.
SOURCES
Statistics Canada Monthly survey of Manufacturing, July 2018
Table 16-10-0047-01 Manufacturers' sales, inventories, orders and inventory to sales ratios, by industry (dollars unless otherwise noted)
Table 16-10-0048-01 Manufacturing sales by industry and province, monthly (dollars unless otherwise noted) (x 1,000)
<--- Return to Archive