The Economics and Statistics Division maintains archives of previous publications for accountability purposes, but makes no updates to keep these documents current with the latest data revisions from Statistics Canada. As a result, information in older documents may not be accurate. Please exercise caution when referring to older documents. For the latest information and historical data, please contact the individual listed to the right.
<--- Return to Archive
For additional information relating to this article, please contact:
October 17, 2018MANUFACTURING SHIPMENTS, AUGUST 2018 Nova Scotia
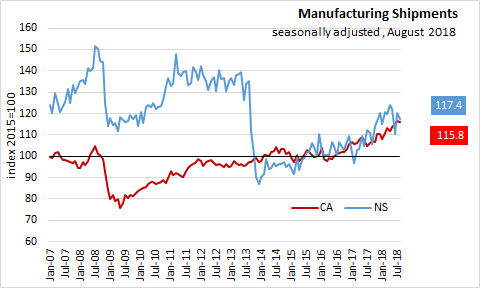
In Nova Scotia August 2018, seasonally adjusted Manufacturing Shipments decreased 2.3% to $754.3 million over July 2018 and increased 5.9% over August 2017.
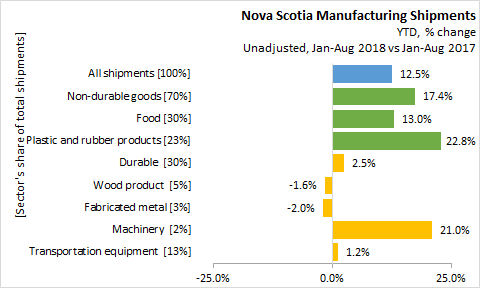
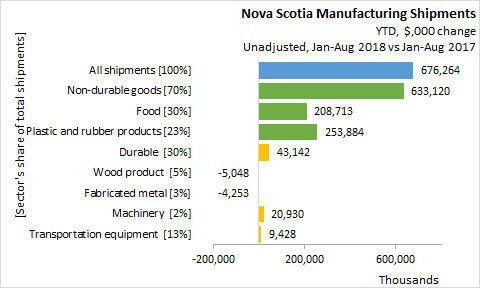
Unadjusted year-to-date (Jan-Aug 2018), Manufacturing Shipments increased 12.5% ($676.3 million) over the same period last year.
- Non-durable goods shipments, accounting for 70% of Manufacturing Shipments, increased 17.4% ($633.1 million),
- Food with a 30% share increased 13.0% ($208.7 million),
- Plastic and rubber products with a 23% share increased 22.8% ($253.9 million).
- Durable manufacturing, accounting for 30% of Manufacturing Shipments, increased 2.5% ($43.1 million).
- Wood product with a 5% share decreased 1.6% (-$5.0 million).
- Fabricated metal with a 3% share decreased 2.0% (-$4.3 million).
- Machinery with a 2% share increased 21.0% ($20.9 million).
- Transportation equipment with a 13% share increased 1.2% ($9.4 million).
CANADA
In Canada August 2018, seasonally adjusted Manufacturing Shipments decreased 0.4% to $58.6 billion over July 2018 and increased 9.0% over August 2017.
Compared to July 2018, overall sales decreased in 7 of 21 industries representing 50.9% of all manufacturing sectors.
Durable goods decreased 1.2% to $30.6 billion over July 2018 and increased 6.2% over August 2017.
Non-durable goods increased 0.5% to $28.0 billion over July 2018 and increased 12.2% over August 2017.

Inventory levels increased with 1.1% growth in August 2018 to $83.9 billion.
The inventory to sales ratio increased from 1.41 to 1.43.
Unfilled orders increased 0.8% to $94.8 billion mostly due to aerospace product and parts industry.
New orders increased 1.1% to $59.3 billion.
PROVINCES
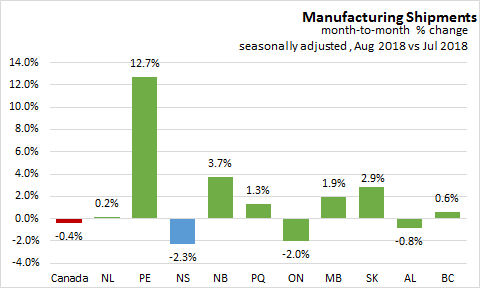
On a seasonally adjusted, month-over-month basis, Manufacturing sales increased in 7 provinces in August 2018 over July 2018. Prince Edward Island had the largest growth at 12.7% Nova Scotia shipments decreased -2.3%. In Canada shipments decreased -0.4%.
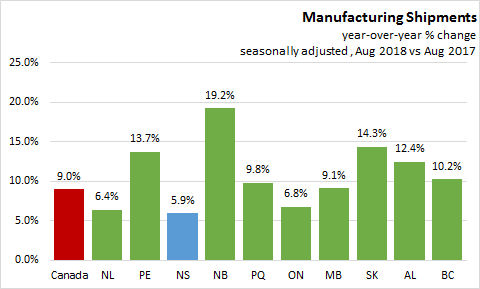
On a seasonally adjusted year-over-year basis, Manufacturing sales increased in all provinces in August 2018 over August 2017. New Brunswick had the largest growth at 19.2%. Nova Scotia shipments ncreased 5.9%. In Canada shipments increased 9.0%.
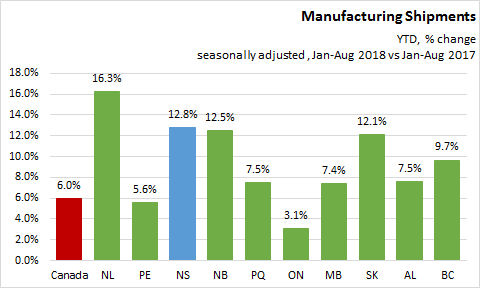
On a seasonally adjusted, year-to-date basis, manufacturing shipments growth was positive in all provinces in Jan-Aug 2018. Newfoundland and Labrador had the largest growth at 16.3%. Ontario shipments grew only increased 3.1%. Nova Scotia shipments increased 12.8%. In Canada shipments increased 6.0%.
YEAR-TO-DATE UNADJUSTED DATA
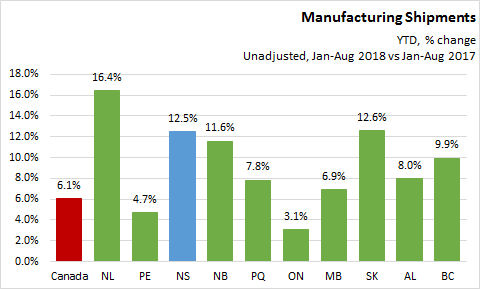
On an unadjusted year-to-date basis, manufacturing shipments growth was positive in all provinces. In Canada shipments increased 6.1%. Nova Scotia shipments increased 12.5%.
SOURCES
Statistics Canada Monthly survey of Manufacturing, July 2018
Table 16-10-0047-01 Manufacturers' sales, inventories, orders and inventory to sales ratios, by industry (dollars unless otherwise noted)
Table 16-10-0048-01 Manufacturing sales by industry and province, monthly (dollars unless otherwise noted) (x 1,000)
<--- Return to Archive