The Economics and Statistics Division maintains archives of previous publications for accountability purposes, but makes no updates to keep these documents current with the latest data revisions from Statistics Canada. As a result, information in older documents may not be accurate. Please exercise caution when referring to older documents. For the latest information and historical data, please contact the individual listed to the right.
<--- Return to Archive
For additional information relating to this article, please contact:
November 02, 2018NOVA SCOTIA - INTERNATIONAL MERCHANDISE TRADE SEPTEMBER 2018 Year-to-Date (Jan-Sep 2018 vs. Jan-Sep 2017, customs-based, unadjusted)

In Jan-Sep 2018, Nova Scotia International Merchandise Trade Exports increased 8.0% ($321.5 million) over Jan-Sep 2017, to $4.4 billion.
YTD - By Sector
Comparing Nova Scotia's exports for Jan-Sep 2018 with the same period last year the largest dollar value increase was in Forestry/Building/Packaging Materials ($125.4 million), Farm, Fishing & Inter. Food ($50.4 million), and Chemical, plastic, rubber ($40.6 million), Metal/Ores increased 42.8% but now makes up a relatively small portion of Nova Scotia's exports.
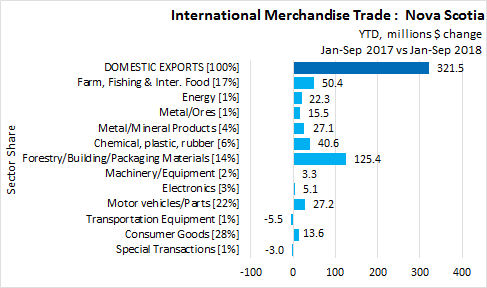

On a year-to-date basis, export values increased in
- Energy by 267.5% ($22.3 million)
- Metal/Ores by 42.8% ($15.5) million)
- Forestry/Building/Packaging Materials by 26.1% ($125.4) million)
- Metal/Mineral Products by 17.0% ($27.1) million)
- Chemical, plastic, rubber by 17.0% ($40.6) million)
- Farm, Fishing & Inter. Food by 7.3% ($50.4) million)
- Electronics by 4.7% ($5.1) million)
- Machinery/Equipment by 3.9% ($3.3) million)

In Jan-Sep 2018, Consumer Goods led the way with a value of $1,218.9 million (28% share), followed by
- Motor vehicles/Parts with a value of $957.9 million (22% share),
- Farm, Fishing & Inter. Food with a value of $745.0 million (17% share),
- Forestry/Building/Packaging Materials with a value of $606.0 million (14% share),
- Chemical, plastic, rubber with a value of $279.4 million (6% share),
- Metal/Mineral Products with a value of $186.2 million (4% share),
- Electronics with a value of $114.5 million (3 % share),
- Machinery/Equipment with a value of $88.4 million (2% share),
- Metal/Ores with a value of $51.7 million (1% share),
- Special Transactions with a value of $40.6 million (1% share),
- Transportation Equipment with a value of $39.1 million (1% share), and,
- Energy with a value of $30.5 million (1% share).
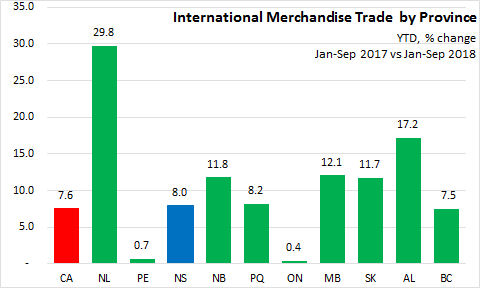
YTD by Province
In Jan-Sep 2018, Newfoundland and Labrador reported the highest increase (+29.8%) in merchandise trade exports over Jan-Sep 2017. Nova Scotia reported an 8.0% gain in merchandise trade exports. The Canadian average was a 7.6% increase in merchandise trade exports over Jan-Sep 2017.
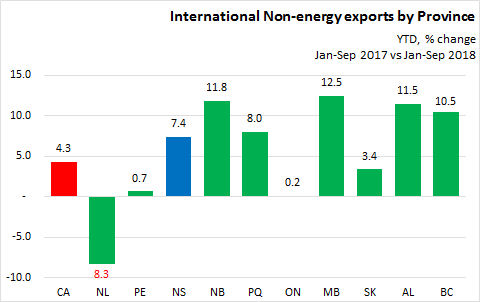
Excluding energy exports, Manitoba reported the fastest growth at 12.5%, followed by New Brunswick at 11.8% and Alberta at 11.5%. One province (Newfoundland and Labrador) was down 8.3%. Canada reported a 4.3% increase in Non-energy exports.
YTD EXPORTS BY INTERNATIONAL DESTINATION
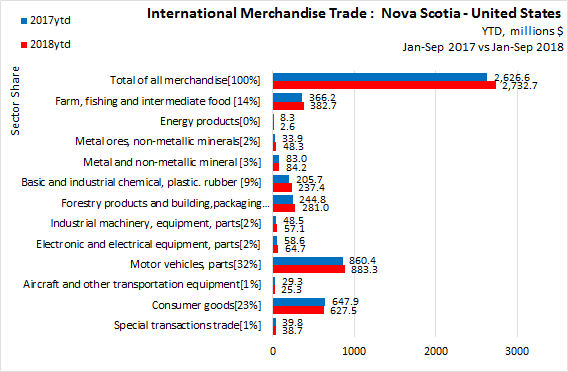
Total year-to-date exports to the United States increased over Jan-Sep 2017.
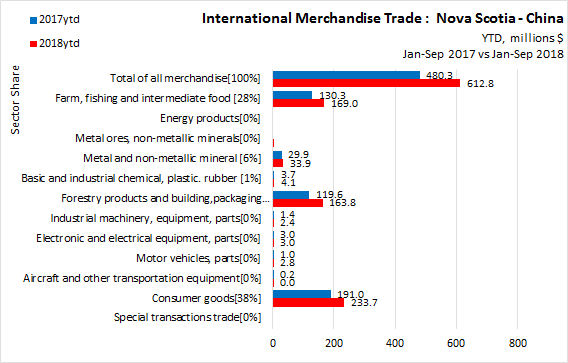
Total year-to-date exports to China increased over Jan-Sep 2017.
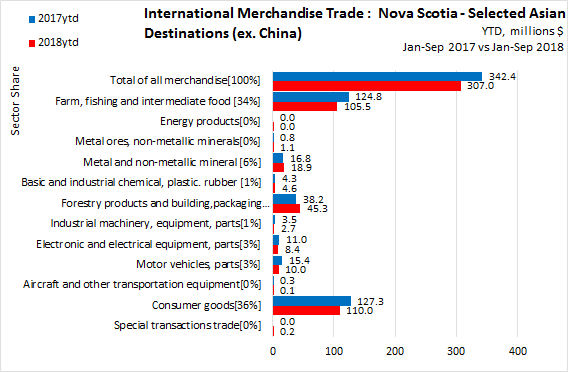
The aggregate year-to-date exports to other Major Asian countries (Japan, South Korea, Hong Kong, India, Taiwan, Indonesia and Singapore) declined over Jan-Sep 2017.

The aggregate year-to-date exports to other Major selected European countries (United Kingdom, Germany, Italy, France, Netherlands, Belgium and Spain) increased over Jan-Sep 2017.
Statistics Canada.
Table 12-10-0001-01 International merchandise trade by commodity (x 1,000,000)
12-10-0002-01 International merchandise trade by province and commodity (x 1,000,000)
12-10-0012-01 International merchandise trade by province, commodity, and Principal Trading Partners (x 1,000)
12-10-0099-01 Merchandise imports and exports, customs-based, by Harmonized commodity description and coding system (HS) section, Canada, provinces and territories, United States, states (x 1,000)
<--- Return to Archive