The Economics and Statistics Division maintains archives of previous publications for accountability purposes, but makes no updates to keep these documents current with the latest data revisions from Statistics Canada. As a result, information in older documents may not be accurate. Please exercise caution when referring to older documents. For the latest information and historical data, please contact the individual listed to the right.
<--- Return to Archive
For additional information relating to this article, please contact:
April 11, 2019INFRASTRUCTURE ECONOMIC ACCOUNTS, 2018 Statistics Canada has released the infrastructure economic accounts for 2018. Infrastructure is defined as physical structures and systems that support the production of goods and service and their delivery to and consumption by governments, business and citizens. Infrastructure assets are tangible assets that generally enable or perform a support function and includes both economic asset (i.e. highways, road, energy generation/transmission, sewage systems) and social assets (i.e. hospitals, schools, pollution abatement, recreation facilities, law enforcement facilities). The value of the capital stock is measured using perpetual inventory method where investment are positive flows that accumulated the asset which is depreciated over time as assets age. Assets in the data can be separated by purchasing sector, asset type, or function. Infrastructure assets do not include all types of non-residential assets, for instance buses and trains are included while some other types of mobile assets (defense ships, aircraft, ambulances) are not considered part of infrastructure assets.
At the end of 2018, Noa Scotia's infrastructure net capital stock was $16.3 billion or $16,986 per person. Nationally, infrastructure net capital stock was $852 billion or $22,995 per person. Newfoundland and Labrador and Prairie Provinces had the highest per capita infrastructure stock at the end of 2018.
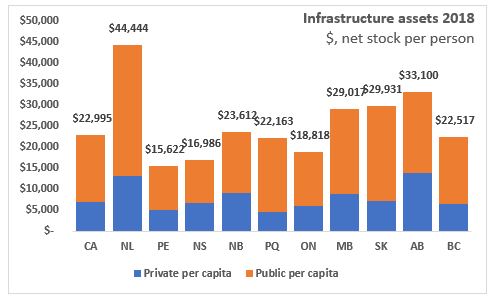
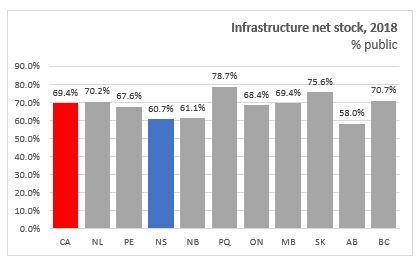
Public assets make up the majority of infrastructure assets and account for 69.4 per cent in Canada. As a share of total assets, Nova Scotia had the smallest share of infrastructure assets in the public sector at 60.7 per cent. Quebec, Manitoba and British Columbia, and Newfoundland and Labrador had less than 30 per cent of there infrastructure assets classified as private sector.
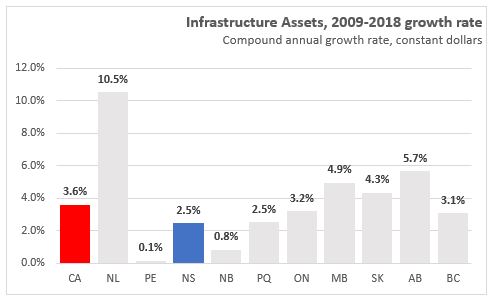
Over the past nine years, the value of the infrastructure assets in Nova Scotia has grown 2.5 per cent per year. Nationally, the infrastructure net capital stock has grown 3.6 per cent per year with the fastest growth in Newfoundland and Labrador, Alberta, and Manitoba.
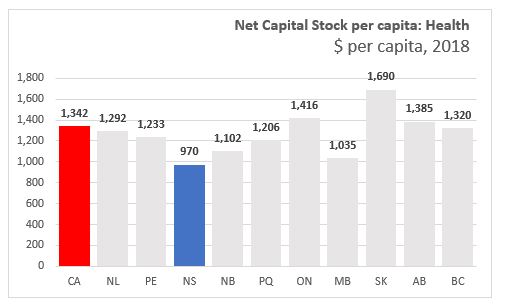
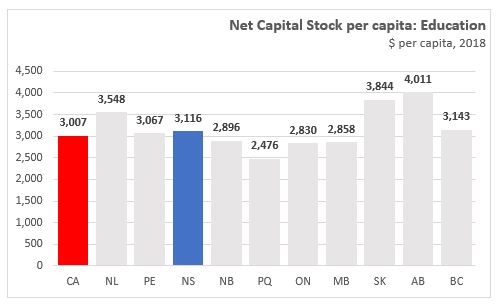
Examining the net capital stock per capita of infrastructure assets by their function shows there are differing levels of per capita infrastructure assets across the provinces. The net capital stock per capita of health assets was $970 per person in Nova Scotia, below the national average of $1,342 per person. Saskatchewan and Ontario had the highest per capita health assets at the end of 2018. Education infrastructure assets in Nova Scotia were $3,116 per person above the national average.
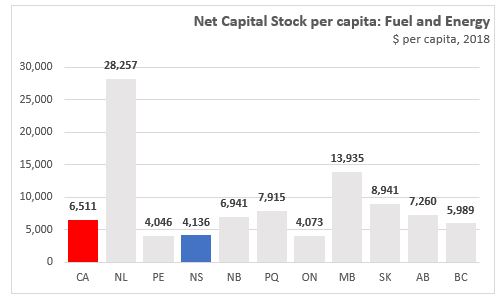
Infrastructure assets for fuel and energy functions were highest in Newfoundland and Labrador, followed by Manitoba, Saskatchewan, Ontario and Alberta.
Per capita infrastructure assets for housing and community are higher in the Prairie Provinces, Newfoundland and Labrador and British Columbia.

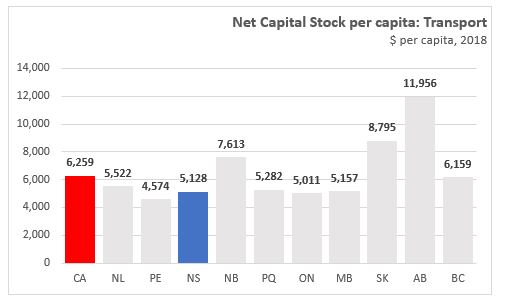
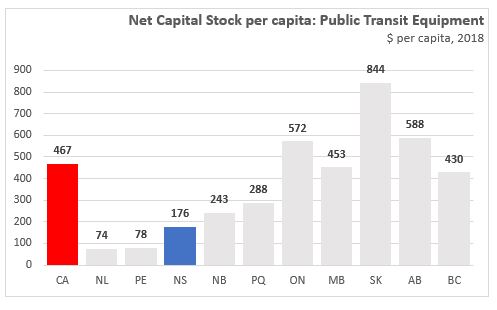
Transportation assets per capita were highest in Alberta, Saskatchewan and New Brunswick at the end of 2018. Nova Scotia transportation assets per person were $5,128. The capital stock of public transit per person was highest in Saskatchewan, Alberta and Ontario at the end of 2018.
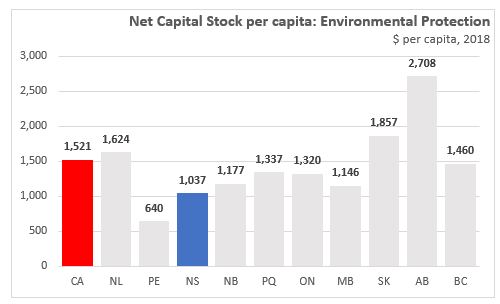
Environmental protection assets per capita were highest in Alberta at $2,709 per person and lower in Prince Edward Island and Nova Scotia.
Communication assets per capita were highest in New Brunswick, Ontario and Quebec. Nova Scotia with $601 in net capital stock per person was below the national average of $904.

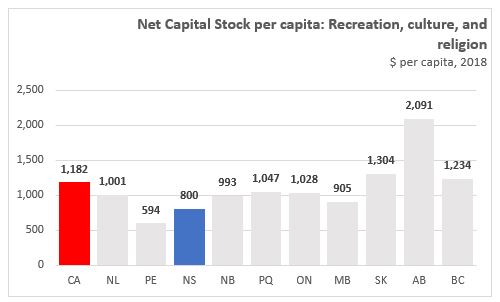
The value of the net capital stock per person for assets used for recreation, culture and religion was $800 per person in Nova Scotia. The highest per capita assets was in Alberta. Nova Scotia assets in public order and safety at $339 per person were above the national average ($286).

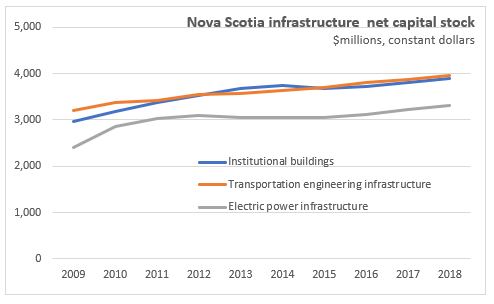
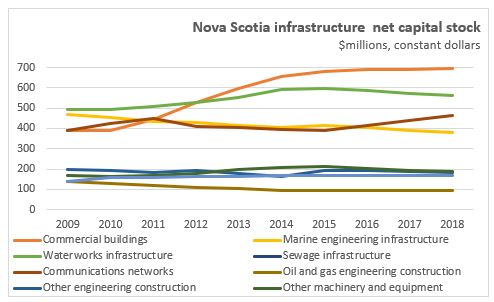
In general when measured in constant dollars, the value of Nova Scotia infrastructure assets have increased over the past nine years. Among the largest infrastructure asset types, commercial buildings have seen an increase of 6.7 per cent per year , transportation infrastructure is up 2.3 per cent per year and electric power has risen 3.6 per cent per year. Marine engineering infrastructure (-2.3%/a), sewage infrastructure (-0.6%/year), oil and gas engineering (-3.8%/year) and other engineering (-0.9%/year) have seen declines in net capital stock since 2009.
Infrastructure assets can also be measured by the "remaining useful service life" which is estimated as a percentage of service life remaining relative to the total service life of the asset. It is measured as the ratio of the average asset age to its expected service life. Changes to the remaining useful service life can come from changes in the investment level or in the investment mix. The remaining service life of infrastructure assets has generally risen in Nova Scotia from 48.6 per cent in 2009 to 52.4 per cent in 2018. The smallest increase in the remaining service life ratio has been in marine engineering infrastructure (+0.1 percentage points) while oil and gas engineering construction (-3.8 percentage points) has seen a decline.

Statistics Canada: Infrastructure Economic Accounts, 2018
<--- Return to Archive