The Economics and Statistics Division maintains archives of previous publications for accountability purposes, but makes no updates to keep these documents current with the latest data revisions from Statistics Canada. As a result, information in older documents may not be accurate. Please exercise caution when referring to older documents. For the latest information and historical data, please contact the individual listed to the right.
<--- Return to Archive
For additional information relating to this article, please contact:
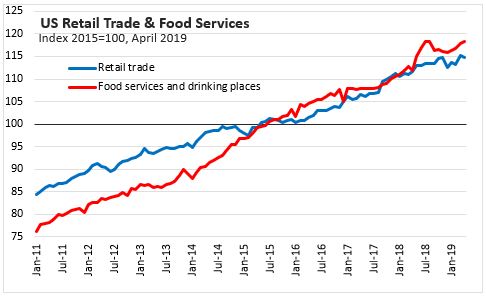
May 15, 2019US RETAIL SALES, APRIL 2019 The US Census Bureau announced today that the advance estimates of U.S retail and food service sales for April 2019, was a seasonally adjusted , month-over-month 0.2 per cent decrease ($1.0 billion) over March 2019 to $513.4 billion, and a year-over-year 3.1 per cent increase over April 2018.
Excluding food services and drinking places, retail trade sales decreased 0.2 per cent over March 2019, and increased 2.8 per cent over April 2018. Food service and drinking place month-over-month receipts increased 0.2 per cent to $61.5 billion.
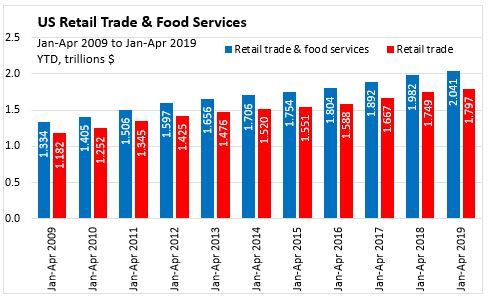
Year-To-Date
In Jan-Apr 2019, United States seasonally adjusted Retail Trade & Food Services increased 3.0 per cent over Jan-Apr 2018. Retail trade increased 2.7 per cent and food services and drinking places sales increased 4.9 per cent.
SECTOR ANALYSIS
Sales were up in 9 of 13 retail categories, the fastest gains being reported in building materials, health and personal, and non-store retailers. The largest declines were seen in sporting and recreation, and miscellaneous retailers (in percentage terms).
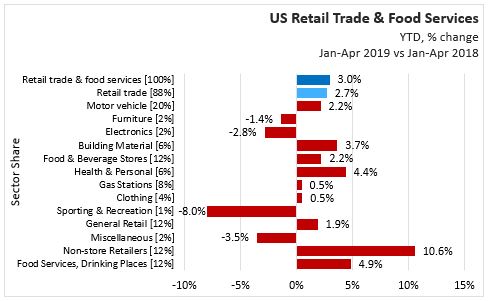
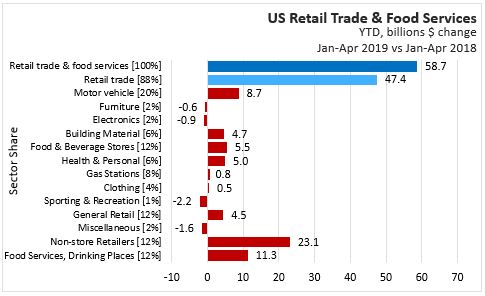
In Jan-Apr 2019 vs Jan-Apr 2018,
Retail Trade, 88.0% of total retail trade & food services, increased 2.7% ($47.4 billion) to $1,797 billion.
- Motor vehicle sector, 20.3% of total retail trade & food services, increased 2.2% ($8.7 billion).
- Furniture stores, 2.0% of total retail trade & food services, decreased 1.4% ($0.6 billion).
- Electronics stores, 1.6% of total retail trade & food services, decreased 2.8% ($0.9 billion).
- Building materials, 6.5% of total retail trade & food services, increased 3.7% ($4.7 billion).
- Food and beverage stores, 12.3% of total retail trade & food services, increased 2.2% ($5.5 billion).
- Heath, personal care stores, 5.8% of total retail trade & food services, increased 4.4% ($5.0 billion).
- Gasoline Stations, 8.3% of total retail trade & food services, increased 0.5% ($0.8 billion).
- Clothing stores, 4.5% of total retail trade & food services, increased 0.5% ($0.5 billion).
- Sports and hobby stores, 1.2% of total retail trade & food services, decreased 8.0% ($2.2 billion).
- General merchandise stores, 11.8% of total retail trade & food services, increased 1.9% ($4.5 billion).
- Miscellaneous retail, 2.1% of total retail trade & food services, decreased 3.5% ($1.6 billion).
- Non-store retailers, 11.8% of total retail trade & food services, increased 10.6% ($23.1 billion).
Food services, drinking places, 12.0% of total retail trade & food services, increased 4.9% ($11.3 billion).
Source: US Census Bureau, Data Tables
<--- Return to Archive