The Economics and Statistics Division maintains archives of previous publications for accountability purposes, but makes no updates to keep these documents current with the latest data revisions from Statistics Canada. As a result, information in older documents may not be accurate. Please exercise caution when referring to older documents. For the latest information and historical data, please contact the individual listed to the right.
<--- Return to Archive
For additional information relating to this article, please contact:
September 11, 2019STUDY: MAXIMUM INSIGHTS ON MINIMUM WAGE WORKERS: 20 YEARS OF DATA Statistics Canada released a report on minimum wage workers that examines the characteristics of minimum wage workers over the past 20 years based on data from the Labour Force Survey.
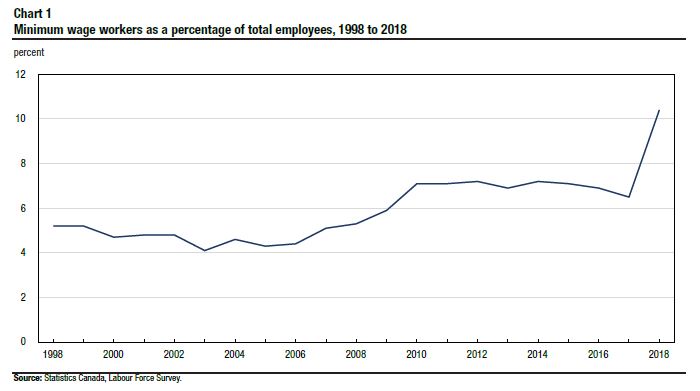
Minimum wage increases were gradual over the 1998 to 2017 period, but had notable increases around 2018 in Ontario (+20.7%), Alberta (+23.0%) and British Columbia (+11.4%). The proportion of employees who earned minimum wage in Canada was between 4.1 and 5.2 per cent in 1998 to 2007, but then rose to around 7 per cent after the 2008-2009 recession through 2016. In 2018, minimum wage workers increased by 617,500 (+60.7%) lifting the proportion to 10.4 per cent of all employees (see chart 1). Between 2008 and 2018, the largest increases in the proportion of minimum wage workers occurred in Ontario, Alberta and British Columbia. The proportion of employees earnings minimum wage increased from 6.4 per cent in 2008 to 7.2 per cent in 2018 in Nova Scotia (see chart 2).

Minimum wage workers are more prevalent among females than males. Among female employees, 12.3 per cent work at minimum wage level compared to 8.5 per cent of male workers in 2018. Minimum wage work was is more prevalent among persons aged 15 to 24 with 35.9 per cent working in for minimum wage, compared to 5.4 per cent in core working age (5.4 per cent) and 55 and over (7.4 per cent). The prevalence of minimum wage work increased for all age groups between 2008 and 2018. Compared to similar prevalence rates (around 5.3 per cent) in 2008, the prevalence of minimum wage workers rose more among landed immigrants (12.0 per cent) than among Canadian-born employees (9.8 per cent) by 2018. From 1998 to 2018, among employees with a postsecondary diploma, the proportion who earned minimum wage increased from 2.3 per cent to 5.5 per cent while the proportion among those with a high school diploma or less increased from 8.3 per cent to 20.0 per cent.
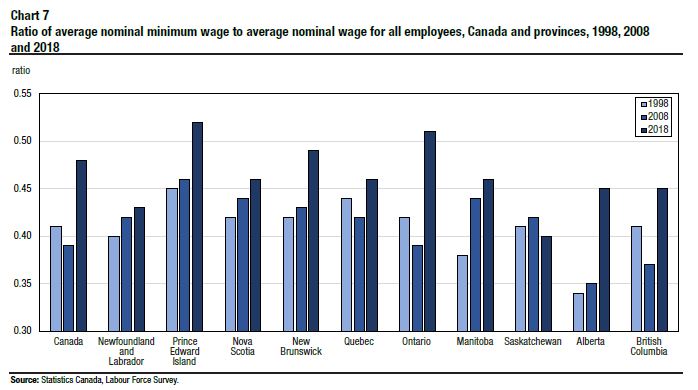
The average minimum wage in Canada increased at a faster pace of 3.5 per cent per year than the average wage for all employees at 2.7 per cent per year over the 1998-2018 period. The ratio of the average minimum wage to average wage for all employees expresses the minimum wage in terms of percentage of the average wage for all employees. The ratio declined in Canada from 0.41 to 0.38 over 1998-2007, indicating a relatively slower pace in minimum wage growth compared to average wage. The ratio then increased after 2007 to reach 0.43 in 2017. In 2018, after the minimum wage increases in Ontario, Alberta and British Columbia, the ratio was lifted to 0.48, the highest in 20 years. The minimum wage to average wage ratio in Nova Scotia has increased from 0.42 in 1998, to 0.44 in 2008 and 0.46 in 2018, meaning that minimum wage has risen faster than the average wage. All provinces, except Saskatchewan, experienced increases in the ratio from 1998 to 2018 (see chart 7).
Further information on minimum wage worker characteristics by urban and rural, sectors, firm size, economic family status, is available in the full report.
Source: Statistics Canada. Daily Release; Full Report
<--- Return to Archive