The Economics and Statistics Division maintains archives of previous publications for accountability purposes, but makes no updates to keep these documents current with the latest data revisions from Statistics Canada. As a result, information in older documents may not be accurate. Please exercise caution when referring to older documents. For the latest information and historical data, please contact the individual listed to the right.
<--- Return to Archive
For additional information relating to this article, please contact:
September 24, 2019HIGH INCOME TRENDS AMONG CANADIAN TAXFILERS, 2017 Statistics Canada has released the latest trends for high income earners in Canada: the top 0.01 per cent, the top 0.1 per cent, the top 1 per cent, the top 5 per cent, the top 10 per cent and the top 50 per cent. The latest data are from the 2017 taxation year.
The threshold for the top 1 per cent of tax filers varies from Province to Province and from City to City. In Canada, those reporting total income over $236,000 in 2017 represent the top 1 per cent of taxfilers by earnings. In Nova Scotia, there are fewer individuals with higher incomes and the threshold of the top 1 per cent is $182,600. In Halifax, the threshold of the top 1 per cent of earners was $211,300.
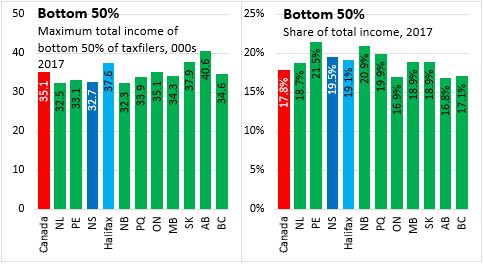
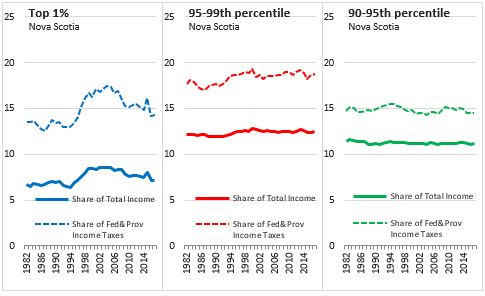
The top 1 per cent of earners in Canada accounted for 9.9 per cent of the total income reported in 2017. In comparison, the bottom 50 per cent of taxfilers accounted for 17.8 per cent of total income. In Nova Scotia, the top 1 per cent accrues a lower share of total income than the national average: 7.1 per cent, while the bottom 50 per cent receives a higher share of total income than the national average: 19.5 per cent.
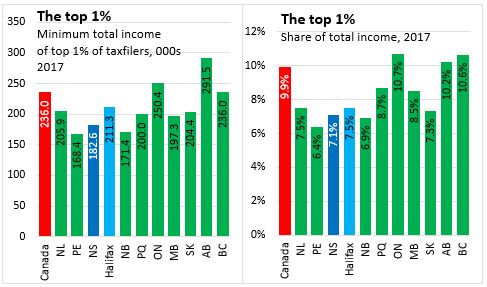

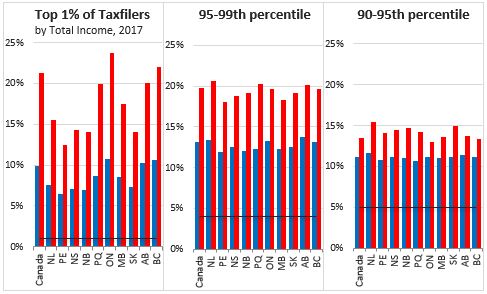
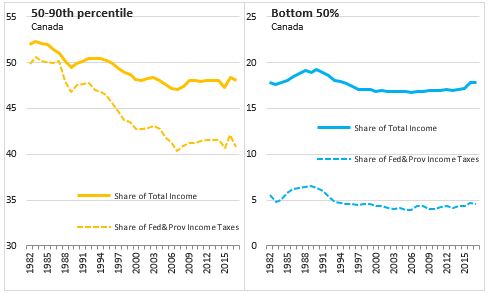
Across Provinces, there is some variation in the share of total income accounted for by the top 1 per cent of filers - with the highest shares reported in Ontario, British Columbia and Alberta (note that each province has a different threshold that defines the top 1 per cent). In every province, the top 10 per cent of tax filers bear a higher share of Federal and Provincial taxes than their share of total income. Those in the 50th-90th percentiles of income earners bear a lower share of taxes than their share of income. Among those in the bottom 50 per cent of earners, there is a much lower share of taxes relative to shares of income.
The top 1 per cent of income earners in Ontario also bear the highest share of Federal and Provincial income taxes in Canada (relative to other income groups); those in the bottom 90 per cent of the Ontario income distribution bear the lowest share of taxes.

In the last year, there was an increase in the share of Canadian income for the top 1 per cent. There were decreases in the share of income for the 95th-99th percentile as well as the 90th-95th and 50th-90th percentiles. The share of income was unchanged for the bottom 50 per cent in 2017.
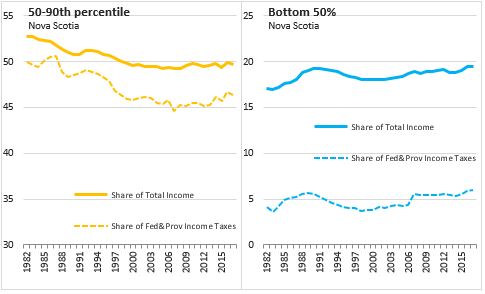
The share of income accruing to the top 1 per cent of Canadian earners rose steadily until 2006, when it began to decline - reaching a bottom in 2013 and rising again in 2015. In recent years, there was a rise in the share of Canadian income accruing to the 95th-99th, 90th-95th and 50th-90th percentiles. Since 2014, these shares have declined for the 95-99th and 90-95th percentiles, while the share of income for the 50-90th percentile declined and then rose back to similar levels seen in recent years. The share of Canadian income for the bottom 50 per cent of taxfilers rose slowly over the last decade but has increased faster since 2015.

In Nova Scotia, the share of income reported by the top 10 per cent of individuals has been lower and more stable than the national trend. There have recently been increases in the share of Nova Scotia income among the bottom 50 per cent of taxfilers. The share among those in the 50th-90th percentiles has increased modestly over the last decade.
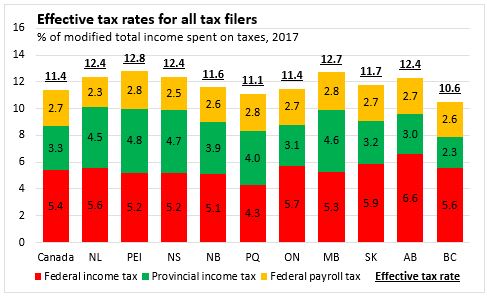
Statistics Canada also reported the effective tax rates for provinces and income groups. The effective tax rate is a measure of the size of certain government tax programs relative to individual incomes. It is the average of every individual tax filer's ratio of taxes paid to modified total income. These rates respond to changes in both tax programs and the distribution of income, which can reflect both economic and demographic change.
Nationally, the average effective tax rate declined from 11.8 per cent to 11.4 per cent in 2017. The decline was due to the decline in provincial income tax (-0.3 percentage points) and federal payroll tax (CPP and EI contributions, -0.1 percentage points), which more than offset the increase in effective federal income tax rates (+0.1 percentage points). Across the country, average effective tax rates are highest in Prince Edward Island and lowest in British Columbia.
In Nova Scotia, the average effective tax rate for individual tax filers was 12.4 per cent, unchanged from 2016. The average effective federal tax rate was 5.2 per cent, the effective provincial rate was 4.7 per cent, and effective federal payroll tax rate was 2.5 per cent.
The top 1 per cent of tax filers in Nova Scotia had an effective tax rate of 31.3 per cent in 2017. Nationally, the rate was 30.9 per cent with the highest effective rate in Newfoundland and Labrador (35.5 per cent) and lowest in Saskatchewan (24.7 per cent).
Note: Total income consists of income from earnings, investments, pensions, spousal support payments and other taxable income plus government transfers and refundable tax credits. Modified total income is total income plus capital gains and registered retirement savings plan withdrawals made by persons under 65, less social benefits repayments. Federal Income taxes are derived from line 420 of the federal income tax return and exclude the Quebec abatement.
Sources:
Statistics Canada. Table 11-10-0054-01 Federal and provincial individual effective tax rates
Statistics Canada. Table 11-10-0056-01 High income tax filers in Canada, specific geographic area thresholds
<--- Return to Archive