The Economics and Statistics Division maintains archives of previous publications for accountability purposes, but makes no updates to keep these documents current with the latest data revisions from Statistics Canada. As a result, information in older documents may not be accurate. Please exercise caution when referring to older documents. For the latest information and historical data, please contact the individual listed to the right.
<--- Return to Archive
For additional information relating to this article, please contact:
October 22, 2019CANADIAN COMMUNITY HEALTH SURVEY, 2017/2018 Statistics Canada has released combined data for 2017 and 2018 from the Canadian Community Health Survey. These estimates include information by population centres and on food insecurity by living arrangement. This measure of food insecurity indicates whether households were able to afford the food they needed in the previous 12 months. Moderately food insecurity indicates there was a compromise if quality and/or quantity of food consumed, and severely food insecure indicates there was reduced food intake and disrupted eating patterns.
Note that * denotes "use with caution"
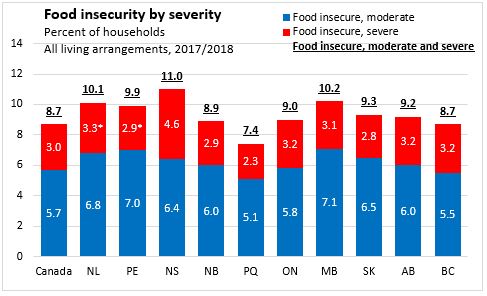
In 2017/2018, 11.0 per cent of Nova Scotian households reported moderate or severe food insecurity, reflecting 43,600 households. This rate was the highest among the provinces, followed by Manitoba (10.2 per cent) and Newfoundland and Labrador (10.1 per cent). The lowest reported incidence of household food insecurity was in Quebec at 7.4 per cent of households reporting moderate or severe food insecurity. Nationally, 8.7 per cent of households reported being food insecure.
Most families that report food insecurity report moderate food insecurity. In 2017/2018, 6.4 per cent of households reported moderate food insecurity, while 4.6 per cent reported severe food insecurity. Severe food insecurity in Nova Scotia was the highest among the provinces.
Among couples with children under 18 years of age, 9.2 per cent of Nova Scotian families reported moderate or severe food insecurity. The highest rate among provinces was in New Brunswick (9.9 per cent) while the lowest was in Quebec (6.1 per cent). Nationally, 7.3 per cent of couple families with children reported being food insecure in 2017/2018.

Note that * denotes "use with caution"
In Nova Scotia, 4.6 per cent of couples without children reported being food insecure in 2017/2018. Nationally, 3.4 per cent of couples without children reported being food insecure. The highest rate of food insecurity among couples without children was in Prince Edward Island (5.5 per cent) while the lowest rate was in Quebec (2.3 per cent).

Note that * denotes "use with caution"
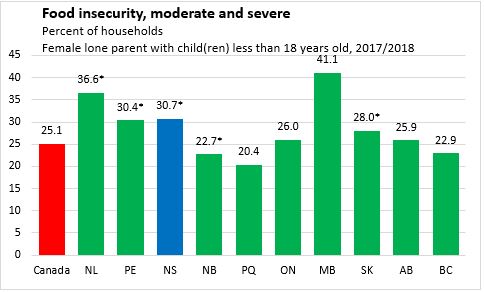
Female lone parent families have the highest rates of food insecurity across the country. In Nova Scotia, the rate was 30.7 per cent in 2017/2018. Nationally, 25.1 per cent of female lone parent families reported food insecurity, with the lowest rate in Quebec (20.4 per cent) and the highest in Manitoba (41.1 per cent).
Note that * denotes "use with caution"
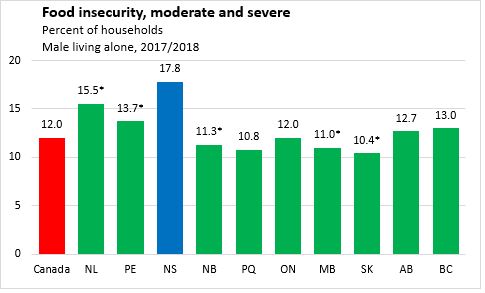
In Nova Scotia, 17.8 per cent of males living alone reported moderate to severe food insecurity in 2017/2018. This was the highest rate among the provinces, while the lowest was in Saskatchewan (10.4 per cent). Nationally, 12.0 per cent of males living alone reported food insecurity.
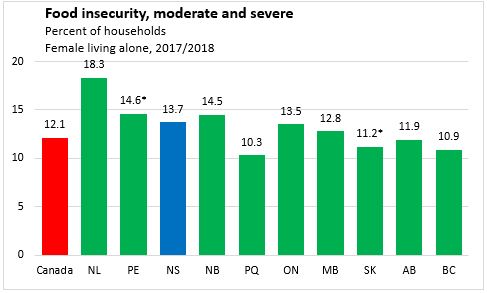
In the same year, 13.7 per cent of females reported moderate to severe food insecurity in Nova Scotia. Nationally, 12.1 per cent of females living alone reported food insecurity, with the highest rate in Newfoundland and Labrador (18.3 per cent) and the lowest rate in Quebec (10.3 per cent).
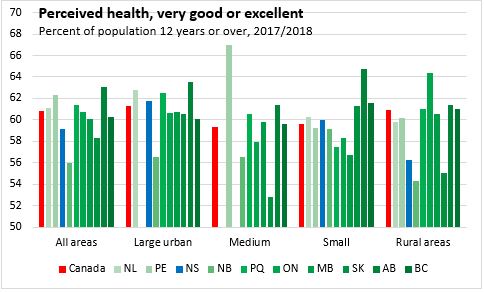
HEALTH CHARACTERISTICS BY POPULATION CENTRE
Population centres are classified into three groups: small, medium and large. Small population centres are those with population between 1,000 and 29,999, medium population centres have a population between 30,000 and 99,999 and large urban centres have a population of 100,000 or more. Rural areas are those that remain, including small towns, villages, and other populated places with less than 1,000 people. Note that no data were reported for medium population centres in Newfoundland and Labrador and Nova Scotia or for large urban areas in Prince Edward Island.
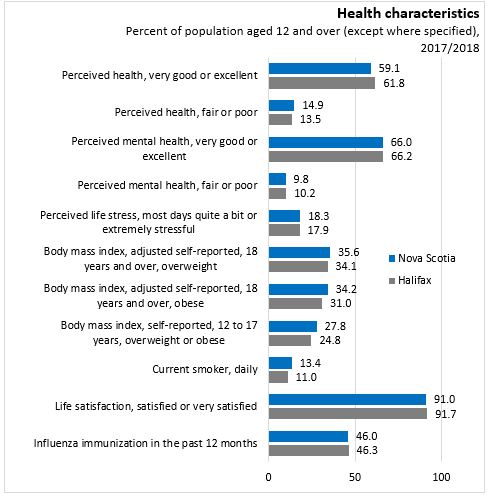
In Nova Scotia in 2017/2018, those in larger centres were more likely to report very good or excellent health compared to those in small or rural areas. Conversely, people in rural areas were more likely to report fair or poor health compared to those in large urban centres. Nationally, rates of self-reported very good or excellent health were comparable in large urban (60.8 per cent) and rural regions (60.9 per cent) and lower in medium and small population centres.

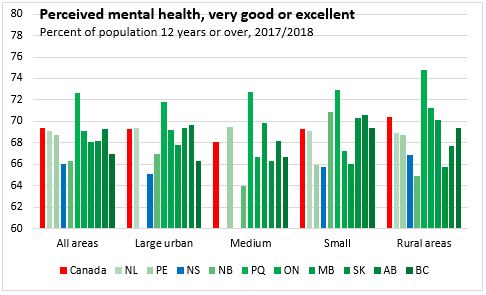
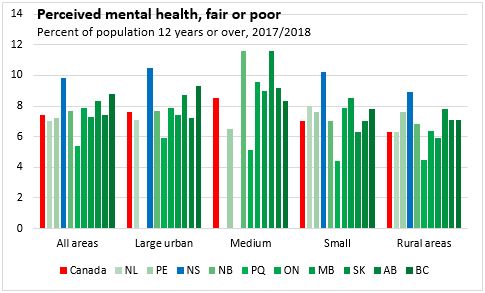
Rural areas were more likely to report very good or excellent mental health, both in Nova Scotia and nationally in 2017/2018. Reports of fair or poor mental health were highest for medium population centres.
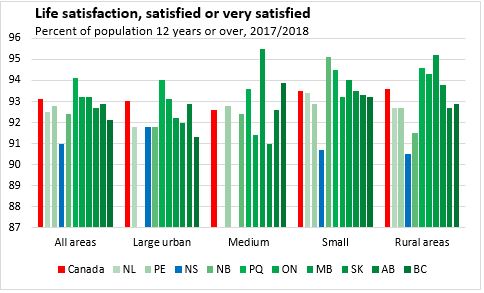
The percentage of the population that reported being satisfied or very satisfied with life was lower in rural areas of Nova Scotia compared to large urban centres. In most provinces, life satisfaction was higher in small population centres and rural areas than in large urban centres.
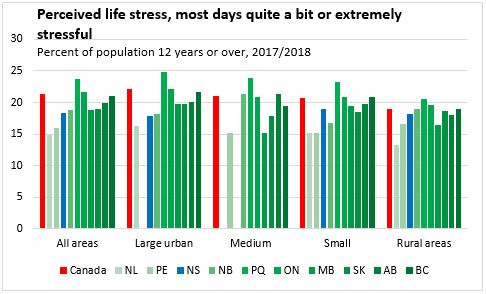
The percentage of the population that reported most days were quite a bit or extremely stressful tended to be lower in rural areas of most provinces in 2017/2018. In Nova Scotia, the perceptions of daily stress are similar between large urban populations (17.9 per cent) and those living in rural areas (18.2 per cent).
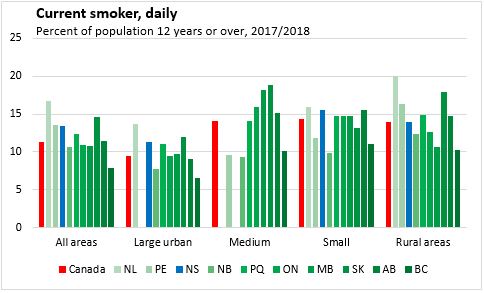
The prevalence of daily smoking was the higher for small population centres and rural areas than for large urban populations in Nova Scotia in 2017/2018.
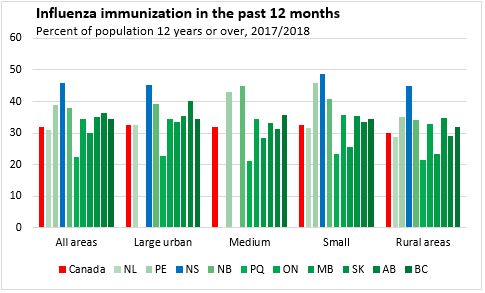
Nova Scotia reports the highest rates of influenza immunization for each size of population area.
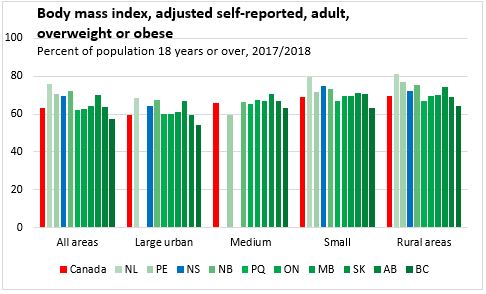
Adults (ages 18 and over) living outside of large urban centres were more likely to report overweight or obese Body Mass Index (BMI) in every province.
Youth aged 12 to 17 outside of large urban centres were also more likely to report overweight or obese BMI, except in the Atlantic provinces. Note that data are supressed in Prince Edward Island and New Brunswick due to confidentiality.
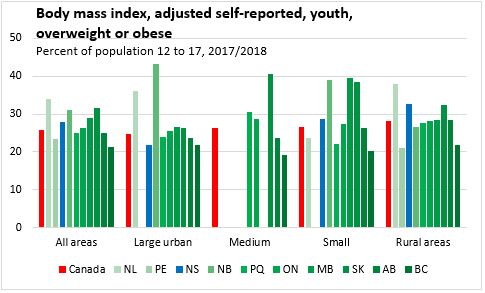
Results for the Halifax CMA largely reflect the observations for populations in large urban centres in Nova Scotia.
Source: Statistics Canada. Table 13-10-0385-01 Household food security by living arrangement
<--- Return to Archive