The Economics and Statistics Division maintains archives of previous publications for accountability purposes, but makes no updates to keep these documents current with the latest data revisions from Statistics Canada. As a result, information in older documents may not be accurate. Please exercise caution when referring to older documents. For the latest information and historical data, please contact the individual listed to the right.
<--- Return to Archive
For additional information relating to this article, please contact:
November 19, 2019NON-RESIDENTIAL CAPITAL STOCK REMAINING SERVICE LIFE, 2017 Statistics Canada released data on the age of the non-residential capital stock in the provinces. The assets are measured by the "remaining useful service life of non-residential capital stock" which is estimated as a percentage of service life remaining relative to the total service life of the asset. It is measured as the ratio of the average asset age to its expected service life. Changes to the remaining useful service life can come from changes in the investment level or in the investment mix.
CANADA AND PROVINCES
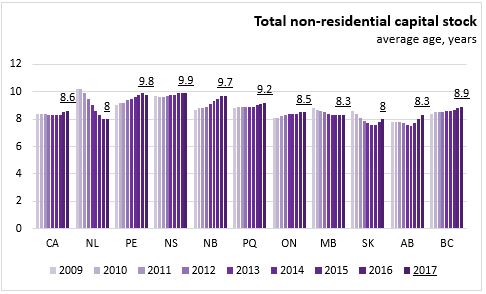
In 2017, the average age of the non-residential capital stock was 9.9 years in Nova Scotia compared to 8.6 years in Canada. After Nova Scotia, the oldest capital stock was in Prince Edward Island (9.8 years) and New Brunswick (9.7 years). The newest capital stock was in Saskatchewan and Newfoundland and Labrador (both 8.0 years).
Compared to 2009, average non-residential capital stock has aged by 0.2 years, with similar increase (+0.2 years) in Nova Scotia. New Brunswick had the most rapidly aging capital stock (+1 year) over this period while Newfoundland and Labrador, among the three provinces with declining age of capital stock, reported the largest from (-2.2 years).
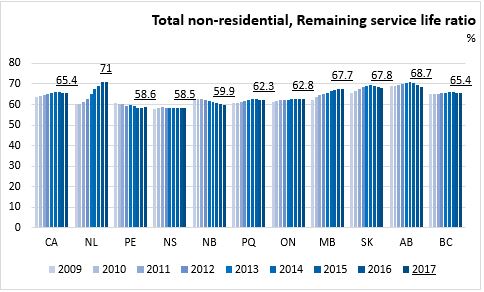
In 2017, the remaining useful service life ratio for the non-residential capital stock in Nova Scotia was up by 0.1 percentage points to 58.5 per cent. Nova Scotia has shortest remaining service life ratio among the provinces followed by Prince Edward Island (58.6 per cent). Canada's remaining service life ratio was down 0.3 percentage points to 65.4 per cent in 2017, on declines in remaining useful service life reported in Alberta, Saskatchewan, British Columbia and New Brunswick.
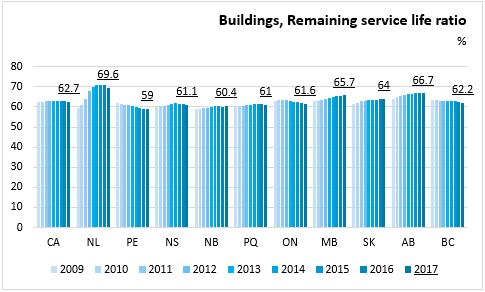
The remaining service life ratio of Canada's buildings was 62.7 per cent (61.1 per cent in Nova Scotia) in 2017. Across Canada Newfoundland and Labrador has the highest remaining useful service life for buildings at 69.6 per cent while Prince Edward Island has the lowest at 59.0 per cent.
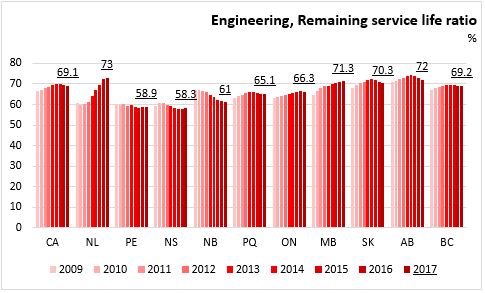
Nova Scotia has the lowest remaining useful service life for engineering assets at 58.3 per cent. Nationally, engineering assets have 69.1 per cent of remaining useful service life. The remaining service life for engineering assets continues to increase strongly in Newfoundland and Labrador (73 per cent).
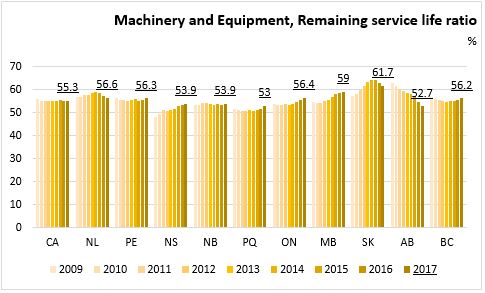
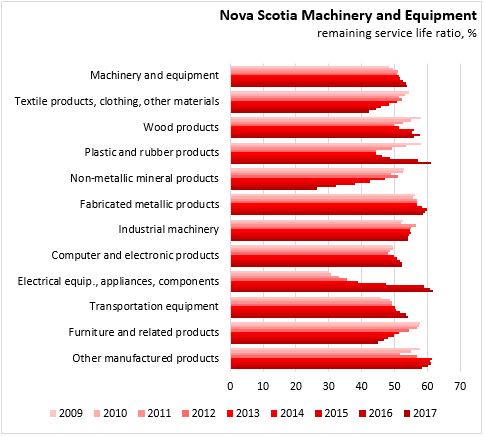
The remaining useful service life ratio for machinery and equipment in Canada was 55.3 per cent in 2017. Nova Scotia's remaining useful service life for machinery and equipment was 53.9 per cent. Saskatchewan had the highest remaining useful service life for machinery and equipment assets at 61.7 per cent while Alberta had the lowest at 52.7 per cent.
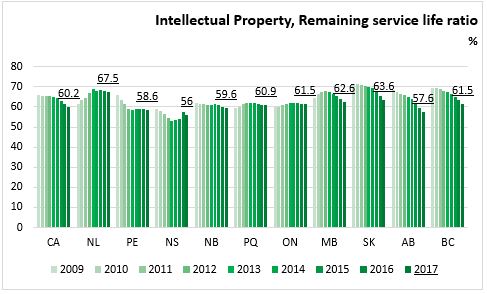
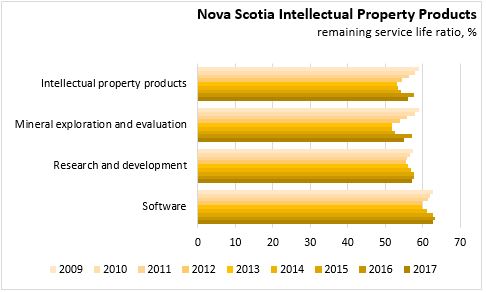
The remaining service life ratio for intellectual property products has been declining for Canada, falling to 60.2 per cent. This includes the intellectual property gathered as a result of oil and gas exploration activities. Nova Scotia's remaining useful service life for intellectual property assets decreased to 56 per cent in 2017, and this remains the lowest among provinces. Newfoundland and Labrador's remaining useful service life of intellectual property assets is highest at 67.5 per cent.
NOVA SCOTIA
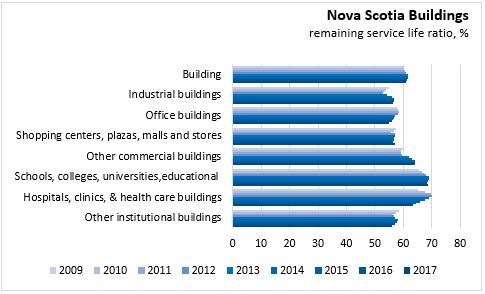
The remaining useful service life ratio of buildings in Nova Scotia was 61.1 per cent in 2017. The ratio has been rising for industrial buildings, other commercial (non-office, non-retail) structures and educational facilities. Remaining useful service life among health care and other institutional buildings has been falling.
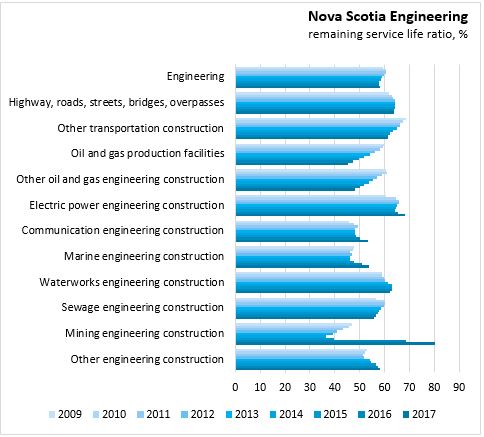
The remaining useful service life for engineering structures in Nova Scotia increased to 58.3 per cent in 2017 on notable rises in electric power and mining engineering service life. There continues to be diminishing service life in oil/gas assets.
The remaining useful service life for machinery and equipment was up to 53.9 per cent in 2017. There were increases in the ratio of remaining service life for plastic and rubber products, computers/electronics, electrical equipment/appliances and transportation equipment.
The remaining useful service life ratio for intellectual property products in Nova Scotia was up in 2016 due to an increase in mineral exploration, but the remaining useful service life of all intellectual property assets in 2017 fell to 56 per cent.
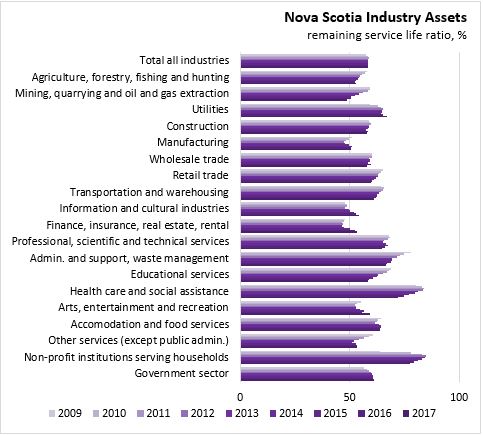
In terms of the non-residential capital stock by industry, the highest remaining useful service life ratios are found in the non-profit sector (77.5 per cent), health care and social assistance (72.2 per cent), administration and support services (66.7 per cent) and professional, scientific and technical services (64.7 per cent).
Statistics Canada. Table 34-10-0166-01 Average age measures of non-residential capital stock by industry, by asset, Canada, provinces and territories
<--- Return to Archive